. 2023 Feb 24;24(5):4517.
doi: 10.3390/ijms24054517.

Multiphoton FLIM Analyses of Native and UVA-Modified Synthetic Melanins

Affiliations

Multiphoton FLIM Analyses of Native and UVA-Modified Synthetic Melanins

Ana-Maria Pena et al. Int J Mol Sci. .

Abstract

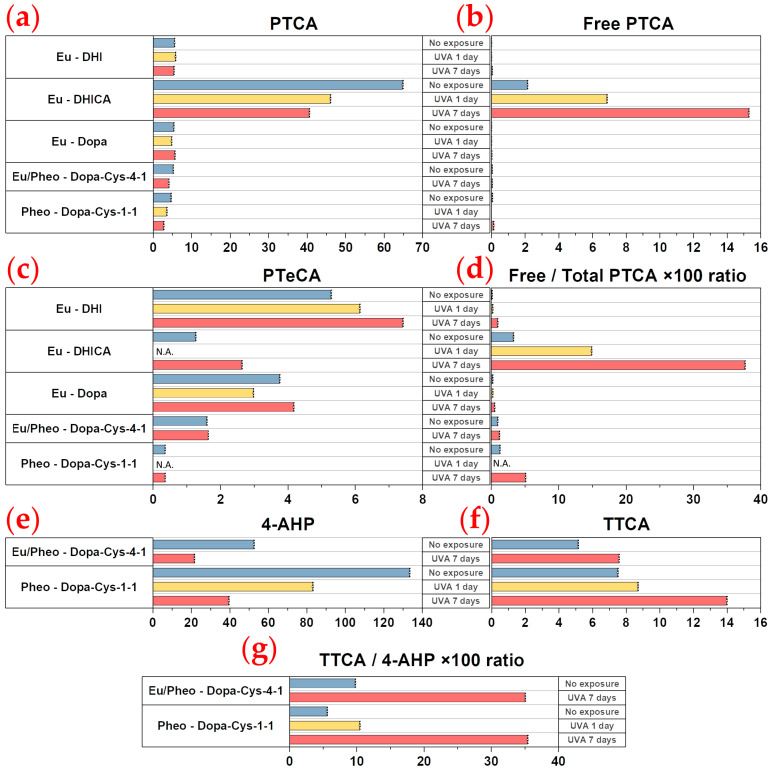
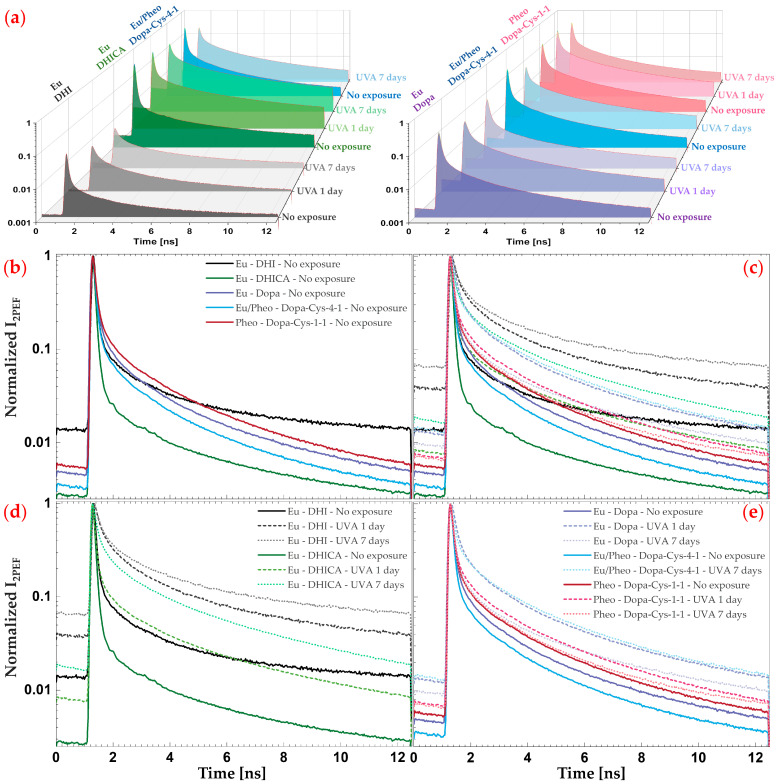
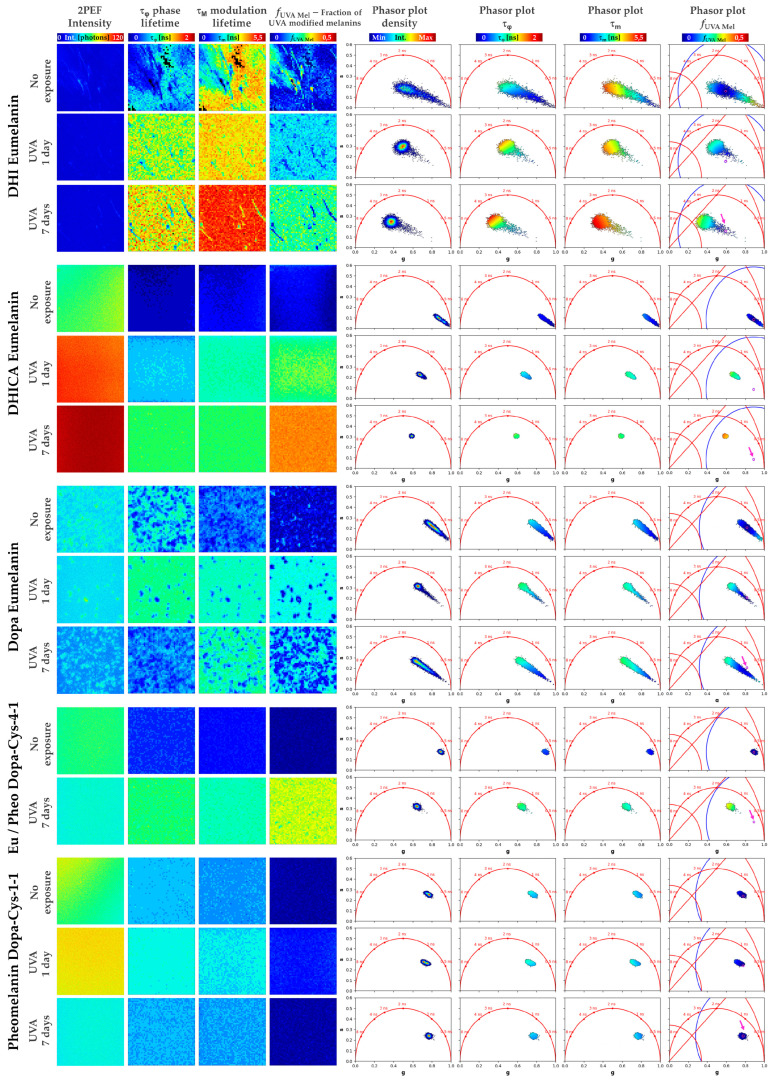
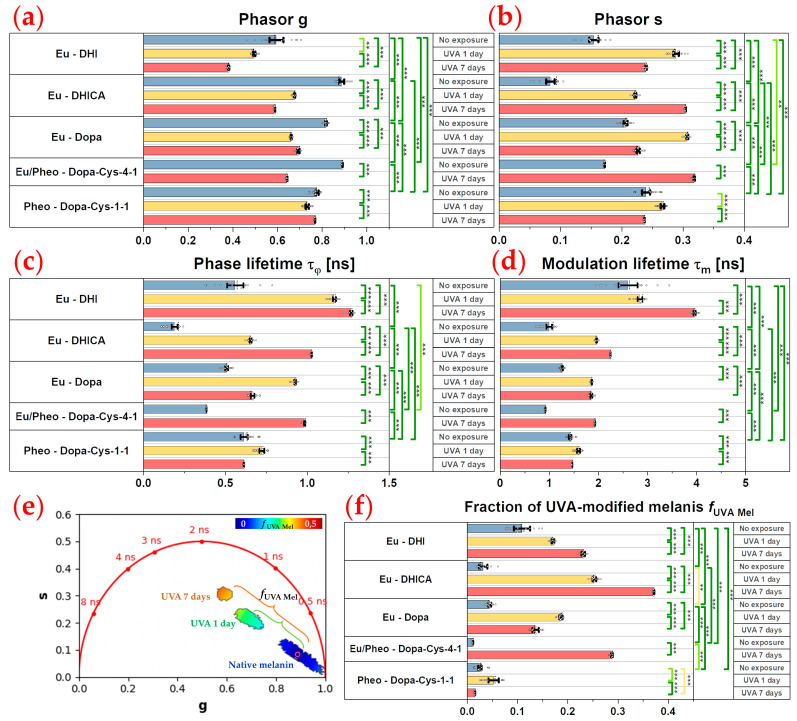
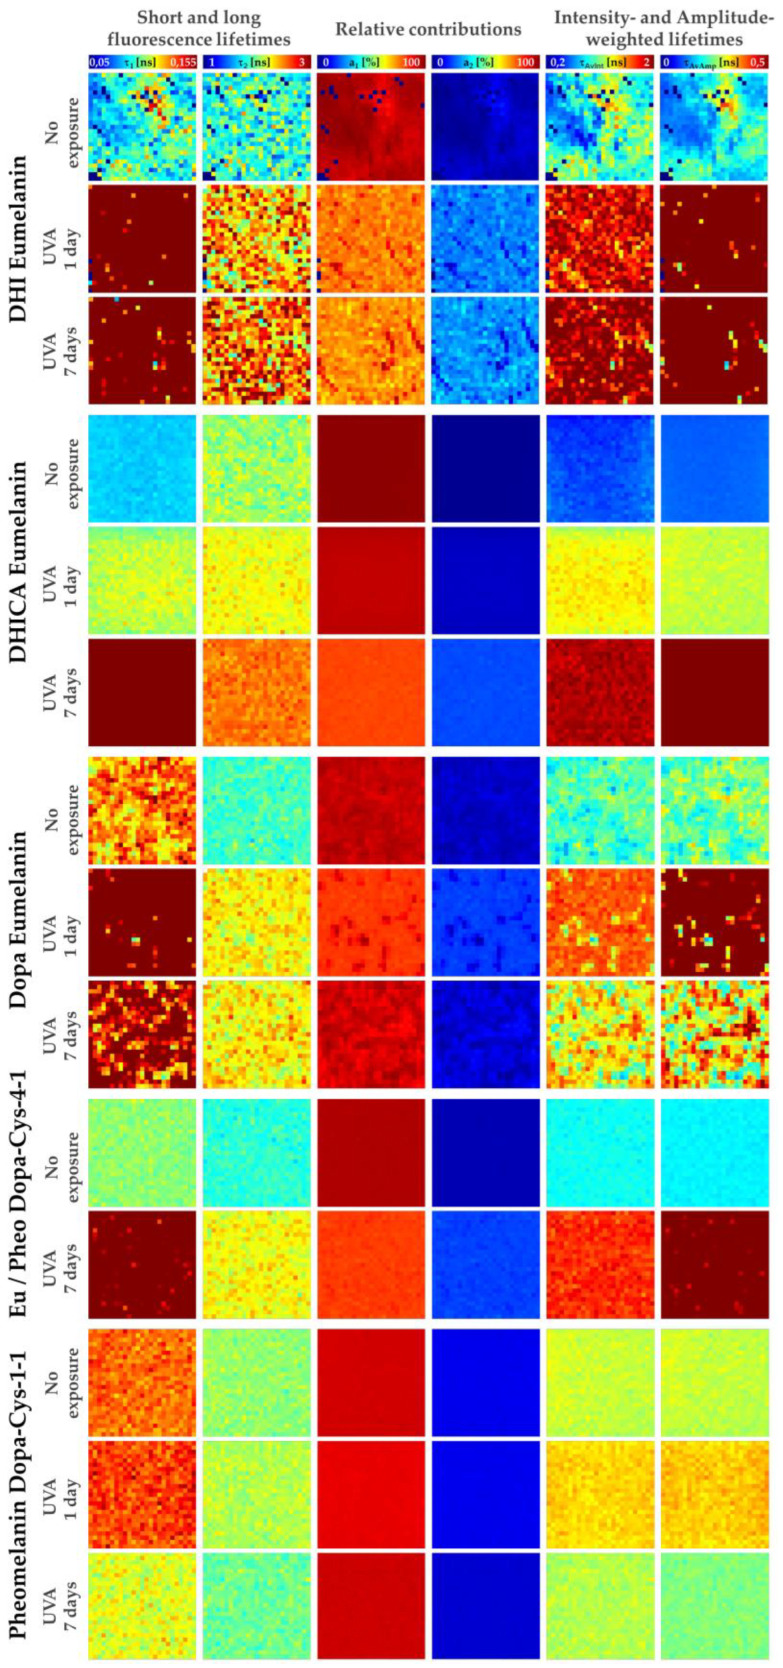
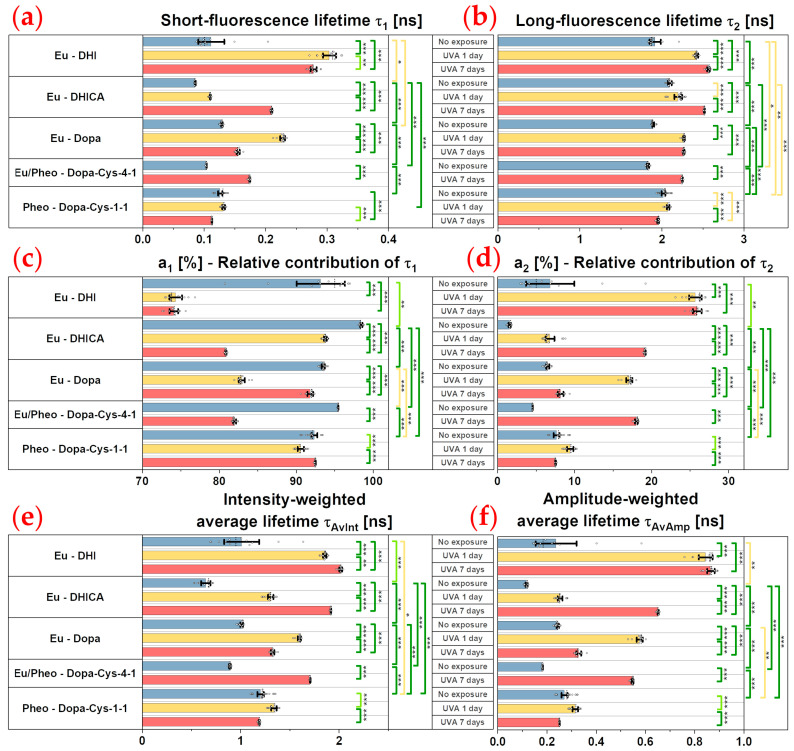
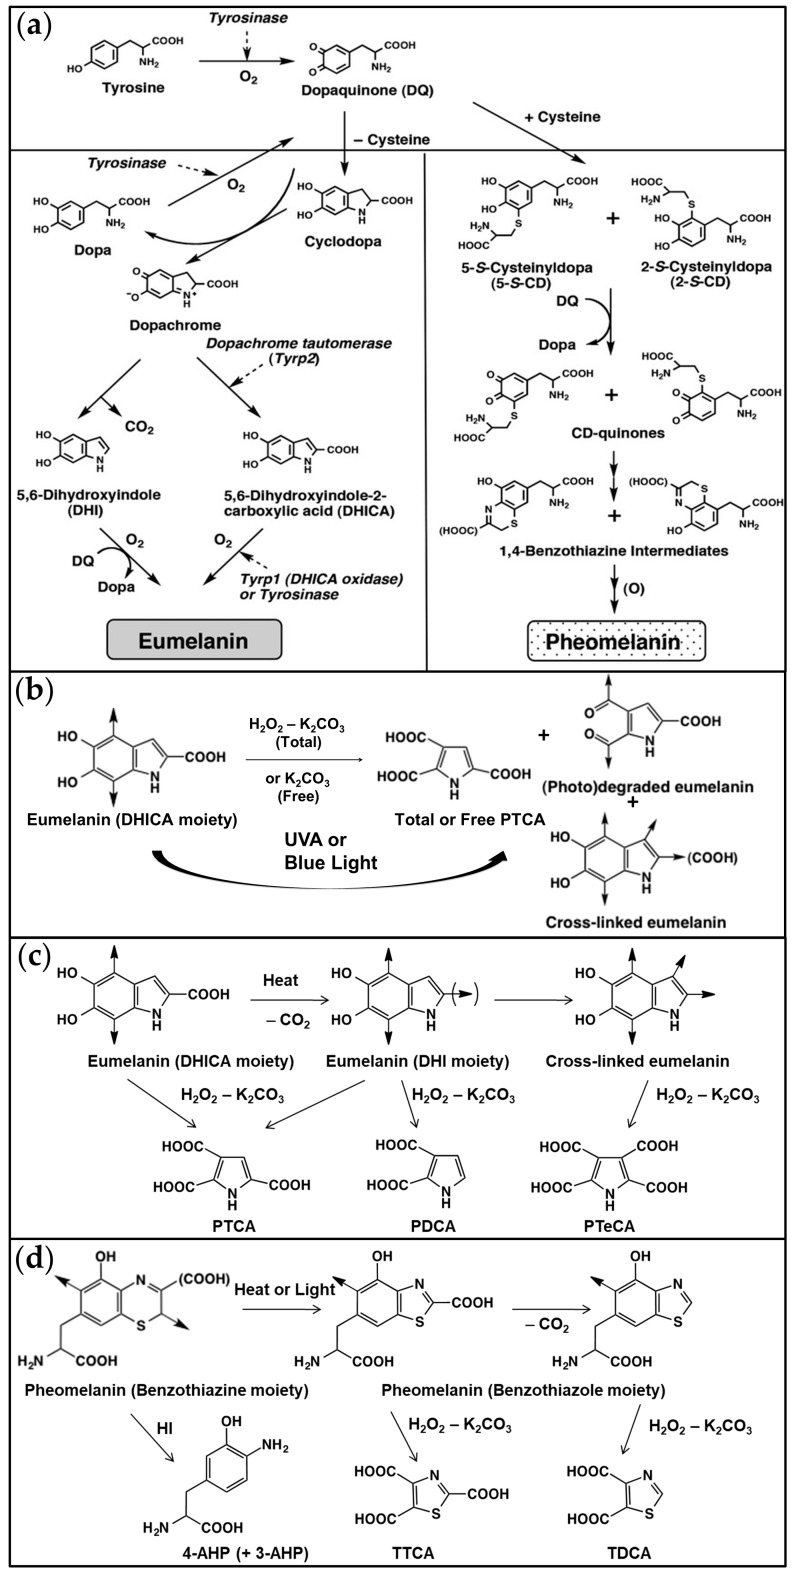
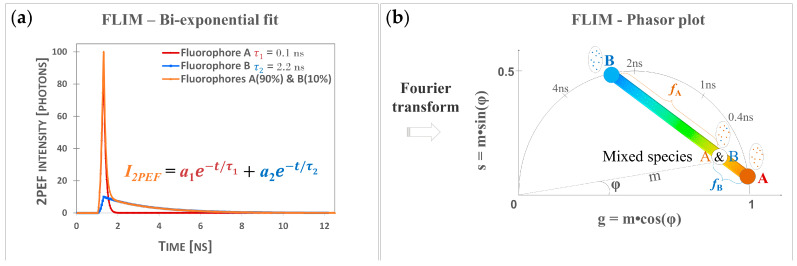
To better understand the impact of solar light exposure on human skin, the chemical characterization of native melanins and their structural photo-modifications is of central interest. As the methods used today are invasive, we investigated the possibility of using multiphoton fluorescence lifetime (FLIM) imaging, along with phasor and bi-exponential fitting analyses, as a non-invasive alternative method for the chemical analysis of native and UVA-exposed melanins. We demonstrated that multiphoton FLIM allows the discrimination between native DHI, DHICA, Dopa eumelanins, pheomelanin, and mixed eu-/pheo-melanin polymers. We exposed melanin samples to high UVA doses to maximize their structural modifications. The UVA-induced oxidative, photo-degradation, and crosslinking changes were evidenced via an increase in fluorescence lifetimes along with a decrease in their relative contributions. Moreover, we introduced a new phasor parameter of a relative fraction of a UVA-modified species and provided evidence for its sensitivity in assessing the UVA effects. Globally, the fluorescence lifetime properties were modulated in a melanin-dependent and UVA dose-dependent manner, with the strongest modifications being observed for DHICA eumelanin and the weakest for pheomelanin. Multiphoton FLIM phasor and bi-exponential analyses hold promising perspectives for in vivo human skin mixed melanins characterization under UVA or other sunlight exposure conditions.

Keywords: BZ-AA pure benzothiazine; DHBTCA pure benzothiazole; DHI; DHICA; Dopa; Dopa-Cys; HPLC chemical analysis; UVA exposure; eumelanin; mixed eu-/pheo-melanins; multiphoton FLIM imaging; phasor and bi-exponential fitting analyses; pheomelanin.


Conflict of interest statement

The authors declare that they have no competing financial interest. A.-M.P., T.B., S.B. and S.D.B. are employees of L’Oréal Research and Innovation. S.I. is consulting for L’Oréal Research and Innovation.

Figures

Figure 1
Figure 1
Chemical degradation—HPLC quantification results showing the effects of 1 and 7 days of UVA exposure at 3.5 mW/cm2 in eumelanins (Eu-DHICA, Eu-DHI, and Eu-Dopa), pheomelanin (Pheo - Dopa-Cys-1-1), and mixed eu-/pheo-melanin (Eu/Pheo - Dopa-Cys-4-1 at a ratio of 75/25) samples. (a) PTCA characterizes native DHICA eumelanin; (b) free PTCA the DHICA eumelanin peroxidation; (c) PTeCA the eumelanin crosslinking; and (d) free/total PTCA ratio the DHICA eumelanin oxidation. The (e) 4-AHP parameter characterizes benzothiazine pheomelanin and (f) TTCA the benzothiazole pheomelanin. (g) TTCA/4-AHP ratio reflects the pheomelanin oxidation, i.e., the conversion of benzothiazine to benzothiazole. All quantities are in µg/mg, except for the ratio parameters. N.A. indicates unavailable data.
Figure 2
Figure 2
Multiphoton FLIM—example of normalized 2PEF intensity decays of native melanins and melanins exposed to 1 and 7 days of 3.5 mW/cm2 UVA. Each decay is an overall decay over one 512 × 512 pixel image, spatially (20 × 20 pixels) and temporally (2 time channels) binned. In (a) the fluorescence signals were normalized compared to native DHICA eumelanin to visualize signal intensity differences between conditions, whereas in (be) each decay was normalized to its maximum intensity to visualize the differences in the shape of the decays. The 2PEF intensity decays are given for (b) native melanins; (c) native and UVA-exposed melanins; (d) native and UVA-exposed eumelanins; and (e) native and UVA-exposed Dopa melanin, pheomelanin and mixed eu-/pheo-melanins. The color legend in (c) is the same as in (b,d,e).
Figure 3
Figure 3
Multiphoton FLIM phasor analysis of native and UVA-exposed eumelanins, pheomelanin, and mixed eu-/pheo-melanins. (left) For each condition, an example of a raw 2PEF intensity (256 × 256 pixels) image is shown on the left, followed by the calculated phasor images (10 × 10 pixels spatial binning) of phase lifetime, modulation lifetime, and fraction of UVA-modified melanin parameters. (right) Phasor plots (scatters of phasor s versus g parameters) of all the images acquired per condition, allowing the visualization of the native melanins’ FLIM fingerprints and their change with UVA exposure. Every fluorescence intensity decay (e.g., Figure 2) of every pixel of an image is represented by a phasor pixel in the phasor plot with s and g coordinates. Pixels with similar 2PEF intensity decays will have close s and g coordinates and thus will be regrouped. Each phasor plot is color coded by a different phasor parameter and is correlated with its corresponding phasor image: every pixel in the phasor plot can be traced back to the pixel with the same property in the image. The density phasor plots highlight the pixel intensities (the fluorescence intensity is adjusted to the minimum and maximum of each image), whereas the τφ, τm, and fUVA Mel phasor plots allow identification of the pixels based on the values of these parameters. In the fUVA Mel phasor plots, the pink circle (see arrows) indicates the average s and g coordinates of native melanins. For every pixel, the fraction of UVA-modified melanins is calculated by measuring its distance to this reference native melanin position. The arcs and lines shown on the rightmost phasor plots indicate the min and max values of the color scales used for each parameter: the blue arc corresponds to the 0.5 fraction value limit, the red arcs to the modulation lifetime from 0 to 5.5 ns, and the red line to the 2 ns phase lifetime value limit.
Figure 4
Figure 4
Multiphoton FLIM phasor analysis quantification results of native and UVA-exposed eumelanins, pheomelanin, and mixed eu-/pheo-melanins. For each type of melanin sample and exposure condition and every image pixel, we quantified the phasor parameters (a) g and (b) s (respectively, the real and complex components of the Fourier transform of the 2PEF intensity decay), (c) the phase τφ, and (d) the modulation τm lifetimes. The diagram in (e) for DHICA eumelanin illustrates the relative fraction of UVA-modified melanins, fUVA Mel, quantified in (f). In the example in (e), the average g and s coordinates of all the pixels of the native DHICA eumelanin solution (the center of the pink cercle) were used as reference coordinates for the fUVA Mel fraction calculation. This relative fraction is calculated as the distance (e.g., green and orange brackets) of every experimental data point to the reference native melanin position. The raw data are expressed as bar plots with data overlap (°); the bar represents the mean, the dotted line the median, and the error bar the ±95% confidence interval of the mean. Statistically significant p-values: ** p ≤ 0.01, *** p ≤ 0.001. The colored brackets indicate the ES—effect size (dark green—very strong [2–Inf], light green—strong [1.5–2], and yellow—moderate [0.8–1.5]). Only p-values associated with moderate to very strong ES are shown. On the right panel of each graph, we only show the comparisons of melanins with no exposure condition.
Figure 5
Figure 5
Multiphoton FLIM bi-exponential fitting analysis of native and UVA-exposed eumelanins, pheomelanin, and mixed eu-/pheo-melanins. For each condition, an example of calculated images (20 × 20 pixels spatial binning) is shown for all the parameters: τ1 short and τ2 long fluorescence lifetimes, their respective relative contributions, a1% and a2%, as well as their combination parameters, the τAv Int intensity- and τAv Amp amplitude-weighted average lifetimes.
Figure 6
Figure 6
Multiphoton FLIM bi-exponential fitting analysis quantification results of native and UVA-exposed eumelanins, pheomelanin, and mixed eu-/pheo-melanins. For each type of melanin sample and exposure condition and every image pixel, we quantified the parameters of (a) τ1 short and (b) τ2 long fluorescence lifetimes and their respective relative contributions (c) a1% and (d) a2%, as well as their combination parameters, the (e) τAvInt intensity- and (f) τAvAmp amplitude-weighted average lifetimes. The raw data are expressed as bar plots with data overlap (°), the bar represents the mean, the dotted line the median, and the error bar the ± 95% confidence interval of the mean. Statistically significant p-values: * p ≤ 0.05; ** p ≤ 0.01, *** p ≤ 0.001. The colored brackets indicate the ES—effect size (dark green—very strong [2–Inf], light green—strong [1.5–2], and yellow—moderate [0.8–1.5]). Only p-values associated with moderate to very strong ES are shown. On the right panel of each graph, we only show the comparisons of melanins with no exposure condition.
Figure 7
Figure 7
(a) Biosynthesis of eumelanin and pheomelanin. Tyrosinase, Tyrp1, and Tyrp2 are involved in eumelanin production, while tyrosinase and cysteine are required for pheomelanin production. Adapted with permission from ref. [68]. Copyright 2007, John Wiley and Sons. (b) Photo-induced structural modifications of eumelanin. Eumelanin consists of DHI and DHICA, but for the sake of simplicity, only DHICA is illustrated. DHICA gives PTCA after AHPO, while photo-induced oxidative degradation of PTCA gives free PTCA and photo-degraded eumelanin (diaryl ketone). The reaction of the DHI moiety with the indolequinone moiety gives crosslinked DHI. This structure gives PTeCA after AHPO. Adapted with permission from ref. [15]. Copyright 2018, John Wiley and Sons. (c) Effects of heat on structural features of eumelanin and their characterization by AHPO or reductive HI hydrolysis. Upon Hl hydrolysis of eumelanin, the DHICA moiety undergoes decarboxylation to form a crosslinked eumelanin via the DHI moiety. H2O2 oxidation of the DHICA moiety in eumelanin gives PTCA in a comparatively high yield while H2O2 oxidation of the DHI moiety gives PTCA and PDCA in low yields. H2O2 oxidation of crosslinked eumelanin gives PTeCA. Adapted with permission from ref. [45]. Copyright 2017, John Wiley and Sons. (d) Photo-induced structural modifications of pheomelanin and effects of light or heat on structural features of pheomelanin and its characterization by AHPO or reductive HI hydrolysis. Upon maturation of pheomelanin by heat or light, the benzothiazine moiety undergoes conversion into the benzothiazole moiety. Upon heating, the carboxylated benzothiazole moiety undergoes decarboxylation to form the decarboxylated benzothiazole moiety. HI hydrolysis of the benzothiazine moiety gives 4-AHP (and 3-AHP, not illustrated). H2O2 oxidation of the carboxylated and decarboxylated benzothiazole moieties gives TTCA and TDCA, respectively. Adapted with permission from ref. [45]. Copyright 2017, John Wiley and Sons.
Figure 8
Figure 8
Principle of FLIM bi-exponential and phasor analyses. (a) Simulated mono-exponential (fluorophores A and B) and bi-exponential (mixed species of fluorophores A and B with, respectively, 90% and 10% relative contribution) two-photon excited fluorescence intensity decays (12.5 ns time range; 80 MHz); this shape of A&B bi-exponential decay can be measured in melanin-containing samples. In FLIM bi-exponential analysis, the 2PEF intensity decay is adjusted with the function in (a) to compute the values of short τ1 and long τ2 fluorescence lifetimes and their relative contributions a1% and a2%. Images of FLIM bi-exponential fit and combination parameters such as amplitude- and intensity-weighted lifetimes are used for data analyses. (b) FLIM phasor analysis transforms a decay into a phasor with polar coordinates g and s, corresponding to the real and complex components of the Fourier transform, which can also be expressed as a function of m modulation and φ phase angle. Mono-exponential decays such as A and B will have their phasors on the semi-circle, whereas mixed species will have a phasor along a line connecting the two distinct lifetime phasors of A and B. The relative fractions fA and fB can be computed from the distances of A&B mixed species phasor to B and A phasors, respectively. Images of g and s as well as combination parameters such as the apparent phase and modulation lifetimes and their relative fractions are used for data analyses. Adapted from ref. [26].

Similar articles

Cited by

References

    1. Rosen C.F., Jacques S.L., Stuart M.E., Gange R.W. Immediate pigment darkening: Visual and reflectance spectrophotometric analysis of action spectrum. Photochem. Photobiol. 1990;51:583–588. doi: 10.1111/j.1751-1097.1990.tb01969.x. - DOI - PubMed
    1. Sklar L.R., Almutawa F., Lim H.W., Hamzavi I. Effects of ultraviolet radiation, visible light, and infrared radiation on erythema and pigmentation: A review. Photochem. Photobiol. Sci. 2013;12:54–64. doi: 10.1039/c2pp25152c. - DOI - PubMed
    1. Moyal D., Chardon A., Kollias N. Determination of UVA protection factors using the persistent pigment darkening (PPD) as the end point. (Part 1). Calibration of the method. Photodermatol. Photoimmunol. Photomed. 2000;16:245–249. doi: 10.1034/j.1600-0781.2000.160602.x. - DOI - PubMed
    1. Moyal D., Chardon A., Kollias N. UVA protection efficacy of sunscreens can be determined by the persistent pigment darkening (PPD) method. (Part 2) Photodermatol. Photoimmunol. Photomed. 2000;16:250–255. doi: 10.1034/j.1600-0781.2000.160603.x. - DOI - PubMed
    1. Kaidbey K.H., Kligman A.M. The acute effects of long-wave ultraviolet radiation on human skin. J. Investig. Dermatol. 1979;72:253–256. doi: 10.1111/1523-1747.ep12531710. - DOI - PubMed