. 2023 Feb 25;24(5):4543.
doi: 10.3390/ijms24054543.

Protein Abundance of Drug Metabolizing Enzymes in Human Hepatitis C Livers

Affiliations

Protein Abundance of Drug Metabolizing Enzymes in Human Hepatitis C Livers

Marek Drozdzik et al. Int J Mol Sci. .

Abstract

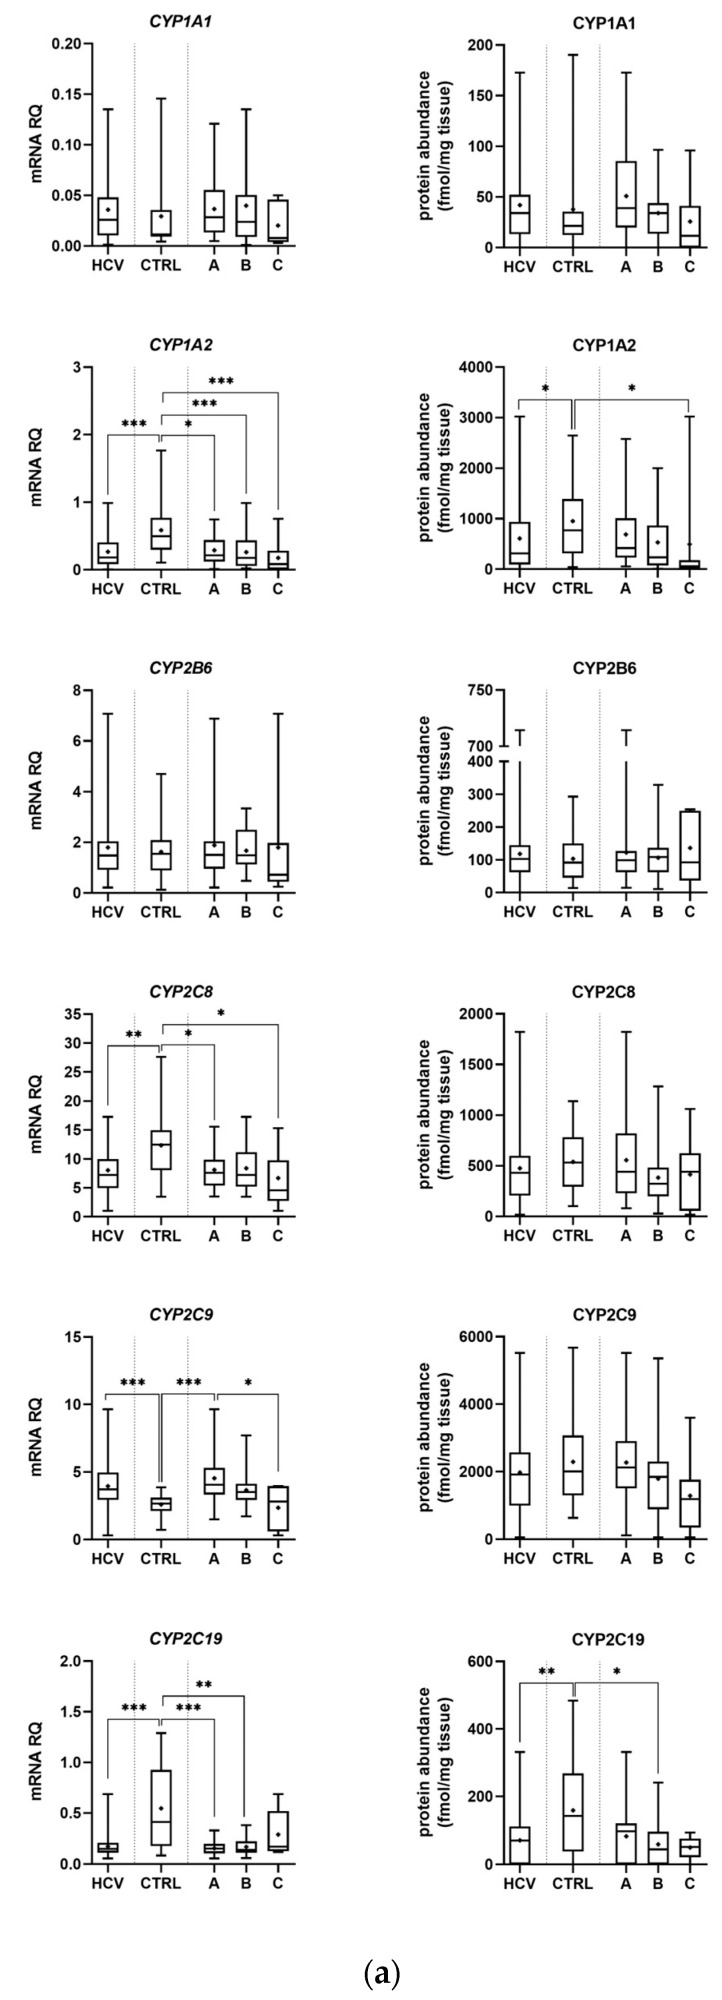
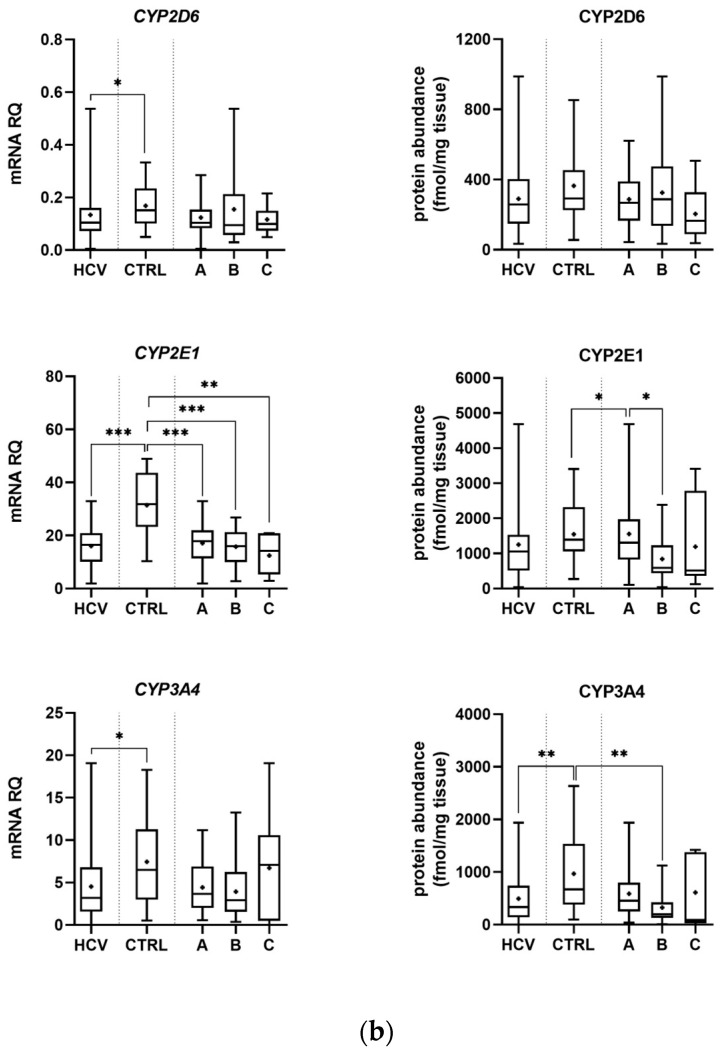
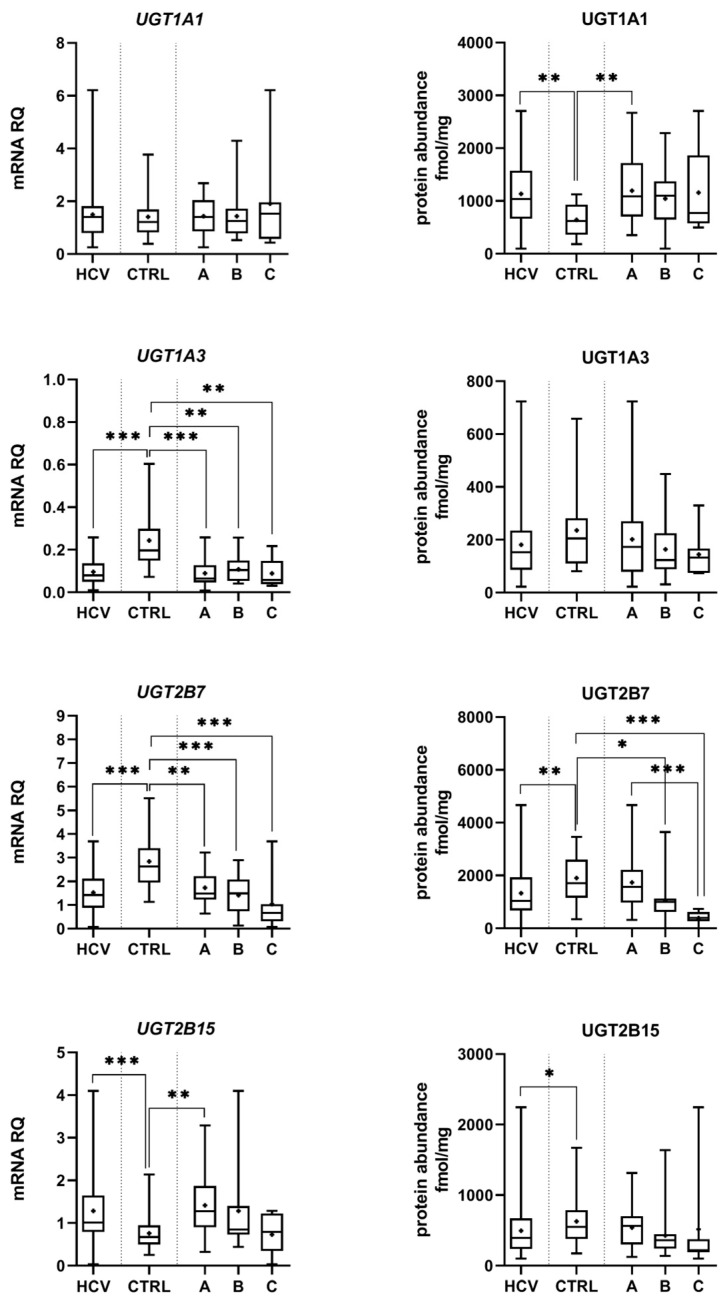
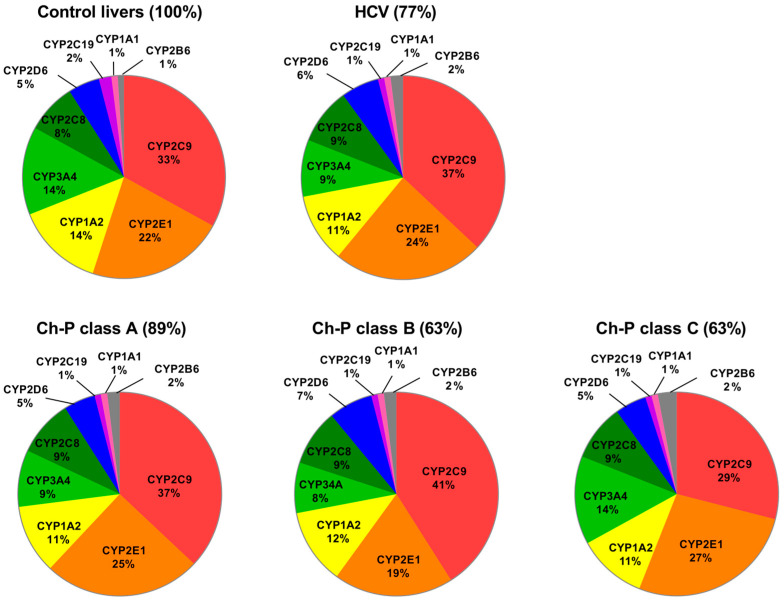
Hepatic drug metabolizing enzymes (DMEs), whose activity may be affected by liver diseases, are major determinants of drug pharmacokinetics. Hepatitis C liver samples in different functional states, i.e., the Child-Pugh class A (n = 30), B (n = 21) and C (n = 7) were analyzed for protein abundances (LC-MS/MS) and mRNA levels (qRT-PCR) of 9 CYPs and 4 UGTs enzymes. The protein levels of CYP1A1, CYP2B6, CYP2C8, CYP2C9, and CYP2D6 were not affected by the disease. In the Child-Pugh class A livers, a significant up-regulation of UGT1A1 (to 163% of the controls) was observed. The Child-Pugh class B was associated with down-regulation of the protein abundance of CYP2C19 (to 38% of the controls), CYP2E1 (to 54%), CYP3A4 (to 33%), UGT1A3 (to 69%), and UGT2B7 (to 56%). In the Child-Pugh class C livers, CYP1A2 was found to be reduced (to 52%). A significant trend in down-regulation of the protein abundance was documented for CYP1A2, CYP2C9, CYP3A4, CYP2E1, UGT2B7, and UGT2B15. The results of the study demonstrate that DMEs protein abundances in the liver are affected by hepatitis C virus infection and depend on the severity of the disease.

Keywords: drug metabolizing enzymes; hepatitis C; liver.


Conflict of interest statement

The authors declare no conflict of interest.

Figures

Figure 1
Figure 1
Gene expression (left) and protein abundance (right) of CYPs in hepatitis C (HCV, n = 58) liver tissues stratified according to the Child–Pugh score into stages: A (n = 30), B (n = 21), and C (n = 7), and the controls (CTRL, n = 20). The data are represented as box-plots of the median (horizontal line), 75th (top of box) and 25th (bottom of box) quartiles, the smallest and largest values (whiskers) and mean (+). mRNA levels of the analyzed genes are expressed as relative amounts to the mean of five housekeeping genes (GAPDH, HMBS, PPIA, RPLP0, RPS9). Statistically significant differences: * p < 0.05, ** p < 0.01, *** p < 0.001 (Wilcoxon-signed rank test in comparison to the controls). (a) Results for CYP1A1, 1A2, 2B6, 2C8, 2C9 and 2C19. (b) Results for CYP2D6, 2E1 and 3A4.
Figure 1
Figure 1
Gene expression (left) and protein abundance (right) of CYPs in hepatitis C (HCV, n = 58) liver tissues stratified according to the Child–Pugh score into stages: A (n = 30), B (n = 21), and C (n = 7), and the controls (CTRL, n = 20). The data are represented as box-plots of the median (horizontal line), 75th (top of box) and 25th (bottom of box) quartiles, the smallest and largest values (whiskers) and mean (+). mRNA levels of the analyzed genes are expressed as relative amounts to the mean of five housekeeping genes (GAPDH, HMBS, PPIA, RPLP0, RPS9). Statistically significant differences: * p < 0.05, ** p < 0.01, *** p < 0.001 (Wilcoxon-signed rank test in comparison to the controls). (a) Results for CYP1A1, 1A2, 2B6, 2C8, 2C9 and 2C19. (b) Results for CYP2D6, 2E1 and 3A4.
Figure 2
Figure 2
Gene expression (left) and protein abundance (right) of UGTs in hepatitis C (HCV, n = 58) liver tissues stratified according to the Child–Pugh score into stages: A (n = 30), B (n = 21), and C (n = 7), and the controls (CTRL, n = 20). The data are represented as box-plots of the median (horizontal line), 75th (top of box) and 25th (bottom of box) quartiles, the smallest and largest values (whiskers) and mean (+). mRNA levels of the analyzed genes are expressed as relative amounts to the mean of five housekeeping genes (GAPDH, HMBS, PPIA, RPLP0, RPS9). Statistically significant differences: * p < 0.05, ** p < 0.01, *** p < 0.001 (Wilcoxon-signed rank test in comparison to the controls).
Figure 3
Figure 3
Pie charts of the individual enzyme protein amounts in HCV livers stratified according to the Child–Pugh score (A, B, and C class). The pie charts show the abundance of each enzyme as a percentage of the sum of all enzyme protein abundances. Percentages indicate a total enzyme protein abundance in comparison to the control livers (indicated as 100%).

References

    1. Esposito I., Trinks J., Soriano V. Hepatitis C virus resistance to the new direct-acting antivirals. Expert Opin. Drug. Metab. Toxicol. 2016;12:1197–1209. doi: 10.1080/17425255.2016.1209484. - DOI - PubMed
    1. Drozdzik M., Busch D., Lapczuk J., Müller J., Ostrowski M., Kurzawski M., Oswald S. Protein Abundance of Clinically Relevant Drug-Metabolizing Enzymes in the Human Liver and Intestine: A Comparative Analysis in Paired Tissue Specimens. Clin. Pharmacol. Ther. 2018;104:515–524. doi: 10.1002/cpt.967. - DOI - PubMed
    1. Smolders E.J., de Kanter C., van Hoek B., Arends J., Drenth J., Burger D.M. Pharmacokinetics, Efficacy, and Safety of Hepatitis C Virus Drugs in Patients with Liver and/or Renal Impairment. Drug Saf. 2016;39:589–611. doi: 10.1007/s40264-016-0420-2. - DOI - PMC - PubMed
    1. Smolders E.J., Jansen A., Ter Horst P., Rockstroh J., Back D.J., Burger D.M. Viral Hepatitis C Therapy: Pharmacokinetic and Pharmacodynamic Considerations: A 2019 Update. Clin. Pharmacokinet. 2019;58:1237–1263. doi: 10.1007/s40262-019-00774-0. - DOI - PMC - PubMed
    1. European Medicines Agency 2005 Guideline on the Evaluation of the Pharmacokinetics of Medicinal Products in Patients with Impaired Hepatic Function. February 2005 [Online] [(accessed on 4 December 2022)]. Available online: https://www.ema.europa.eu/documents/scientific-guideline/guideline-evalu....

MeSH terms