. 2023 Feb 26;24(5):4579.
doi: 10.3390/ijms24054579.

Organizational Principles of the Centrifugal Projections to the Olfactory Bulb

Affiliations

Organizational Principles of the Centrifugal Projections to the Olfactory Bulb

Li Wang et al. Int J Mol Sci. .

Abstract

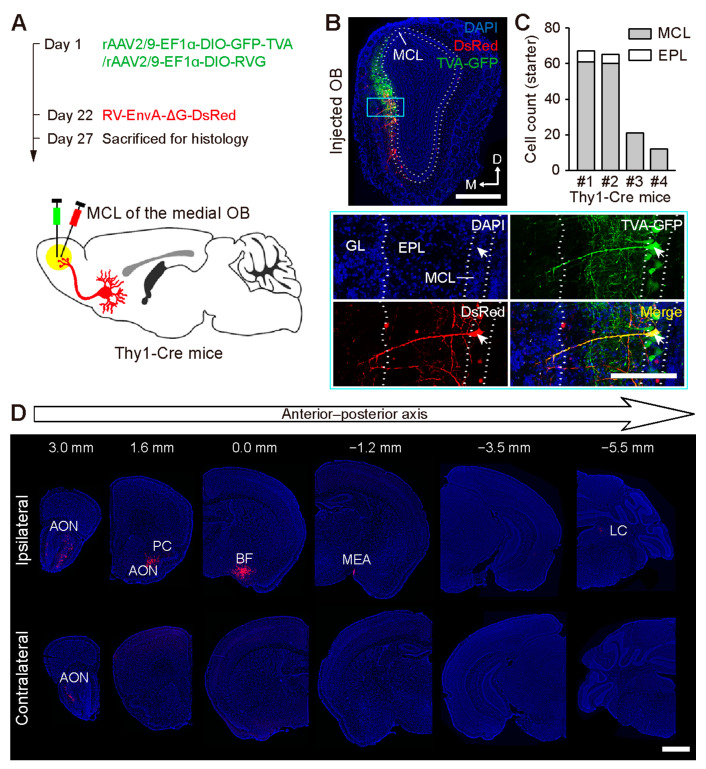
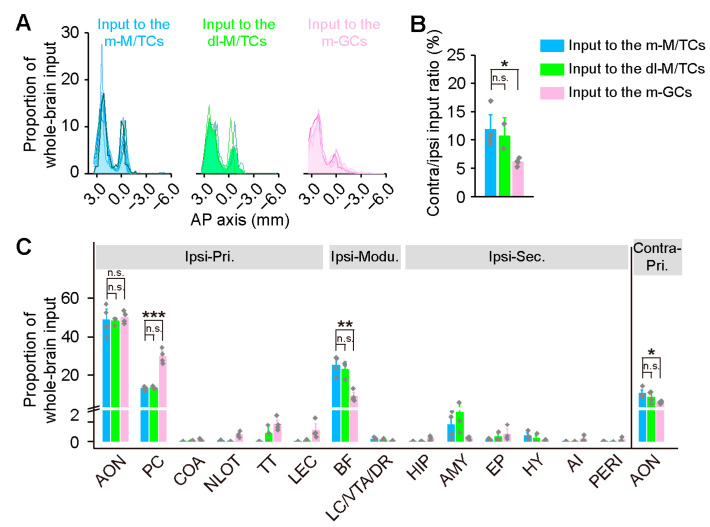
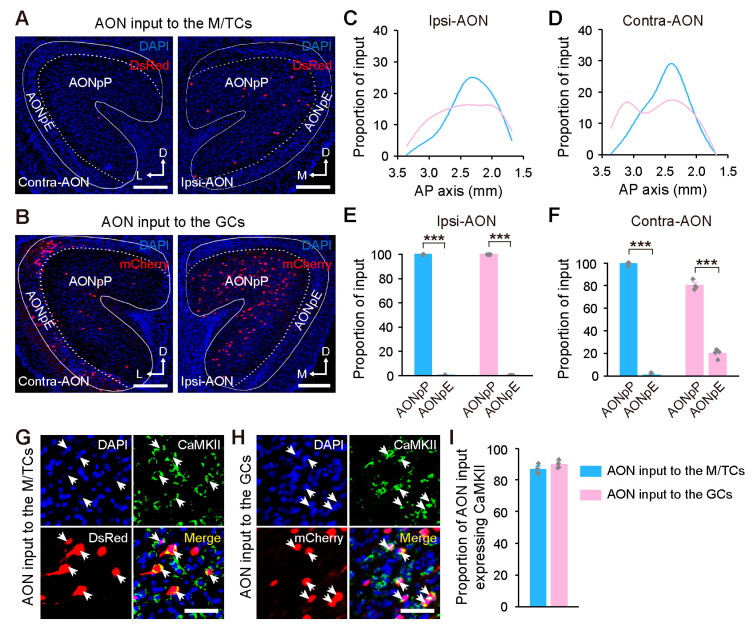
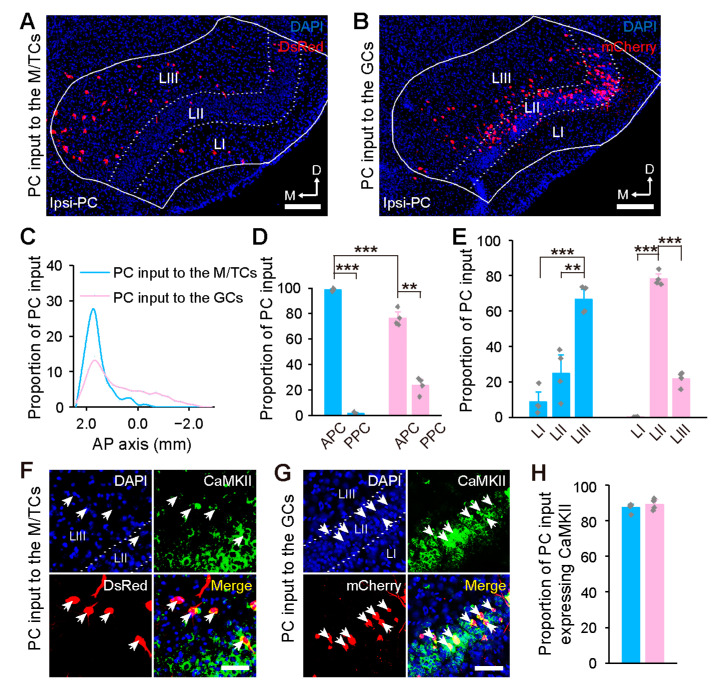
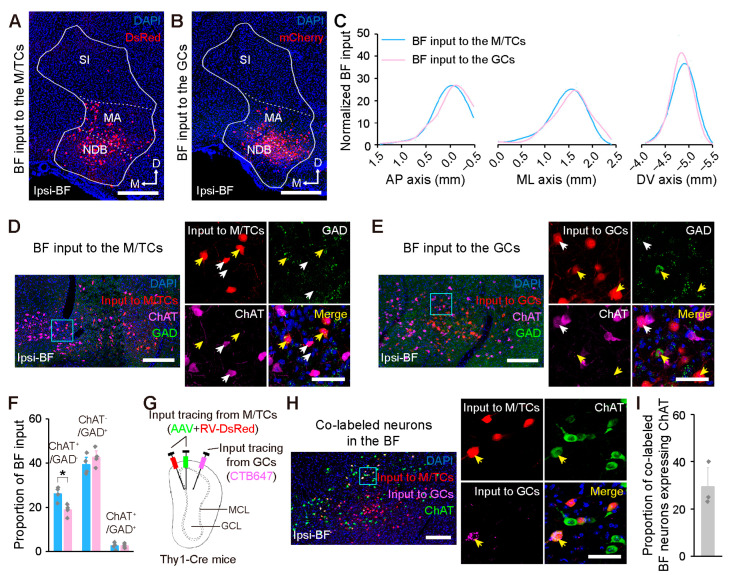
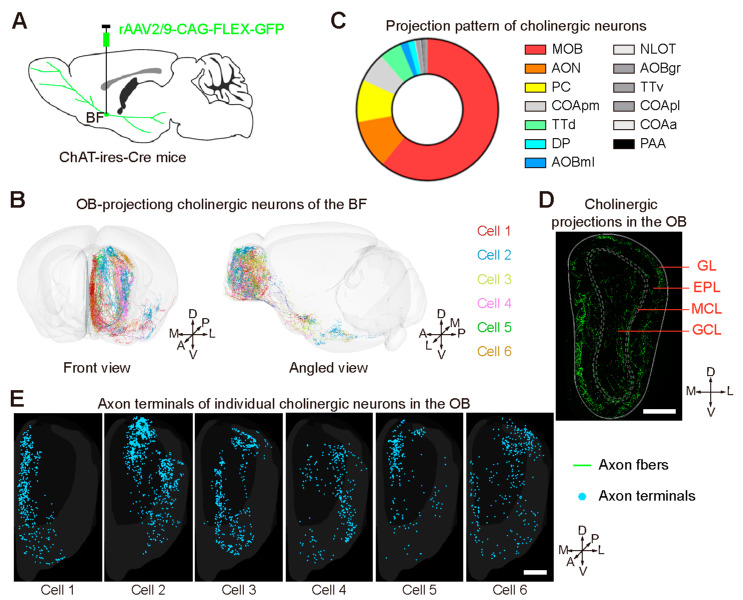
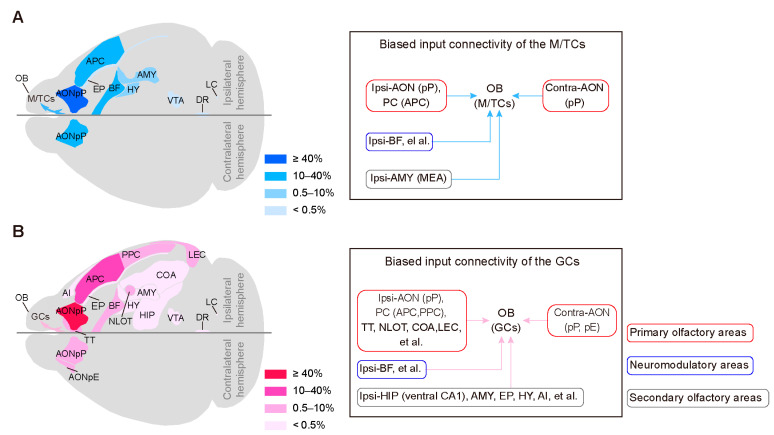
Centrifugal projections in the olfactory system are critical to both olfactory processing and behavior. The olfactory bulb (OB), the first relay station in odor processing, receives a substantial number of centrifugal inputs from the central brain regions. However, the anatomical organization of these centrifugal connections has not been fully elucidated, especially for the excitatory projection neurons of the OB, the mitral/tufted cells (M/TCs). Using rabies virus-mediated retrograde monosynaptic tracing in Thy1-Cre mice, we identified that the three most prominent inputs of the M/TCs came from the anterior olfactory nucleus (AON), the piriform cortex (PC), and the basal forebrain (BF), similar to the granule cells (GCs), the most abundant population of inhibitory interneurons in the OB. However, M/TCs received proportionally less input from the primary olfactory cortical areas, including the AON and PC, but more input from the BF and contralateral brain regions than GCs. Unlike organizationally distinct inputs from the primary olfactory cortical areas to these two types of OB neurons, inputs from the BF were organized similarly. Furthermore, individual BF cholinergic neurons innervated multiple layers of the OB, forming synapses on both M/TCs and GCs. Taken together, our results indicate that the centrifugal projections to different types of OB neurons may provide complementary and coordinated strategies in olfactory processing and behavior.

Keywords: centrifugal projections; granule cells; mitral/tufted cells; olfactory bulb; virus-mediated tracing.


Conflict of interest statement

The authors declare no conflict of interest.

Figures

Figure 1
Figure 1
Retrograde tracing of the monosynaptic input to the M/TCs of the medial OB. (A) Strategy for tracing the input from the M/TCs using RV-based retrograde monosynaptic tracing viruses. (B) Upper: Representative image showing starter neurons in the MCL of the medial OB. Lower: Magnification of the blue outlined area in the upper image. The arrowhead indicates a starter neuron in the MCL co-expressing TVA-GFP and RV-DsRed. MCL, mitral cell layer; EPL, external plexiform layer; GL, glomerular layer. (C) Cell count of starter neurons in each mouse. (D) Examples of images showing fluorescently labeled input neurons in the major brain areas. AON, anterior olfactory nucleus; PC, piriform cortex; BF, basal forebrain; MEA, medial amygdalar nucleus; LC, locus coeruleus. Scale bars, 500 µm in (B) (upper); 200 µm in (B) (lower); 1 mm in (D).
Figure 2
Figure 2
Brain-wide input distribution of the OB. (A) Quantified distribution of the input neurons targeting the M/TCs and GCs along the anterior–posterior (AP) axis. Colored lines denote individual animals. (B) Relative ratio of the contralateral input to the ipsilateral input. (C) Proportion of input neurons in discrete brain regions. Regions that contributed more than 0.1% of the total input are summarized here. Pri., primary olfactory areas; modu., neuromodulatory areas; sec., secondary olfactory areas; AON, anterior olfactory nucleus; PC, piriform cortex; COA, cortical amygdalar nucleus; NLOT, lateral olfactory tract nucleus; TT, taenia tecta; LEC, lateral entorhinal cortex; BF, basal forebrain; LC, locus coeruleus; VTA, ventral tegmental area; DR, dorsal raphe nucleus; HIP, hippocampal region; AMY, amygdalar area; EP, endopiriform nucleus; HY, hypothalamus; AI, agranular insular cortex; PERI, perirhinal cortex. Data are shown as the mean ± s.e.m.; gray rhombuses denote individual animals in (B,C). Dorsolateral M/TC: n = 3 animals; medial M/TC and medial GC: n = 4 animals per group. Unpaired two-tailed t-tests were used for (B,C). * p < 0.05, ** p < 0.01, *** p < 0.001, n.s. no significant difference.
Figure 3
Figure 3
Organization of the centrifugal input from the AON to the OB. (A,B) Input neurons in the ipsilateral (left) and contralateral AONs (right) following retrograde tracing from the M/TCs (A) and GCs (B). (C,D) Cumulative distribution of the input neurons in the ipsilateral (C) and contralateral AONs (D) along the AP axis. (E,F) Subarea distribution of the input neurons in the ipsilateral (E) and contralateral AONs (F). Paired two-tailed t-tests, *** p < 0.001. (G,H) Identification of CaMKII-expressing input neurons in the ipsilateral AON (indicated by arrowheads) following retrograde tracing from the M/TCs (G) and GCs (H). (I) Proportion of CaMKII-expressing input neurons in the bilateral AONs. Data are shown as the mean ± s.e.m.; gray rhombuses denote individual animals in (E,F,I). Scale bars, 200 µm in (A,B); 50 µm in (G,H).
Figure 4
Figure 4
Organization of the centrifugal input from the PC to the OB. (A,B) Input neurons in the ipsilateral PC following retrograde tracing from the M/TCs (A) and GCs (B). (C) Cumulative distribution of the input neurons in the PC along the AP axis. (D) Subarea distribution of the input neurons in the PC. (E) Laminar distribution of the input neurons in the PC. (F,G) Identification of CaMKII-expressing input neurons in the PC (indicated by arrowheads) following retrograde tracing from the M/TCs (F) and GCs (G). (H) Proportion of CaMKII-expressing input neurons in the PC. Data are shown as the mean ± s.e.m.; gray rhombuses denote individual animals in (D,E,H). Scale bars, 200 µm in (A,B); 50 µm in (F,G). Two-tailed t-tests were used for (D); one-way ANOVA with post-hoc Tukey’s test was used for (E); ** p < 0.01, *** p < 0.001.
Figure 5
Figure 5
Organization of the centrifugal input from the BF to the OB. (A,B) Input neurons in the ipsilateral BF following retrograde tracing from the M/TCs (A) and GCs (B). NDB, diagonal band nucleus; MA, magnocellular preoptic nucleus; SI, substantia innominata. (C) Cumulative distribution of the input neurons in the BF along the AP, ML, and DV axes. (D,E) Left: Representative image showing ChAT-expressing and/or GAD65/67-expressing input neurons in the BF following retrograde tracing from the M/TCs (D) and GCs (E). Right: Magnification of the blue outlined area in the left-hand image. The white and yellow arrowheads indicate ChAT-expressing and GAD65/67-expressing input neurons, respectively. ChAT, choline acetyltransferase; GAD, glutamate decarboxylase. (F) Proportion of the BF input neurons expressing ChAT+/GAD, ChAT/GAD+, and ChAT+/GAD+. Unpaired two-tailed t-tests. * p < 0.05. n = 4 animals. (G) Strategy for dual-retrograde tracing from the M/TCs and GCs using two different colored retrograde tracers, namely the RV-based retrograde monosynaptic tracing viruses and the CTB647. (H) Left: Representative image of co-labeled neurons expressing ChAT in the BF. Right: Magnification of the blue outlined area in the left-hand image. The arrowhead indicates a ChAT-expressing co-labeled neuron. (I) Proportion of ChAT-expressing co-labeled neurons in the BF. n = 3 animals. Data are shown as the mean ± s.e.m.; gray rhombuses denote individual animals in (F,I). Scale bars, 500 µm in (A,B); 200 µm in (D) (left), (E) (left), and (H) (left); and 50 µm in (D) (right), (E) (right), and (H) (right).
Figure 6
Figure 6
Axonal projections of the cholinergic neurons of the BF. (A) Strategy for labeling the cholinergic neurons of the BF using rAAV2/9-CAG-FLEX-GFP. (B) Six OB-projecting cholinergic neurons were reconstructed from the whole-brain database and are shown in different colors. (C) Distribution of the axon terminals of the cholinergic neurons in the primary olfactory areas. MOB, main olfactory bulb; COApm, posteromedial part of the cortical amygdalar nucleus; TTd, dorsal part of the taenia tecta; DP, dorsal peduncular cortex; AOBml, mitral cell layer of the accessory olfactory bulb; NLOT, nucleus of the lateral olfactory tract; AOBgr, granular cell layer of the accessory olfactory bulb; TTv, ventral part of the taenia tecta; COApl, posterolateral part of the cortical amygdalar nucleus; COAa, anterior part of the cortical amygdalar nucleus; PAA, amygdalopiriform transition area. (D) Representative image of fluorescently labeled cholinergic axon fibers in the OB. GL, glomerular layer; EPL, external plexiform layer; MCL, mitral cell layer; GCL, granular cell layer. (E) Axon terminals of individual cholinergic neurons in the OB. Scale bars, 500 µm in (D,E).
Figure 7
Figure 7
Summary of the major centrifugal input regions of the OB. (A,B) Schematic representation (left) and subnetwork organization (right) of the centrifugal input targeting M/TCs (A) and GCs (B). The color transparency represents the percentage of input to the MTCs (blue) and GCs (red). AON, anterior olfactory nucleus; AONpP, anterior olfactory nucleus pars principalis; AONpE, anterior olfactory nucleus pars externa; PC, piriform cortex; APC, anterior piriform cortex; PPC, posterior piriform cortex; TT, taenia tecta, NLOT, nucleus of the lateral olfactory tract; COA, cortical amygdalar nucleus; LEC, lateral entorhinal cortex, BF, basal forebrain; HIP, hippocampal region; AMY, amygdalar area, MEA, medial amygdalar nucleus; EP, endopiriform nucleus; HY, hypothalamus; AI, agranular insular cortex.

Similar articles

Cited by

References

    1. Quintela M.R., Bauer J., Wallhorn L., Le K., Brunert D., Rothermel M. Dynamic impairment of olfactory behavior and signaling mediated by an olfactory corticofugal system. J. Neurosci. 2020;40:7269–7285. doi: 10.1523/JNEUROSCI.2667-19.2020. - DOI - PMC - PubMed
    1. Ogg M.C., Ross J.M., Bendahmane M., Fletcher M.L. Olfactory bulb acetylcholine release dishabituates odor responses and reinstates odor investigation. Nat. Commun. 2018;9:1868. doi: 10.1038/s41467-018-04371-w. - DOI - PMC - PubMed
    1. Gilbert C.D., Li W. Top-down influences on visual processing. Nat. Rev. Neurosci. 2013;14:350–363. doi: 10.1038/nrn3476. - DOI - PMC - PubMed
    1. Petreanu L., Gutnisky D.A., Huber D., Xu N.L., O’Connor D.H., Tian L., Looger L., Svoboda K. Activity in motor-sensory projections reveals distributed coding in somatosensation. Nature. 2012;489:299–303. doi: 10.1038/nature11321. - DOI - PMC - PubMed
    1. Gilbert C.D., Sigman M. Brain states: Top-down influences in sensory processing. Neuron. 2007;54:677–696. doi: 10.1016/j.neuron.2007.05.019. - DOI - PubMed

LinkOut - more resources