. 2023 Feb 28;24(5):4675.
doi: 10.3390/ijms24054675.

Exploiting Vitamin D Receptor and Its Ligands to Target Squamous Cell Carcinomas of the Head and Neck

Affiliations

Exploiting Vitamin D Receptor and Its Ligands to Target Squamous Cell Carcinomas of the Head and Neck

Laura Koll et al. Int J Mol Sci. .

Abstract

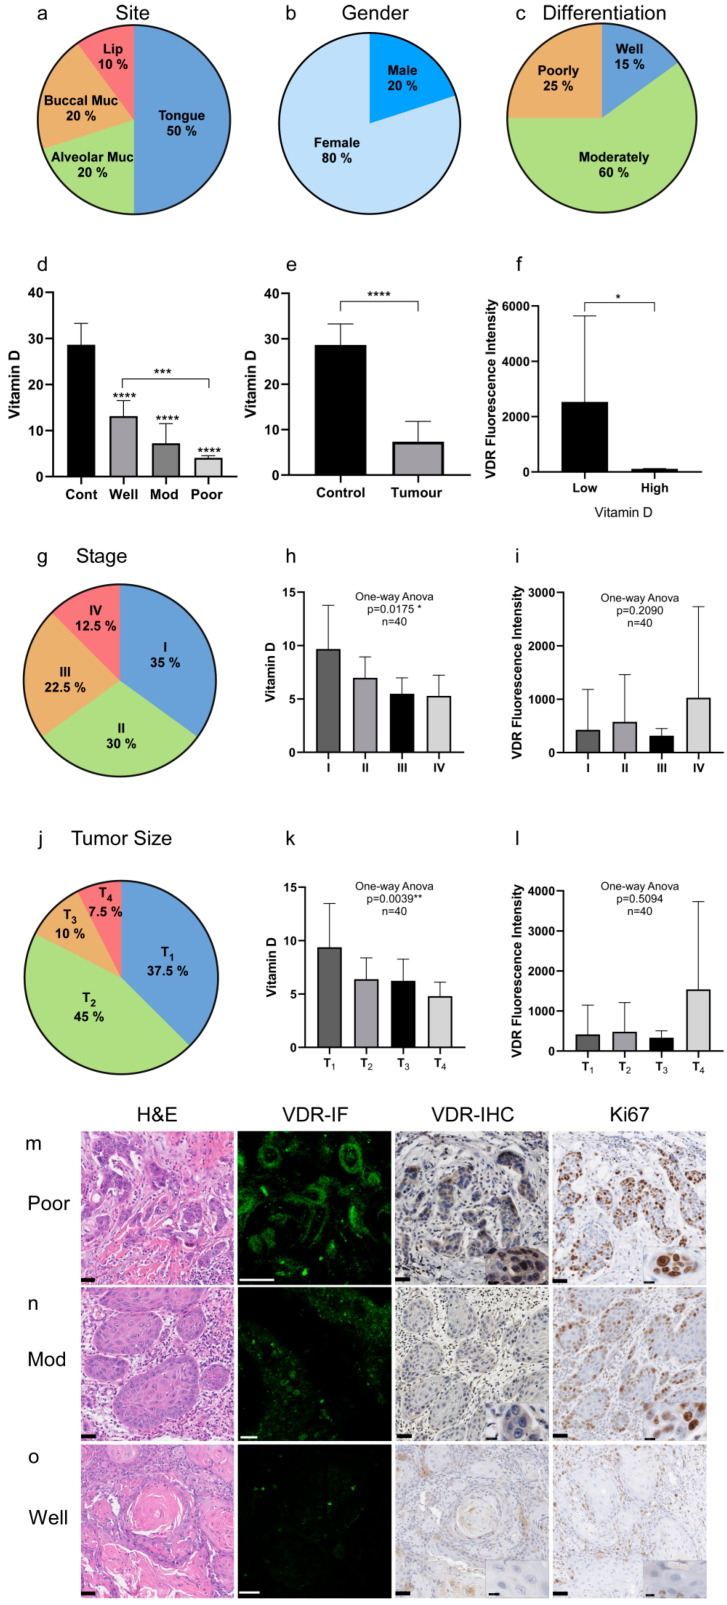
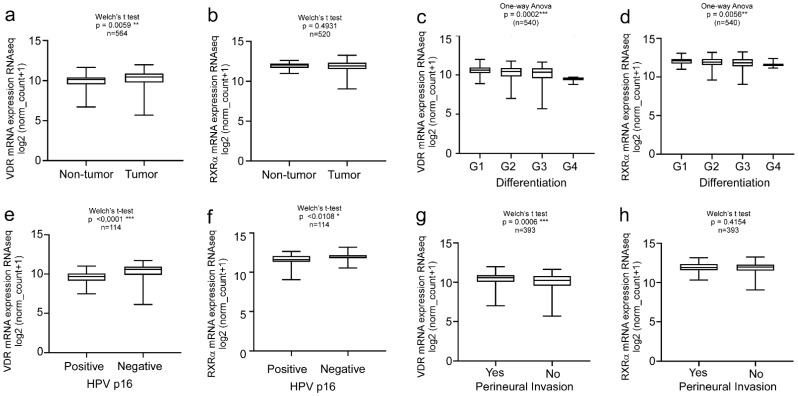
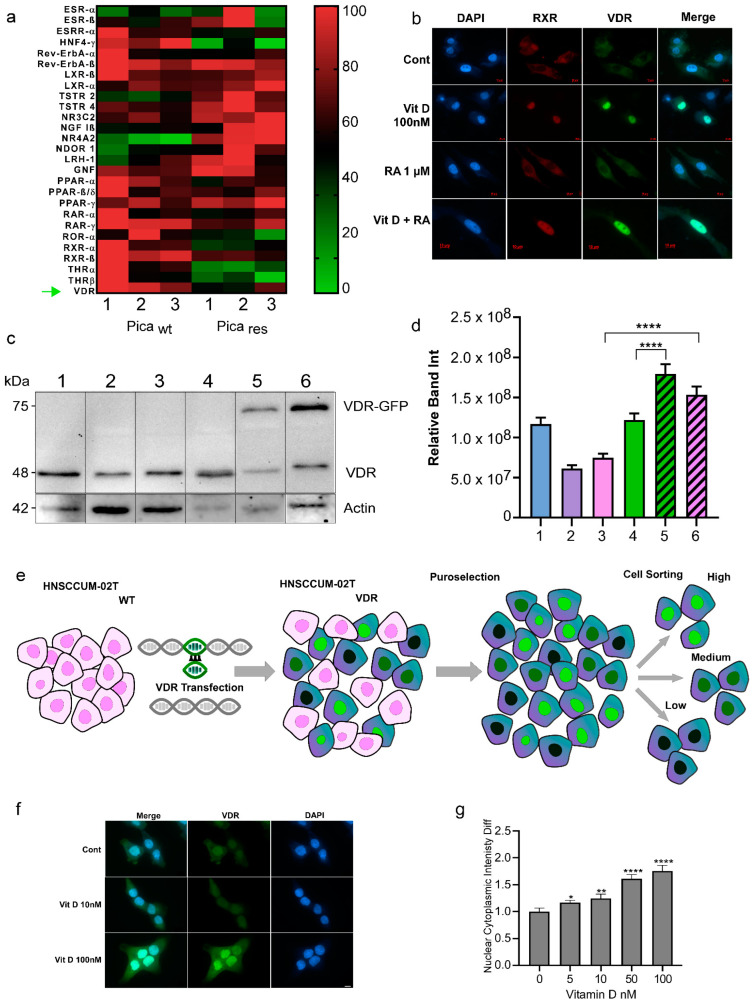
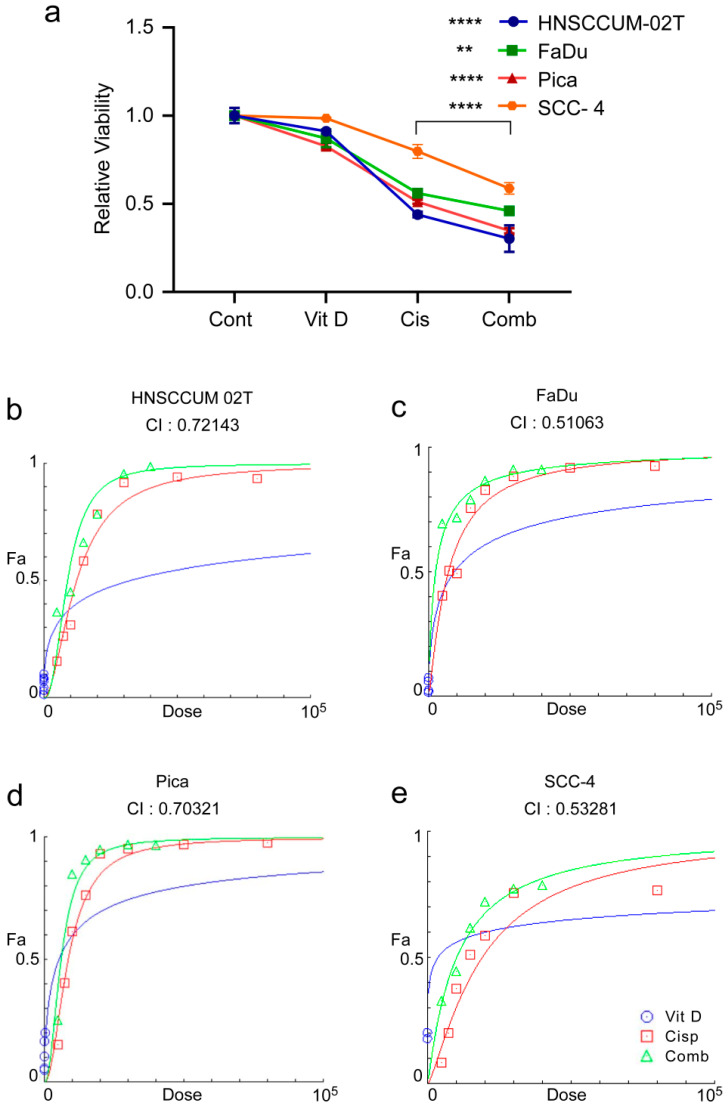
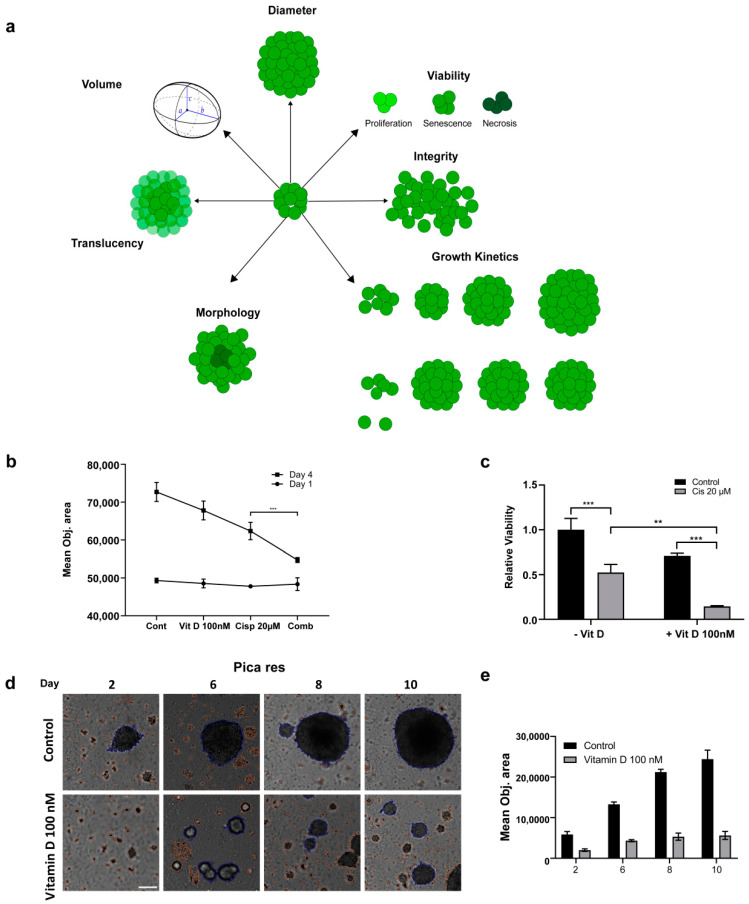
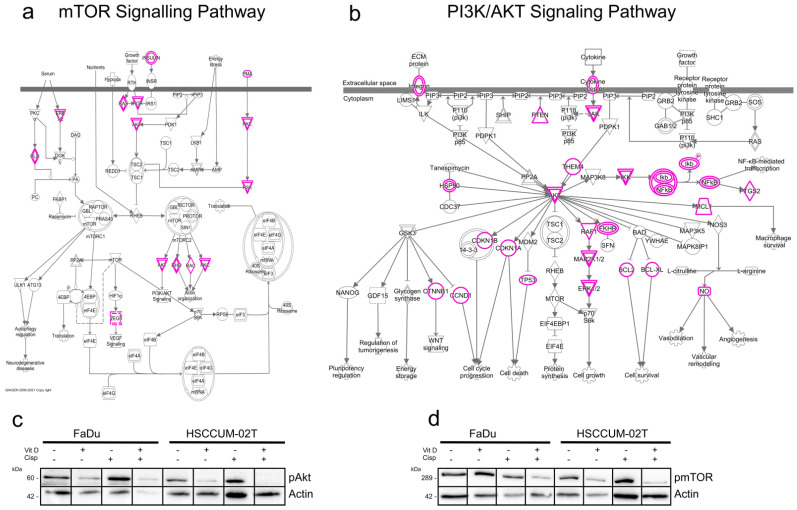
Vitamin D (VitD) and its receptor (VDR) have been intensively investigated in many cancers. As knowledge for head and neck cancer (HNC) is limited, we investigated the (pre)clinical and therapeutic relevance of the VDR/VitD-axis. We found that VDR was differentially expressed in HNC tumors, correlating to the patients' clinical parameters. Poorly differentiated tumors showed high VDR and Ki67 expression, whereas the VDR and Ki67 levels decreased from moderate to well-differentiated tumors. The VitD serum levels were lowest in patients with poorly differentiated cancers (4.1 ± 0.5 ng/mL), increasing from moderate (7.3 ± 4.3 ng/mL) to well-differentiated (13.2 ± 3.4 ng/mL) tumors. Notably, females showed higher VitD insufficiency compared to males, correlating with poor differentiation of the tumor. To mechanistically uncover VDR/VitD's pathophysiological relevance, we demonstrated that VitD induced VDR nuclear-translocation (VitD < 100 nM) in HNC cells. RNA sequencing and heat map analysis showed that various nuclear receptors were differentially expressed in cisplatin-resistant versus sensitive HNC cells including VDR and the VDR interaction partner retinoic acid receptor (RXR). However, RXR expression was not significantly correlated with the clinical parameters, and cotreatment with its ligand, retinoic acid, did not enhance the killing by cisplatin. Moreover, the Chou-Talalay algorithm uncovered that VitD/cisplatin combinations synergistically killed tumor cells (VitD < 100 nM) and also inhibited the PI3K/Akt/mTOR pathway. Importantly, these findings were confirmed in 3D-tumor-spheroid models mimicking the patients' tumor microarchitecture. Here, VitD already affected the 3D-tumor-spheroid formation, which was not seen in the 2D-cultures. We conclude that novel VDR/VitD-targeted drug combinations and nuclear receptors should also be intensely explored for HNC. Gender-specific VDR/VitD-effects may be correlated to socioeconomic differences and need to be considered during VitD (supplementation)-therapies.

Keywords: 3D tumor spheroids; calcitriol; gender-specific effects; nuclear receptors.


Conflict of interest statement

The authors declare that the research was conducted in the absence of any commercial or financial relationships that could be construed as potential conflicts of interest.

Figures

Figure 1
Figure 1
VDR expression and VitD levels correlate with the HNC patients’ clinical parameters. (ac) Clinical characteristics of the HNC patient cohort (n = 40): (a) tumor site, (b) gender, (c) tumor differentiation. (a) The most common tumor type in this cohort occurred in the tongue followed by alveolar and buccal mucosa, and the lips. (b) The male–female ratio was 1:4. (c) Most of the analyzed tumors were classified as moderately differentiated. (df) Quantification of the VitD serum levels and corresponding VDR expression. (d,e) VitD (25-hydroxyVitD3) serum levels were determined in all individuals of the cohort, revealing significantly lower VitD levels in the tumor patients compared to the healthy controls. Here, patients with poorly differentiated tumors showed the lowest VitD levels. (f) VDR expression was inversely correlated with the VitD serum levels. (gi) Staging of the HNSCC cases according to UICC (8th edition). (g) The most common stage was S-I with 35%, followed by S-II (30%), and S-III and S-IV with 22.5% and 12.5%, respectively. (h,i) Quantification and correlation of the VitD serum levels (h) and corresponding VDR expression (i). (jl) Tumor size classification of HNSCC cases according to UICC (8th edition). (j) The most common subtype was T1 followed by T2 with 45% and 37.5%, respectively. Only a few cases were classified as T3 (10%) and T4 (7.5%). (k,l) Quantification and correlation of the VitD serum levels (k) and corresponding VDR expression (l). (mo) High VDR expression occurred in poorly differentiated, highly proliferative tumor tissues. Expression of VDR and Ki67 was determined by immunofluorescence (IF) and immunohistochemical (IHC) staining of the tumor biopsies classified as poorly (m), moderately (n), and well-differentiated (o). IF staining of VDR (green) was visualized by confocal laser scanning microscopy, and the intensity of fluorescence (mean area percent, MA%) was measured using ImageJ (shown in (f)). Cells at higher magnification are included in the IHC image overviews. Representative examples are shown. Tissues were stained with H&E and specific Abs as indicated. Scale bars, 50 µm/12.5 µm (magnifications). Statistical significance is represented in figures as follows: * p < 0.05, ** p < 0.01, *** p < 0.001, and **** p < 0.0001. A p value that was less than 0.05 was considered statistically significant.
Figure 2
Figure 2
Clinical relevance of VDR vs. RXRα levels in HNC patients. Bioinformatics analysis of the TCGA HNC cohort (n = 604). Overexpression of VDR, but not RXRα was found in the primary tumors versus normal tissue (a,b) and correlates with (c) but to a lesser extent in RXRα. VDR expression correlates with tumor differentiation (c), negative HPV status (e), and perineural invasion (g). For all of the studies’ clinical parameters, RXRα showed less or no significant correlations compared to VDR (d,f,h). Significance p values and sample size (n) are indicated. Statistical significance is represented in figures as follows: * p < 0.05, ** p < 0.01 and *** p < 0.001. A p value that was less than 0.05 was considered statistically significant.
Figure 3
Figure 3
Nuclear receptor profiling in the HNC cell models. (a) RNA-Seq transcriptomics and heat map analysis illustrated that the expression of nuclear receptors is altered in therapy-resistant (res) versus sensitive (WT) Pica cells. A set of nuclear receptors were analyzed: Estrogen receptor-ß (ESR-ß), estrogen-related receptor-a (ESRR-α), hepatocyte nuclear factor-4-α (HNF4-α), rev-ErbAα, rev-ErbAß, liver X receptor-ß (LXR-ß), liver X receptor-α (LXR-α), testicular receptor 2 (TSTR 2), testicular receptor 4 (TSTR 4), mineralocorticoid receptor (NR3C2), nerve growth factor Iß (NGF Iß), Nuclear Receptor Subfamily 4 Group A Member 2 (NR4A2), neuron-derived orphan receptor 1 (NDOR 1), liver receptor homolog-1 (LRH-1), germ cell nuclear factor (GNF), peroxisome proliferator-activated receptor-α (PPAR-α), peroxisome proliferator-activated receptor-ß/δ (PPAR-ß/δ), retinoic acid receptor-α (RAR-α), retinoic acid receptor-γ (RAR-γ), RAR-related orphan receptor-α (ROR-α), retinoid X receptor-α (RXR-α), retinoid X receptor-ß (RXR-ß), thyroid hormone receptor-α (THR-α), and VitD receptor (VDR) ‘’green arrow’’. Heat map visualizes the expression levels of differentially expressed genes in WT vs. resistant cells (green: downregulated, red: upregulated). (b) Fluorescence microscopy to visualize VDR or RXR expression and activation/translocation in HNC cells. Cells were treated with 100 nM VitD, 1 µM retinoic acid (RA), or a combination of both (VitD + RA), for 30 min and fixed. Cells were stained with specific fluorescent VDR Ab (green), RXR Ab (red), and nuclei marked with Hoechst (blue). Scale bar, 10 µm. (c,d) Immunoblot quantification of endogenous VDR expression in the wt HNC cell lines (1-SCC-4, 2-HNCUM-01T, 3-HNCUM-02T, and 4-FaDu) as well as the VDR-GFP transfected, overexpressing cell lines (5-FaDu VDR, and 6-HNCUM-02T-VDR). Actin served as a loading control. (d) Relative protein quantification of the Western blot. (e) Generation of VDR-overexpressing HNC cell models. HNCUM-02T cells were transfected with VDR C-terminally fused to GFP (green). Positive clones were selected using puromycin and sorted by FACS into high, medium, and low subpopulations. Low-expressing subpopulations were used for the experiments. (f) Fluorescence microscopy visualized VitD-induced expression and nuclear translocation of VDR in HNC (HNCUM-02T) cells. Scale bar, 10 µm. Cells were treated with 10 or 100 nM VitD for 30 min, fixed and nuclei were stained with Hoechst (blue). (g) VDR translocation was automatically quantified by high-throughput microscopy and normalized to the untreated controls. Statistical analysis of the nucleus-to-cytoplasm ratio (N/C) revealed a significantly increased N/C ratio in the presence of VitD compared to the untreated controls, indicating a cytoplasm-to-nuclear translocation. Statistical significance is represented in figures as follows: * p < 0.05, ** p < 0.01, and **** p < 0.0001. A p value that was less than 0.05 was considered statistically significant.
Figure 4
Figure 4
VitD/cisplatin combinations synergistically enhance the cisplatin-mediated killing of HNC tumor cells. (a) Cotreatment of VitD/cisplatin synergistically triggered the cell death of HNCUM-02T, FaDu, Pica, and SCC-4 cells compared to cisplatin alone. Cells were seeded in the presence of 100 nM VitD, and after 24 h, the cells were treated with 15–20 µM cisplatin with or without VitD (100 nM). The viability of the untreated control was set to 1. (be) Chou–Talalay dose–effect curves and calculation of the combination index (CI) demonstrate the synergistic effect of VitD/cisplatin combination treatments in HNCUM-02T, FaDu, Pica cells, and SCC-4, respectively. ** p < 0.01 and **** p < 0.0001.
Figure 5
Figure 5
Assessing the impact of VitD/VDR targeting in HNC 3D tumor spheroids. (a) Illustration depicting different 3D spheroid properties that can be assessed using label-free, automated high-content microscopy. (b) The synergistic killing effect of VitD/cisplatin reduced the growth of the Picares 3D spheroids. The mean object sizes of the spheroids (n = 8) were automatically determined by HCS microscopy (Array Scan VTI) following VitD (100 nM), cisplatin (20 µM), or a combination of both for 72 h and normalized to the untreated control. (c) The synergistic killing effect of the VitD/cisplatin combinations was also reflected by the cell viability of the Picares 3D spheroids. Spheroids were treated as described in (b). **, p < 0.01, ***, p < 0.005 (d,e) VitD treatment affected 3D spheroid formation. Automated high-content microscopy was used to visualize (d) and quantify (e) the Picares tumor spheroid growth after VitD treatment. Spheroid formation was observed for 10 days with and without (control) the addition of 100 nM VitD. The mean object area of the Picares spheroids (n = 8) was automatically determined by HCS Array Scan VTI. Representative spheroids are shown. Scale bar 250 µm.
Figure 6
Figure 6
VitD enhances the chemotherapeutic effect of cisplatin via mTOR-PI3K/Akt downregulation. (a,b) Ingenuity pathway analysis summarizing the mTOR (a) and PI3K/Akt (b) signaling pathways in cancer. Proteins potentially affected by VitD/VDR activation are highlighted in pink. (c,d) Immunoblot analyses revealed a significant decrease in pmTOR (c) and pAkt (d) in the VitD/cisplatin co-treated FaDu and HNCUM-02T cells. Actin served as a loading control. Proteins were detected by specific Abs.

References

    1. Muñoz A., Grant W.B. Vitamin D and cancer: An historical overview of the epidemiology and mechanisms. Nutrients. 2022;14:1448. doi: 10.3390/nu14071448. - DOI - PMC - PubMed
    1. Henn M., Martin-Gorgojo V., Martin-Moreno J.M. Vitamin D in Cancer Prevention: Gaps in Current Knowledge and Room for Hope. Nutrients. 2022;14:4512. doi: 10.3390/nu14214512. - DOI - PMC - PubMed
    1. Gangwar S.K., Kumar A., Jose S., Alqahtani M.S., Abbas M., Sethi G., Kunnumakkara A.B. Nuclear receptors in oral cancer-Emerging players in tumorigenesis. Cancer Lett. 2022;536:215666. doi: 10.1016/j.canlet.2022.215666. - DOI - PubMed
    1. De Bosscher K., Desmet S.J., Clarisse D., Estébanez-Perpiña E., Brunsveld L. Nuclear receptor crosstalk—Defining the mechanisms for therapeutic innovation. Nat. Rev. Endocrinol. 2020;16:363–377. doi: 10.1038/s41574-020-0349-5. - DOI - PubMed
    1. Tuna S., Aydin M.A., Aydin M.F. The Four Horsemen of the Apocalypse: Cancer, Depression, Vitamin D Deficiency, and Obesity: An Observational Study. Dis. Mrk. 2023;2023:9652491. doi: 10.1155/2023/9652491. - DOI - PMC - PubMed