. 2023 Mar 2;24(5):4825.
doi: 10.3390/ijms24054825.

Transfer of Proteins from Cultured Human Adipose to Blood Cells and Induction of Anabolic Phenotype Are Controlled by Serum, Insulin and Sulfonylurea Drugs

Affiliations

Transfer of Proteins from Cultured Human Adipose to Blood Cells and Induction of Anabolic Phenotype Are Controlled by Serum, Insulin and Sulfonylurea Drugs

Günter A Müller et al. Int J Mol Sci. .

Abstract

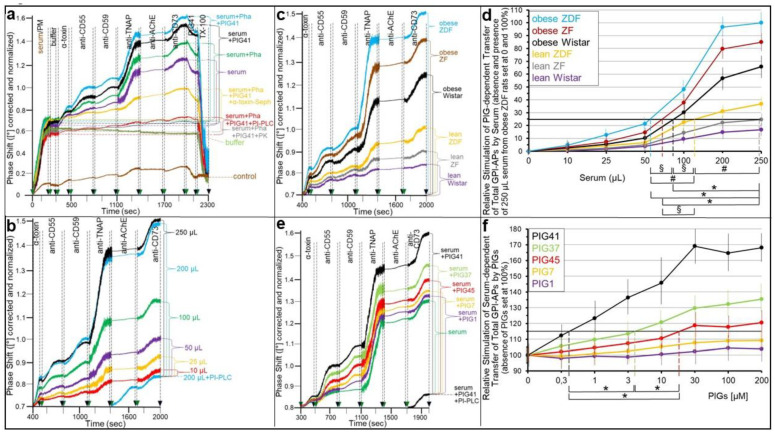
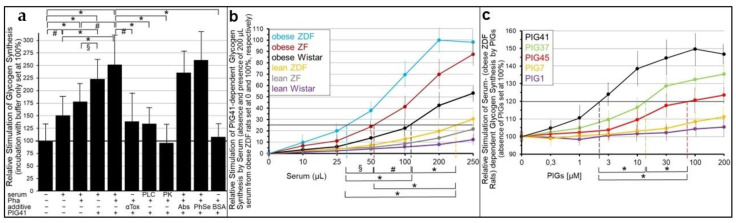
Glycosylphosphatidylinositol-anchored proteins (GPI-APs) are anchored at the outer leaflet of eukaryotic plasma membranes (PMs) only by carboxy-terminal covalently coupled GPI. GPI-APs are known to be released from the surface of donor cells in response to insulin and antidiabetic sulfonylureas (SUs) by lipolytic cleavage of the GPI or upon metabolic derangement as full-length GPI-APs with the complete GPI attached. Full-length GPI-APs become removed from extracellular compartments by binding to serum proteins, such as GPI-specific phospholipase D (GPLD1), or insertion into the PMs of acceptor cells. Here, the interplay between the lipolytic release and intercellular transfer of GPI-APs and its potential functional impact was studied using transwell co-culture with human adipocytes as insulin-/SU-responsive donor cells and GPI-deficient erythroleukemia as acceptor cells (ELCs). Measurement of the transfer as the expression of full-length GPI-APs at the ELC PMs by their microfluidic chip-based sensing with GPI-binding α-toxin and GPI-APs antibodies and of the ELC anabolic state as glycogen synthesis upon incubation with insulin, SUs and serum yielded the following results: (i) Loss of GPI-APs from the PM upon termination of their transfer and decline of glycogen synthesis in ELCs, as well as prolongation of the PM expression of transferred GPI-APs upon inhibition of their endocytosis and upregulated glycogen synthesis follow similar time courses. (ii) Insulin and SUs inhibit both GPI-AP transfer and glycogen synthesis upregulation in a concentration-dependent fashion, with the efficacies of the SUs increasing with their blood glucose-lowering activity. (iii) Serum from rats eliminates insulin- and SU-inhibition of both GPI-APs' transfer and glycogen synthesis in a volume-dependent fashion, with the potency increasing with their metabolic derangement. (iv) In rat serum, full-length GPI-APs bind to proteins, among them (inhibited) GPLD1, with the efficacy increasing with the metabolic derangement. (v) GPI-APs are displaced from serum proteins by synthetic phosphoinositolglycans and then transferred to ELCs with accompanying stimulation of glycogen synthesis, each with efficacies increasing with their structural similarity to the GPI glycan core. Thus, both insulin and SUs either block or foster transfer when serum proteins are depleted of or loaded with full-length GPI-APs, respectively, i.e., in the normal or metabolically deranged state. The transfer of the anabolic state from somatic to blood cells over long distance and its "indirect" complex control by insulin, SUs and serum proteins support the (patho)physiological relevance of the intercellular transfer of GPI-APs.

Keywords: (G)PI-specific phospholipase D (GPLD1); diabetes; glimepiride; glycosylphosphatidylinositol (GPI)-anchored proteins (GPI-APs); insulin action; protein transfer; sulfonylurea drugs (SUs).


Conflict of interest statement

The authors declare no conflict of interest (financial or otherwise).

Figures

Figure 1
Figure 1
Parallel loss of transferred GPI-APs and of upregulated glycogen synthesis in acceptor ELCs. Transwell co-cultures were run with human adipocytes (of lipid-loading stage IV) as donor cells or only medium (Control) and GPI-deficient ELCs as acceptor cells in the insert and bottom wells, respectively, as described in Section 4. (a) After incubation (i) for transfer (1 week, 37 °C, absence of serum and BSA), the insert wells were removed. The bottom wells were rinsed once with medium and then subjected to incubation (ii) with medium for internalization (37 °C, absence of serum and BSA) for the periods indicated (Control for 8 h). Subsequently, PMs were prepared from the ELCs of the bottom wells, then coupled to chips by ionic/covalent capture and, finally, analyzed for the expression of membrane proteins by SAW sensing, as described in Section 4. Phase shifts induced by the sequential binding of antibodies against transmembrane proteins (800–1800 s) and then GPI-APs (1800–2700 s) and by the subsequent action of bacterial PI-PLC (2700–2900 s) and, finally, TX-100 (3000–3200 s) are shown, omitting the preceding capturing of the PMs (0–700 s; for details as well as methods of correction and normalization, see [29]). Phase shift Δ measured in response to the injection of the anti-TNAP, CD73 and AChE antibodies (1800–2700 s) as summation signals, indicated by the horizontal, hatched lines and brackets for each incubation period. (b) The experiment was repeated four to six times (distinct incubations for both [i] and [ii]). Relative amounts of total GPI-APs (black line, summation signals corresponding to panel a, 1800–2700 s) or individual GPI-APs (colored lines, single signals corresponding to panel a, 1800–2100, 2100–2400, 2400–2700 s) transferred from the adipocytes during the incubation (i) and left at PMs of ELCs after the various periods of incubation (ii) are given. Significant differences between start of internalization (100% GPI-APs left at PMs at 0 min of incubation [i]) and the various periods of second incubation (0–480 min) for both total (black symbols) and individual GPI-APs (colored symbols), as well as between total GPI-APs and AChE, for each period of incubation (ii) (turquois symbols) are indicated. (c,d) The acceptor ELCs, which were run for 120 min (c) or increasing periods (d) of incubation, (ii) were used for the determination of glycogen synthesis during incubation (iii) (15 min, 37 °C, presence of BSA) with [U-14C]glucose at increasing concentrations and a constant specific radioactivity, as described in Section 4. (c) The absolute amount of glycogen synthesized in the ELCs is given (dpm) for the configuration with donor adipocytes or only medium as the control in the insert wells, with significant differences between glucose at 0.1 mM and higher concentrations (green and blue symbols, respectively), as well as between donor adipocytes and medium control, at each glucose concentration (black symbols) indicated. (d) The fold-stimulation of glycogen synthesis in ELCs is given for the configuration with donor adipocytes in the insert wells (medium control set at 1) and for each glucose concentration and each period of incubation (ii). Significant differences between 0 min and the various periods of internalization are indicated for each glucose concentration (correspondingly colored symbols), as well as between 0.1 and 15 mM glucose for each period of internalization (red symbols) (means ± SD; * p ≤ 0.01, # p ≤ 0.02, § p ≤ 0.05). (b,d) Half-life times for 50% loss of transferred GPI-APs from the PMs of ELCs and 50% reduction of glycogen synthesis stimulation (as indicated by the horizontal, hatched lines) are given by the vertical, hatched lines. (c) Glucose concentrations for the half-maximal stimulation of glycogen synthesis in ELCs (as indicated by the horizontal, hatched lines) are given by the vertical, hatched lines.
Figure 2
Figure 2
Inhibition of the internalization of transferred GPI-APs via the GEEC and persistence of transfer-induced glycogen synthesis in ELCs. Transwell co-cultures were run with human adipocytes (of lipid-loading stage IV) as donor cells or only medium (Control no transfer) and GPI-deficient ELCs as acceptor cells in the insert and bottom wells, respectively, as described in Section 4. (a) After incubation (i) for transfer (1 week, 37 °C, absence of serum and BSA), the insert wells were removed. The bottom wells were rinsed once with medium and then subjected to incubation (ii) with medium for internalization (480 min, 37 °C, absence of serum and BSA) in the absence (Control transfer) or presence of Dynasore (80 µg/mL), filipin (0.5 µg/mL) and chlorpromazine (50 µM). The following procedures were performed as described for Figure 1a. Phase shift Δ was measured in response to the injection of anti-Band-3, Glut1 and Cav1 (800–1800 s; TM), as well as TNAP, CD73 and AChE antibodies (1800–2700 s; GPI), as summation signals indicated by the horizontal, hatched lines and brackets for each incubation condition. (b) The experiment was repeated four and five times (distinct incubations [ii]). Relative amounts of the total (summation signals, black bars) and individual (colored bars) transmembrane proteins (TM) and GPI-APs (GPI) transferred from the human adipocytes during incubation (i) and left at the PMs of the ELCs after incubation (ii) in the presence or absence (set at 100% each) of various inhibitors of endocytosis are given. Significant differences between the absence and presence of each inhibitor for both the total (black bars) and individual (colored symbols) TM and GPI-APs are indicated. (c) The acceptor ELCs in the bottom wells of the transwell co-cultures were used for the determination of glycogen synthesis during incubation (iii) for glycogen synthesis (15 min, 37 °C, presence of BSA) with [U-14C]glucose (0.1 mM) after the various periods of incubation (ii) in the absence (green line) or presence of the various inhibitors, as described in Section 4. Relative glycogen synthesis left in ELCs is given, with no incubation (ii) (0 min) set at 100%. (d) Transwell co-cultures were run with human adipocytes as donor cells or only medium (Control) and ELCs as acceptor cells in the insert and bottom wells, respectively, as described in Section 4. After incubation (i) for transfer (1 week, 37 °C, absence of serum and BSA), the insert wells were removed. The bottom wells were rinsed once with medium and then subjected to incubation (ii) with medium for internalization (37 °C, absence of serum and BSA) in the absence of siRNA for 0 min (No siRNA; green curve) and 480 min (No siRNA; orange curve) or presence of siRNAs (30 nM) directed against Cdc42, RhoA and Rac1 for 480 min. The following procedures were performed as described for Figure 2a, except for injecting anti-Glut4 rather than Glut1 antibodies. (e) The experiment was repeated four to seven times (distinct incubations [ii]). Relative amounts of the total GPI-APs (summation signals) transferred from the human adipocytes during incubation (i) and then left at the PMs of ELCs after incubation (ii) in the presence or absence of siRNAs are given, with the 0 min incubations set at 100% each. Significant differences between each incubation period and the 0 min incubation (colored symbols), as well as between the absence and presence of each siRNA for each incubation period, are indicated (black symbols). (f) The acceptor ELCs in the bottom wells of the transwell co-cultures were used for the determination of glycogen synthesis during incubation (iii) (15 min, 37 °C, presence of BSA) with [U-14C]glucose (0.1 mM) after the various periods of incubation (ii) in the absence (green line) or presence of each siRNA. The relative glycogen synthesis in the ELCs is given with no incubation (ii) (0 min) set at 100%. Significant differences between each incubation period and the 0 min incubation (colored symbols), as well as between the absence and presence of each siRNA for each incubation period, are indicated (black symbols) (means ± SD; * p ≤ 0.01, # p ≤ 0.02, § p ≤ 0.05).
Figure 3
Figure 3
Inhibition of GPI-AP transfer from human adipocytes to ELCs by insulin and antidiabetic SUs. (a,c,e) Transwell co-cultures were run with human donor adipocytes (of lipid-loading stage II) or only medium (control no transfer) and GPI-deficient EL acceptor cells in the insert and bottom wells, respectively, as described in Section 4. After incubation (1 week, 37 °C) in the absence (control transfer) or presence of (a) human insulin (30 nM or 2 nM for half-max.) without or with the GPI-PLC inhibitor GPI2350 (100 μM) or of human FGF21 (50 nM), (c) tolbutamide (1 mM), glibenclamide (20 μM) or glimepiride (20 μM) without or with GPI2350 (100 μM) or of meglitinide (50 μM) and (e) glucose (5 mM for low glc; 20 mM for high glc) without or with insulin (30 nM) and/or glimepiride (20 μM), PMs were prepared from the ELCs of the bottom wells, coupled to chips by ionic/covalent capture and then analyzed for the expression of membrane proteins by SAW sensing, as described for Figure 1. Phase shifts induced by the binding of antibodies against GPI-APs or transmembrane proteins and by PI-PLC and TX-100 treatments (700–3200 s) are shown only, omitting the preceding capturing of PMs (0–700 s). The correction and normalization of the phase shift were performed as described for Figure 1. Phase shift Δ between the injection of the first (at 1800 s) and last antibody against GPI-APs (at 2700 s) are indicated by the horizontal, hatched lines and brackets for the various incubations. (b,d) The experiments (see a,c) were repeated three to six times with incubations at increasing concentrations of human insulin (b) or SUs (d) in the absence or presence of GPI2350 (100 μM). Phase shift Δ induced by antibodies against TNAP, CD73 and AChE (1800–2700 s) were corrected for those with medium alone in the insert wells (control no transfer) and used for the calculation of the relative transfer of total GPI-APs with the absence of insulin and SUs, respectively, set at 100% each. Significant differences between the absence and presence of insulin (b) or SUs (d) at the various concentrations, as well as between the absence and presence of GPI2350 for incubations with insulin (b) or glimepiride (d) at each concentration and between glimepiride and glibenclamide at each concentration (d) are indicated with the black and green symbols (b,d) and correspondingly colored symbols (d), respectively. (f) The experiments (see e) were repeated four or six times (distinct co-cultures) for incubations at low (0.1 mM) or high (5 mM) glucose in the absence (green bars) or presence of insulin (30 nM; red bars), glimepiride (20 μM; turquoise) or insulin together with glimepiride (grey bars). Phase shift Δ induced by antibodies against TNAP, CD73 and AChE (1800–2700 s) were corrected for those with medium alone in the insert wells (absence of insulin and SUs) and used for the calculation of the relative transfer of total GPI-APs (no addition at low glucose set at 100%). Significant differences between the relative transfer of total GPI-APs at low or high glucose at each addition are indicated (means ± SD; * p ≤ 0.01, # p ≤ 0.02, § p ≤ 0.05).
Figure 4
Figure 4
Inhibition of transfer-induced glycogen synthesis in ELCs by insulin and antidiabetic SUs. Transwell co-cultures were run with human donor adipocytes (of lipid-loading stage II) or only medium ((a,b); control no transfer) and GPI-deficient EL acceptor cells in the insert and bottom wells, respectively, as described in Section 4. After incubation (1 week, 37 °C) in the absence or presence of increasing concentrations of human insulin (a) or glimepiride, glibenclamide and tolbutamide (b) without or with GPI-PLC inhibitor GPI2350 at 100 μM (a,b) or (c) in the presence of low (0.1 mM) or high (5 mM) glucose without or with insulin (30 nM) or glimepiride (20 μM) or insulin together with glimepiride as indicated, the ELCs in the bottom plate were assayed for glycogen synthesis (15 min, 37 °C, presence of BSA, 0.1 mM [U-14C]glucose) as described in Section 4. The experiments were repeated four to six times (distinct co-cultures) with the determination of glycogen synthesis in triplicate. The relative transfer-induced glycogen synthesis in ELCs is given, with the absence of insulin (a), SUs (b) or both insulin and glimepiride at low glucose (c) set at 100%. Significant differences between the absence and presence of insulin (a) or SUs (b) at the various concentrations each are indicated with correspondingly colored symbols. Significant differences between the absence and presence of GPI2350 for incubations at each concentration of insulin (a) or glimepiride (b) and between glimepiride and glibenclamide at each concentration (b) are indicated with black and green symbols, respectively. (c) Significant differences between the various incubations at either low (left panel) or high glucose (right panel), as well as between low and high glucose in the absence or presence of insulin or glimepiride, are indicated (means ± SD; * p ≤ 0.01, # p ≤ 0.02, § p ≤ 0.05).
Figure 5
Figure 5
Restoration of insulin-inhibited GPI-AP transfer by serum. (af) Transwell co-cultures were run with human donor adipocytes (of lipid-loading stage II) or only medium (only a; control no transfer) and GPI-deficient EL acceptor cells in the insert and bottom wells, respectively, as described in Section 4. The co-cultures were incubated (37 °C, 5 mM glucose) ((ad), 1 week; (e,f), increasing periods of time) in the absence (only (ac); control transfer) or presence of human insulin (30 nM, (af)) without (ac,e) or with serum (a,b,e,f, 100 µL; c,d, increasing volumes; see brackets), which was prepared from lean or obese Wistar, ZF or ZDF rats (a,d,f) or obese ZDF rats (b,c,e) and then diluted 10-fold with PBS containing 2 mM Pha in the presence of Ca2+ (4 mM) (b), Pha (1 mM) ((af,b) as indicated) or PIG41 (100 µM) (c). Thereafter PMs were prepared from the ELCs of the bottom wells, coupled to chips by ionic/covalent capture and then analyzed for the expression of membrane proteins by SAW sensing, as described for Figure 1. Phase shifts induced by the binding of antibodies against TMPs (800–1800 s; only shown for (a)) and GPI-APs (1800–2700 s) and by subsequent PI-PLC and TX-100 treatments (2700–3200 s) are shown only, omitting the preceding capturing of the PMs (0–700 s). The serum was left untreated (af) or (b) digested with bacterial PI-PLC (PLC), human GPLD1 (PLD) or proteinase K (PK) or supplemented with α-toxin (αTox) or antibodies against TNAP, CD73 and AChE (Abs), each coupled to Sepharose beads or phenyl Sepharose beads (PhSe), as described in Section 4. In addition, BSA (4 mg/mL PBS) was added instead of serum (b). (a,c,e) Correction and normalization of the phase shift were performed as described for Figure 1. Phase shift Δ between the start of injection of anti-TNAP antibody (at 1800 s) and termination of the injection of anti-AChE antibody (at 2700 s) are indicated by the horizontal, hatched lines and brackets for each incubation condition. (b) The experiment (see (a)) was repeated three to five times (distinct co-cultures) and SAW sensing in quadruplicate. Phase shift Δ induced by antibodies against TNAP, CD73 and AChE (1800–2700 s) were corrected for medium alone in the insert wells (see (a); control no transfer) and used for the calculation of the relative transfer of total GPI-APs in the absence of both insulin and serum (see (a); control transfer) set at 100%, with biologically relevant significant differences indicated. (c,d) The experiment (see (b)) was repeated six times (distinct co-cultures) and SAW sensing in triplicate. Phase shift Δ induced by antibodies against TNAP, CD73 and AChE (1800–2700 s) were corrected for medium alone in the insert wells (c) and used for the calculation of the relative insulin-inhibited transfer of total GPI-APs in presence of serum (d), with differences between the control transfer and transfer left in the presence of insulin and absence of serum set at 100%. Significant differences in the volumes (IV50) required for a 50% reduction of the maximal insulin-inhibited transfer (horizontal, black line) between the different types of serum are indicated (vertical, colored, and hatched lines). (f) The experiment (see (e)) was repeated three to six times (distinct co-cultures and SAW sensing in quadruplicate) without and with serum from rats of different metabolic states in the presence of insulin (30 nM) for increasing transfer periods. Phase shift Δ induced by antibodies against TNAP, CD73 and AChE (1800–2700 s) were corrected for medium alone in the insert wells and used for the calculation of the relative insulin- and serum-stimulated transfer of total GPI-APs, with the transfer left after two weeks in the presence of insulin and absence of serum (see (e)) set at 100% for each transfer period. Significant differences vs. 5 min transfer period are indicated for each type of serum by the correspondingly colored symbols, as well as between obese ZDF and lean ZDF or lean Wistar rats by green or black symbols, respectively (means ± SD; * p ≤ 0.01, # p ≤ 0.02, § p ≤ 0.05).
Figure 6
Figure 6
Abrogation of the SU inhibition of GPI-AP transfer by serum. (ad) Transwell co-cultures were run with human donor adipocytes (of lipid-loading stage II) or only medium (shown only for (a,b); control no transfer) and GPI-deficient EL acceptor cells in the insert and bottom wells, respectively, as described in Section 4. The co-cultures were incubated (1 week, 37 °C, 5 mM glucose) in the absence ((a,b); control transfer) or presence of 30 µM glimepiride (a,d) without or with 100 µM GPI2350 (c; 2350) or 30 µM glibenclamide (b) or 50 µM meglitinide (c; megl) in the absence ((a,b); no serum) or presence of 100 µL (ac) or increasing volumes (d) of serum, which had been prepared from lean or obese Wistar, ZF or ZDF rats (a,b,d) or obese ZDF rats (c) and then diluted 10-fold with PBS containing 2 mM Pha, or of 100 µL of BSA (4 mg/mL PBS) in the presence of 4 mM Ca2+ (ad) or 1 mM Pha (only (c)). PMs were prepared from the ELCs of the bottom wells, coupled to chips by ionic/covalent capture and then analyzed for the expression of GPI-APs by SAW sensing, as described for Figure 1. Phase shifts induced by the binding of antibodies against GPI-APs and subsequent treatments with PI-PLC and TX-100 (1800–3200 s) are shown only, omitting the preceding capturing of PMs (0–700 s), as well as the binding of antibodies against TMPs (700–1800 s). Serum samples were left untreated (a,b,d) or (c) digested with bacterial PI-PLC (PLC), human GPLD1 (PLD) or proteinase K (PK) or supplemented with antibodies against TNAP, CD73 and AChE (Abs) or α-toxin (αTox), each coupled to Sepharose beads or phenyl Sepharose beads (PhSe) or Pha (1 mM) prior to addition to the transwell co-cultures. (a,b) Correction and normalization of the phase shift were performed, as described for Figure 1. Phase shift Δ between the start of the injection of the anti-TNAP antibody (at 1800 s) and termination of the injection of anti-AChE antibody (at 2700 s) are indicated by horizontal, hatched lines and brackets for each incubation condition. (c) The experiment was repeated four times (distinct co-cultures with SAW sensing in triplicate). Phase shift Δ induced by antibodies against TNAP, CD73 and AChE (1800–2700 s) were corrected for medium alone in the insert wells and used for the calculation of the relative transfer of total GPI-APs, with the absence of SUs, serum and additives set at 100% (horizontal, black line). Biologically relevant significant differences are indicated. (d) The experiment (see (a)) was repeated three to five times (distinct co-cultures with SAW sensing in duplicate) with increasing volumes of sera from rats of different metabolic states in the presence of 30 µM glimepiride. Phase shift Δ induced by antibodies against TNAP, CD73 and AChE (1800–2700 s) were corrected for medium alone in the insert wells and used for the calculation of the relative serum-stimulated transfer of total GPI-APs in the presence of glimepiride with the absence and presence of 200 µL serum from obese ZDF rats set at 0 and 100%, respectively. Significant differences between the volumes (EV50) effective in the 50% stimulation of glimepiride-inhibited transfer (horizontal, black line) of sera from obese Wistar, ZF and ZDF rats (vertical, colored, and hatched lines) are indicated (means ± SD; * p ≤ 0.01, # p ≤ 0.02, § p ≤ 0.05).
Figure 7
Figure 7
Stimulation of glycogen synthesis in ELCs by GPI-AP transfer in the simultaneous presence of serum and either insulin or SUs. (a,c) Human donor adipocytes (of lipid-loading stage II) were incubated (1 week, 37 °C, 5 mM glucose) with GPI-deficient EL acceptor cells in the insert and bottom wells, respectively, of transwell co-cultures in the absence or presence of human insulin (30 nM), meglitinide (megl, 50 μM), tolbutamide (tolb, 1 mM), glibenclamide (glib, 30 μM) and glimepiride (glim, 30 μM) without or with 200 µL serum, which were prepared from obese ZDF rats and then diluted 10-fold with PBS containing 2 mM Pha, or BSA (4 mg/mL PBS) in the presence of 4 mM Ca2+ or 1 mM Pha, as indicated (a,c). The serum was left untreated or digested with bacterial PI-PLC (PLC), human GPLD1 (PLD) or proteinase K (PK) or supplemented with α-toxin (αTox) or antibodies against TNAP, CD73 and AChE (Abs), each coupled to Sepharose beads or phenyl Sepharose beads (PhSe) prior to addition to the transwell co-cultures. (b,d) The transwell co-cultures were run as above without or with increasing volumes of untreated serum, which were prepared from lean or obese Wistar, ZF or ZDF rats under the inclusion of Pha (2 mM), in the presence of insulin (30 nM) (b) or glimepiride (30 μM) (d). Thereafter, the ELCs in the bottom plate were assayed for glycogen synthesis (15 min, 37 °C, presence of BSA, 0.1 mM [U-14C]glucose), as described in Section 4. The transwell co-cultures were repeated three to five times (distinct co-cultures) with determination of glycogen synthesis in triplicate. (a,c) The relative glycogen synthesis is given with the absence of serum and insulin (a) or SUs (c) set at 100% (horizontal, black lines). Significant differences are indicated. (b,d) The relative serum-stimulated glycogen synthesis in the presence of either insulin (b) or glimepiride is given, with the absence and presence of serum (250 and 200 μL, respectively) from obese ZDF rats set at 0 and 100%, respectively. Serum volumes (EV25) effective in the 25% stimulation of glycogen synthesis (horizontal, black lines) in the presence of either insulin (b) or glimepiride (d) are indicated by the vertical, hatched, and colored lines. Significant differences between EV25 for sera from rats of different metabolic states are indicated (means ± SD; * p ≤ 0.01, # p ≤ 0.02, § p ≤ 0.05).
Figure 8
Figure 8
Binding to and displacement by PIGs from GPLD1 of full-length GPI-APs of serum from metabolically dysregulated rats. (a) After the covalent immobilization of protein A onto EDC/NHS-activated chips (0–300 s) and subsequent blockade of unreacted carboxyl groups by ethanolamine (EtNH2) (300–400 s), monoclonal anti-GPLD1 antibody (blue, yellow, brown and turquoise curves) or IgG (green curve) was injected into the chip channels. Following the washing of the chips (600–700 s), serum (200 μL, prepared from obese ZDF rats and then diluted 10-fold with PBS containing 2 mM Pha), which was pretreated with bacterial PI-PLC (0.2 mU/mL, brown curve) or remained untreated (blue, yellow, turquoise and green curves), or buffer (red curve) was injected (700–900 s) at a flow rate of 60 μL/min in the absence (turquoise curve) or presence of 1 mM Pha (all other curves) or 30 µM PIG41 (yellow curve). After washing of the channels with buffer (900–1000 s) at a flow rate of 200 μL/min and then with α-toxin (30 μg/mL, 1000–1200 s), anti-CD55 (1200–1500 s), CD59 (1500–1800 s), TNAP (1800–2100 s), AChE (2100–2400 s) and CD73 (2400–2700 s) antibodies (at the dilutions given in Supplementary Materials, Materials) were injected successively at a flow rate of 15 μL/min. After the injection of 30 μM PIG41 (2700–2850 s) together with 4 mM Ca2+ and then 0.2% TX-100 (2850–3000 s) at a flow rate of 45 μL/min, polyclonal anti-GPLD1 antibody was finally injected (3000–3300 s) at a flow rate of 15 μL/min. The experiment was repeated two times (distinct chips) with similar results (representative shown). Phase shift is given upon correction for unspecific interaction of serum components (“mock” channel lacking protein A) and altered viscosity (vs. buffer) of the sample fluid and normalization for the varying efficiencies of distinct chips for capture of protein A. (b) The experiment was performed as described (see (a), blue curve; chips with immobilized anti-GPLD1, absence of PIG41) using untreated sera prepared from rats of different metabolic states and diluted with PBS containing 2 mM Pha) as indicated and repeated four to six times (distinct chips with four injections per incubation) with similar results (representative shown). The measured phase shift was corrected (see (a)) and is only shown from the start of serum (700 s) to the end of TX-100 injection (3000 s). Phase shift increases induced by serum, α-toxin and antibodies (700–2700 s) are indicated for each type of serum (horizontal, hatched lines and brackets). (c) The experiment was repeated (see (b)) three to five times (distinct chips with four to six injections per incubation) with increasing volumes (i.e., adjusting the flow rate from 15 to 75 μL/min to cover 50–250 µL and from 30 to 75 μL/min to cover 10–25 μL) of the untreated sera (diluted 1:10 and 1:100 with PBS containing 2 mM Pha, respectively) from rats of different metabolic states as indicated. The relative amounts of GPLD1 with interacting GPI-APs, as reflected in the sum of the serum-, α-toxin- and antibody-induced phase shift increases (see (b); 700–2700 s), are given, with the absence (200 μL of buffer; see a, red curve) and presence of serum (200 μL from obese ZDF rats; see a,b, blue curves) set at 0 and 100%, respectively. Serum volumes (EV50) effective in the 50% increase in the relative amounts of GPLD1 interacting with GPI-APs (as shown by the horizontal, black line) are indicated by the vertical, hatched, and colored lines. Significant differences between EV50 of sera from rats of different metabolic states are indicated. (d) The experiment was performed as described (see (a); chips with immobilized anti-GPLD1) with untreated serum, prepared from obese ZDF rats and diluted with PBS containing Pha, and subsequent injection of PIG41, 37, 45, 7 and 1 (30 μM) or buffer together with Ca2+ (4 mM) (blue curve) and repeated once (distinct chips with four channels per incubation) with similar results (representative shown). The measured phase shift was corrected (see (a)) and is only shown from the start of the last antibody (2400 s) to the end of the TX-100 injection (3000 s). PIG-induced phase shift decreases (2600–2800 s) are indicated (horizontal, hatched lines and brackets). (e,f) The experiment was repeated (see (d)) four to six times (distinct chips with four to eight channels per incubation) using increasing concentrations of PIGs together with Ca2+ (4 mM) and with serum (200 μL) from obese ZDF (e) and lean ZF rats (f). The relative dissociation of GPLD1 and GPI-APs by PIGs, as reflected in the PIG-induced phase shifts (2600–2800 s), is given with the absence and presence of 30 (e) or 100 μM PIG41 (f) set at 0 and 100%, respectively. The concentrations of PIGs effective in the 50% increase in dissociation (EC50; shown by horizontal, black lines) are indicated by the vertical, hatched, and colored lines. Significant differences between EC50 of the different PIGs are indicated (means ± SD; * p ≤ 0.01, # p ≤ 0.02, § p ≤ 0.05).
Figure 9
Figure 9
Transfer to ELCs of GPI-APs released from serum GPI-binding proteins of metabolically dysregulated rats by PIGs. (af) GPI-deficient EL acceptor cells were incubated (1 week, 37 °C, 5 mM glucose, 1 mM Ca2+) in the bottom wells of transwell co-cultures with 200 μL buffer (a) or serum (a,c,e,f, 200 µL; b,d, increasing volumes), which were prepared from obese ZDF rats (a,b,e,f) or rats of different metabolic states (c,d), then diluted 10-fold with PBS lacking ((a), as indicated) or containing 2 mM Pha (af) and thereafter left untreated ((a), as indicated; bf) or incubated with proteinase K (PK), bacterial PI-PLC (PLC), α-toxin coupled to Sepharose beads (α-toxin) (a), 30 μM PIG41 (ad) or different PIGs ((e), 30 µM; f, increasing concentrations). Thereafter, the ELCs were washed thoroughly by rinsing the bottom wells three times with 2 mL each of 20 mM Tris/HCl, 1.5 M NaCl and then two times with 2 mL each of PBS. Subsequently, PMs were prepared from the ELCs, coupled to chips by ionic/covalent capture (0–200 s), as described in Section 4, and then analyzed for expression of GPI-APs by SAW sensing. As a control, 200 μL serum from obese ZDF rats instead of PMs were injected into the chips (0–200 s) at a flow rate of 60 μL/min ((a) only, brown curve). After washing of the channels with buffer (200–300 s) at a flow rate of 200 μL/min, α-toxin (30 μg/mL, 300–500 s), anti-CD55 (500–800 s), CD59 (800–1100 s), TNAP (1100–1400 s), AChE (1400–1700 s) and CD73 (1700–1950 s) antibodies (at the dilutions given in Supplementary Materials, Materials) were injected successively at a flow rate of 15 μL/min, followed by 30 μM PIG41 (1950–2150 s, shown only for (a)) and then 0.2% TX-100 (2150–2300 s, shown only for (a)) at a flow rate of 45 μL/min. Measured phase shifts were corrected and normalized as described for Figure 1 (a) or by subtraction of the control (see (a), serum instead of PM, brown curve) values (b,c,e). (a,c) Phase shift Δ between the start of the α-toxin (300 s) and termination of the anti-CD73 antibody (1950 s) injection indicated by the horizontal, hatched lines ((a) only) are given by brackets. (b,e) Brackets indicate the difference between the total phase shift induced by α-toxin and all antibodies for each incubation condition and a control phase shift induced by pretreatment of 200 μL serum with PIG41 and bacterial PI-PLC (blue and black curves). (d,f) The experiments (see (c,e), respectively) were repeated (four or six incubations and distinct chips with four channels per incubation) using increasing volumes of untreated serum from rats of different metabolic states (d) or increasing concentrations of different PIGs (f). The relative stimulation of PIG- ((d), 30 μM PIG41) and serum- ((f), 250 μL, obese ZDF rats) dependent transfer of total GPI-APs, as reflected in the α-toxin- and antibody-induced phase shifts, are calculated with the absence and presence of 250 µL serum from obese ZDF rats set at 0 and 100%, respectively, (d) or absence of PIGs set at 100% (f). Significant differences between the volumes effective in the 25% stimulation (EV25, (d)) or concentrations effective in 15% stimulation (EC15, (f)) of transfer (horizontal black lines) by the different sera (d) and PIGs (f), respectively, are indicated (vertical, colored, and hatched lines) (means ± SD; * p ≤ 0.01, # p ≤ 0.02, § p ≤ 0.05).
Figure 10
Figure 10
Stimulation of glycogen synthesis in ELCs by PIGs and serum GPI-binding proteins of metabolically dysregulated rats. (ac) GPI-deficient EL acceptor cells were incubated (1 week, 37 °C, 5 mM glucose, 1 mM Ca2+) in the bottom wells of transwell co-cultures with 200 μL buffer (a,b) or serum ((a,c), 200 µL; b, increasing volumes), prepared from obese ZDF rats (a,c) or rats of different metabolic states (b) and then diluted 10-fold with PBS lacking ((a), as indicated) or containing 2 mM Pha (ac), which were left untreated ((a), as indicated; b,c) or incubated with proteinase K (PK), bacterial PI-PLC (PLC), α-toxin (α-toxin), anti-CD55, CD59, TNAP and CD73 antibodies (Abs), each coupled to Sepharose beads, phenyl Sepharose beads (PhSe) or 200 μL of BSA (4 mg/mL) (a), in the absence ((a), as indicated) or presence of PIG41 ((a,b), 30 μM; c, increasing concentrations) or different PIGs (c). Thereafter, the ELCs were washed intensely by rinsing the bottom wells three times with 2 mL each of 20 mM Tris/HCl, 1.5 M NaCl and then two times with 2 mL each of PBS and subsequently assayed for glycogen synthesis (15 min, 37 °C, presence of BSA, 0.1 mM [U-14C]glucose) as described in Section 4. The experiment was repeated five to seven times (distinct incubations) with determination of glycogen synthesis in triplicate or quadruplicate. (a) The relative stimulation of glycogen synthesis by serum and PIG41 in the presence of Pha or other additives is given with incubation with buffer only set at 100%. (b,c) The relative stimulation of PIG41- (b) or serum (from obese ZDF rats)- (c) dependent glycogen synthesis by serum from metabolically different rats (b) or by different PIGs (c), respectively, is shown with the absence and presence of serum set at 0 and 100% (b) or the absence of PIGs set at 100% (c). Significant differences are indicated between the relative stimulations of glycogen synthesis under the various incubation conditions (a) or between the serum volumes effective in 25% (EV25, (b)) or PIG concentrations effective in 20% (EC20, (c)) stimulation of glycogen synthesis (horizontal, black lines), as indicated by vertical, hatched, and colored lines (means ± SD; * p ≤ 0.01, # p ≤ 0.02, § p ≤ 0.05).

Similar articles

Cited by

References

    1. Haldar K., Ferguson M.A.J., Cross G.A.M. Acylation of a Plasmodium falciparum merozoite surface antigen via sn-1,2-diacylglycerol. J. Biol. Chem. 1985;260:4969–4974. doi: 10.1016/S0021-9258(18)89167-0. - DOI - PubMed
    1. Ferguson M.A.J., Homans S.W., Dwek R.A., Rademacher T.W. Glycosyl-phosphatidylinositol moiety that anchors Trypanosoma brucei variant surface glycoprotein to the membrane. Science. 1988;239:753–759. doi: 10.1126/science.3340856. - DOI - PubMed
    1. UniProt C. 2015 UniProt: A hub for protein information. Nucleic Acids Res. 2015;43:D204–D212. - PMC - PubMed
    1. Eisenhaber B., Bork P., Eisenhaber B. Post-translational GPI lipid anchor modification of proteins in kingdoms of life: Analysis of protein sequence data from complete genomes. Protein Eng. 2001;14:17–25. doi: 10.1093/protein/14.1.17. - DOI - PubMed
    1. Lopez S., Rodriguez-Gallardo S., Sabido-Bozo S., Muniz M. Endoplasmic reticulum export of GPI-anchored proteins. Int. J. Mol. Sci. 2019;20:3506. doi: 10.3390/ijms20143506. - DOI - PMC - PubMed