

Characteristics of Mg-Based Sintered Alloy with Au Addition
- PMID: 36903032
- PMCID: PMC10003831
- DOI: 10.3390/ma16051915
Characteristics of Mg-Based Sintered Alloy with Au Addition
Abstract
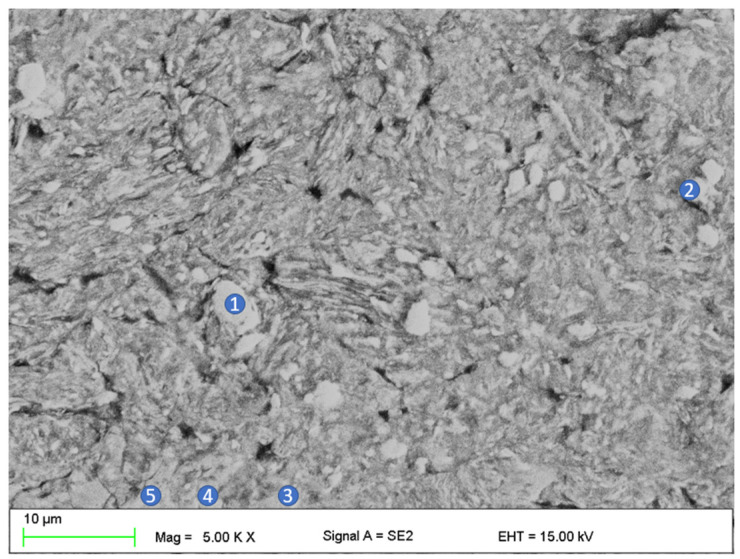
The magnesium-based alloys produced by mechanical alloying (MA) are characterized by specific porosity, fine-grained structure, and isotropic properties. In addition, alloys containing magnesium, zinc, calcium, and the noble element gold are biocompatible, so they can be used for biomedical implants. The paper assesses selected mechanical properties and the structure of the Mg63Zn30Ca4Au3 as a potential biodegradable biomaterial. The alloy was produced by mechanical synthesis with a milling time of 13 h, and sintered via spark-plasma sintering (SPS) carried out at a temperature of 350 °C and a compaction pressure of 50 MPa, with a holding time of 4 min and a heating rate of 50 °C∙min-1 to 300 °C and 25 °C∙min-1 from 300 to 350 °C. The article presents the results of the X-ray diffraction (XRD) method, density, scanning electron microscopy (SEM), particle size distributions, and Vickers microhardness and electrochemical properties via electrochemical impedance spectroscopy (EIS) and potentiodynamic immersion testing. The obtained results reveal the compressive strength of 216 MPa and Young's modulus of 2530 MPa. The structure comprises MgZn2 and Mg3Au phases formed during the mechanical synthesis, and Mg7Zn3 that has been formed during the sintering process. Although MgZn2 and Mg7Zn3 improve the corrosion resistance of the Mg-based alloys, it has been revealed that the double layer formed because of contact with the Ringer's solution is not an effective barrier; hence, more data and optimization are necessary.
Keywords: magnesium alloys; mechanical alloying; spark plasma sintering.
Conflict of interest statement
The authors declare no conflict of interest.
Figures


References
-
- Rakowska J., Radwan K., Ślosorz Z. Problems of Estimation the Size and Shape of Grain Solids. Chemical and Fire Research Laboratories, Poznań University of Technology; Poznań, Poland: 2012.
-
- Kelsall R.W., Hamley I.W., Geoghegan M. Nanotechnologies. Polish Scientific Publishers PWN; Warsaw, Russia: 2008.
-
- Lesz S., Tański T., Hrapkowicz B., Karolus M., Popis J., Wiechniak K. Characterization of Mg-Zn-Ca-Y powders manufactured by mechanical milling. J. Achiev. Mater. Manuf. Eng. 2020;103:49–59.
-
- Wang Y.P., Li B.S., Ren M.X., Yang C., Fu H.Z. Microstructure and compressive properties of AlCrFeCoNi high entropy alloy. Mater. Sci. Eng. A. 2008;491:154–158. doi: 10.1016/j.msea.2008.01.064. - DOI
-
- Jurczyk M. Mechanical Alloying. Publishing House of the Poznań University of Technology; Poznań, Poland: 2003.
Grants and funding
LinkOut - more resources
Full Text Sources
