. 2023 Feb 25;28(5):2167.
doi: 10.3390/molecules28052167.

BF2-Azadipyrromethene Fluorophores for Intraoperative Vital Structure Identification

Affiliations

BF2-Azadipyrromethene Fluorophores for Intraoperative Vital Structure Identification

Cathal Caulfield et al. Molecules. .

Abstract

A series of mono- and bis-polyethylene glycol (PEG)-substituted BF2-azadipyrromethene fluorophores have been synthesized with emissions in the near-infrared region (700-800 nm) for the purpose of fluorescence guided intraoperative imaging; chiefly ureter imaging. The Bis-PEGylation of fluorophores resulted in higher aqueous fluorescence quantum yields, with PEG chain lengths of 2.9 to 4.6 kDa being optimal. Fluorescence ureter identification was possible in a rodent model with the preference for renal excretion notable through comparative fluorescence intensities from the ureters, kidneys and liver. Ureteral identification was also successfully performed in a larger animal porcine model under abdominal surgical conditions. Three tested doses of 0.5, 0.25 and 0.1 mg/kg all successfully identified fluorescent ureters within 20 min of administration which was sustained up to 120 min. 3-D emission heat map imaging allowed the spatial and temporal changes in intensity due to the distinctive peristaltic waves of urine being transferred from the kidneys to the bladder to be identified. As the emission of these fluorophores could be spectrally distinguished from the clinically-used perfusion dye indocyanine green, it is envisaged that their combined use could be a step towards intraoperative colour coding of different tissues.

Keywords: BF2-azadipyrromethene; NIR-fluorescence; fluorescence guided surgery; pegylation; ureter identification.


Conflict of interest statement

DFOS has a financial interest in patents filed and granted relating to NIR-fluorophores and processes for visual determination of tissue biology. RC is named on a patent filed in relation to processes for visual determination of tissue biology and receives speaker fees from Stryker Corp, consultancy fees from Distal Motion and holds research funding from Intuitive Corp and with IBM Corp and Deciphex. PMA, SZ are full-time employees of IBM Research, a division of IBM Corporation. IBM Corporation provides technical products and services world-wide to government, healthcare and life-sciences companies. PMA, SZ hold and have filed patents concerning technologies related to the subject matter of this paper. MD is member of the Advisory Board of Diagnostic Green and is the recipient of the ELIOS grant from the ARC Foundation. JM is the President of the IRCAD Institute, which is partly funded by KARL STORZ and Medtronic.

Figures

Figure 1
Figure 1
General structure of NIR-AZA fluorophores showing position of PEG attachments via blue coloured aryl ring and non-pegylated reference fluorophore 1a used in this study. Design of (A) mono and (B) dual substituted pegylated (blue line) NIR-AZA fluorophores (red rectangle).
Scheme 1
Scheme 1
Synthesis of advanced intermediates NIR-AZAs 1b and 2. (i) 1b, MeI, CsF, DMSO (anhydrous), 30 °C, N2, 20 min, 83%. For alternative route to 2 see SI Figure S1.
Scheme 2
Scheme 2
Synthesis of mono- and bis-activated ester fluorochromes 4 and 6. Conditions (i) BrCH2CO2tBu, CsF, DMSO (anhydrous), 40 °C, 2 h, 84%. (ii) TFA, CH2Cl2, rt, 3 h, 80%. (iii) N-hydroxy-succinimide, EDCI, DMSO (anhydrous), rt, 2 h, 83%. (iv) BrCH2CO2tBu, NaH, THF, reflux, 3 h, 73%. (v) TFA, CH2Cl2, rt, 4 h, 85%. (vi) N-hydroxysuccinimide, EDCI, DMSO (anhydrous), rt, 3.5 h, 85%.
Scheme 3
Scheme 3
Synthesis of mono- and dual-pegylated NIR-AZA fluorophores 712 via N-hydroxysuccinimide esters/amino-PEG coupling reactions. (i) H2N-PEG-OH (1.05 equiv.), DMSO, rt 1 h. (ii) H2N-PEG-OH (2.1 equiv.), DMSO, rt 1 h.
Figure 2
Figure 2
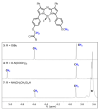
Representative partial 1H NMR analysis for the conversion of 3 into 4 and subsequently into 7. NMRs show chemical shift change in methylene and methoxy protons (coloured blue) as indicated in the structures. * PEG polymer.
Figure 3
Figure 3
Representative absorption (normalized) and emission spectra of mono- and dual-PEG-substituted fluorophores. (A) Comparison of 8 and 11 in H2O (2 µM, 2.5 nm slit widths). (B) Comparison of 9 and 12 in H2O (2 µM, 2.5 nm slit widths). (C) Comparison of 12 in H2O and CH3CN (2 µM, 2.5 nm slit widths). See SI Figure S3 for all absorbance and emission spectra.
Figure 4
Figure 4
Representative example showing fluorophore 12 at differing concentrations in PTFE tubing of 2 mm external diameter imaged using the Quest spectrum instrument. Images taken with tubing submerged to a depth of 1 cm in water of 1% intralipid. (A) White light image with fluorescence superimposed in green colour. (B) Fluorescence image shown in black and white for clarity.
Figure 5
Figure 5
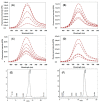
Fluorescence and HPLC analysis of rat urine samples. (A) Overlaid emission spectra of rat urine samples from 2.0 mg/kg dose. (B) 0.2 mg/kg dose. (C) 0.1 mg/kg dose. (D) 0.05 mg/kg dose. (E) Analytical HPLC of 12; CH3CN/H2O (45:55) as eluent, 650 nm detector, 1 mL/min flow rate. (F) Representative analytical HPLC of rat urine sample from 2.0 mg/kg dose with the same HPLC conditions as for (E).
Figure 6
Figure 6
Representative imagery from surgical rat model study showing exposed ureters (n = 3). (A) Image recorded at 35 min post-administration of 12. Left, fluorescence (pseudo coloured green) overlaid on white light image. Right, fluorescence alone shown as black and white for clarity. Both ureters indicated by red arrows and bladder by asterisk. (B) Image recorded at 50 min. Left, fluorescence (pseudo coloured green) overlaid on white light image, red arrow (ureter), circle (kidney), triangle (spleen), square (liver). Right, fluorescence alone shown as black and white for clarity. Red arrow identifying ureter and yellow boxes indicate regions from which the average pixel intensity data were obtained.
Figure 7
Figure 7
Comparison of animal body weights treated with 12 at doses of (i) 14 mg/kg (2 mg/kg per day for 7 days) (grey bars, vertical lines), (ii) 10 mg/kg (grey bars horizontal lines) and PBS control (solid grey bars) on days 1, 4 and 7 (n = 3).
Figure 8
Figure 8
Porcine ureter identification following administration of differing dosages of 12 and at different time points (n = 6). (A) Images at 20 and 120 min following the administration of 0.5 mg/kg dose. (B) Images at 20 and 120 min following the administration of 0.25 mg/kg dose.(C) Images at 20 and 80 min following the administration of 0.1 mg/kg dose. * Indicates the bladder. X Indicates non-fluorescent ICG reference card. For other representative images see Figure S8.
Figure 9
Figure 9
Representative images showing ureter identification in porcine model following treatment with 12 and ICG (0.5 mg/kg). (A) Image taken 120 min post administration of 12 (0.1 mg/kg) following administration of ICG using 660 nm excitation and (B) using 790 nm excitation. Note ICG reference card is not fluorescent in A and is fluorescence in B, with ureter fluorescence in A but not in B. (C) Image taken 120 min post administration of 12 (0.25 mg/kg) following administration of ICG using 660 nm excitation and (D) using 790 nm excitation. Note ICG reference card is not fluorescent in C and is fluorescent in D, with ureter fluorescent in C but not in D. Red arrows indicate ureters and circle indicates kidneys.
Figure 10
Figure 10
Fluorescence heat-map (above) showing temporal modulation of fluorescence intensity from 12 during ureteral peristalsis and tissue video image with fluorescence superimposed in white colour (below) with ureter marked as (i). Tracking a single ureteral peristaltic phase 30 min post administration with (AF) recorded over 5 s. X Indicates ICG non-emissive reference card.

References

    1. Mieog J.S.D., Achterberg F.B., Zlitni A., Hutteman M., Burggraaf J., Swijnenburg R.-J., Gioux S., Vahrmeijer A.L. Fundamentals and developments in fluorescence-guided cancer surgery. Nat. Rev. Clin. Oncol. 2022;19:9–22. doi: 10.1038/s41571-021-00548-3. - DOI - PubMed
    1. Stewart H.L., Birch D.J.S. Fluorescence-guided surgery. Methods Appl. Fluoresc. 2021;9:042002. doi: 10.1088/2050-6120/ac1dbb. - DOI - PubMed
    1. Van Keulen S., Hom M., White H., Rosenthal E.L., Baik F.M. The evolution of fluorescence-guided surgery. Mol. Imaging Biol. 2022 doi: 10.1007/s11307-022-01772-8. - DOI - PMC - PubMed
    1. Nagaya T., Nakamura Y.A., Choyke P.L., Kobayashi H. Fluorescence-guided surgery. Front. Oncol. 2017;7:314. doi: 10.3389/fonc.2017.00314. - DOI - PMC - PubMed
    1. Refaat A., Yap M.L., Pietersz G., Walsh A.P.G., Zeller J., del Rosal B., Wang X., Peter K.J. In vivo fluorescence imaging: Success in preclinical imaging paves the way for clinical applications. J. Nanobiotechnol. 2022;20:450. doi: 10.1186/s12951-022-01648-7. - DOI - PMC - PubMed