

Fluorescent Probes cis- and trans-Parinaric Acids in Fluid and Gel Lipid Bilayers: A Molecular Dynamics Study
- PMID: 36903487
- PMCID: PMC10005308
- DOI: 10.3390/molecules28052241
Fluorescent Probes cis- and trans-Parinaric Acids in Fluid and Gel Lipid Bilayers: A Molecular Dynamics Study
Abstract
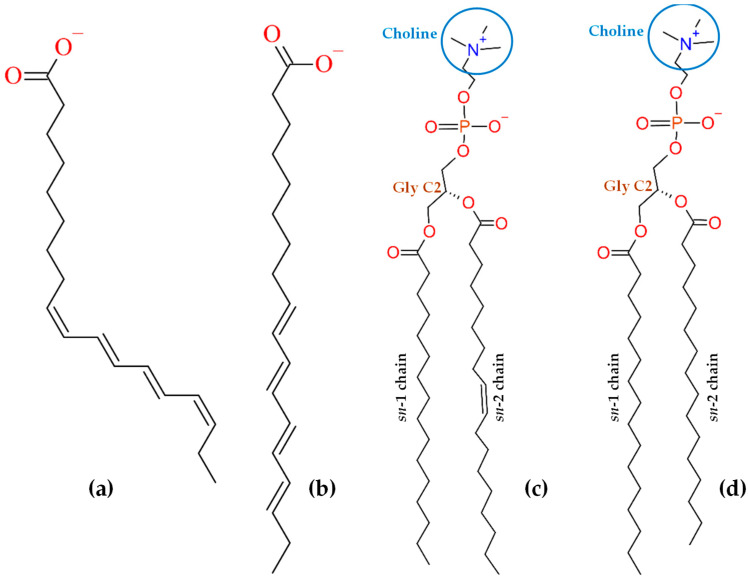
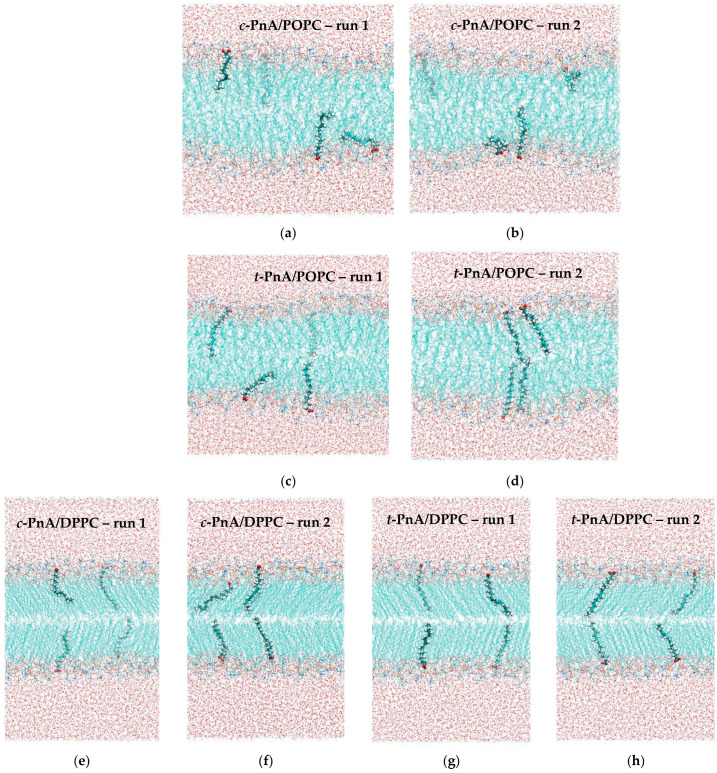
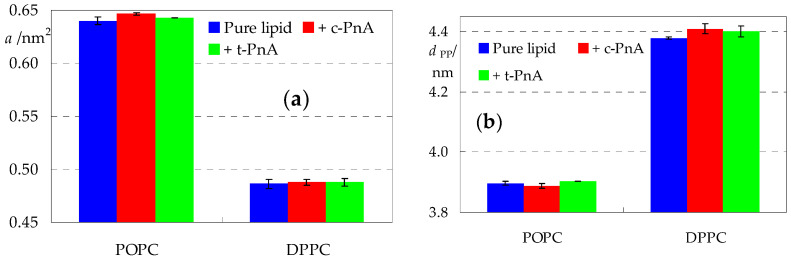
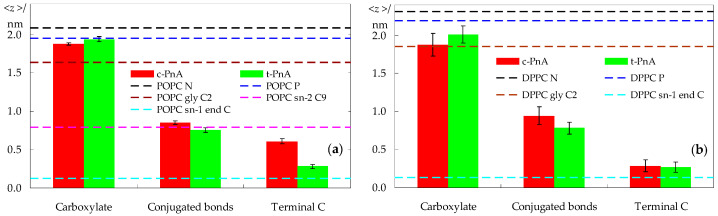
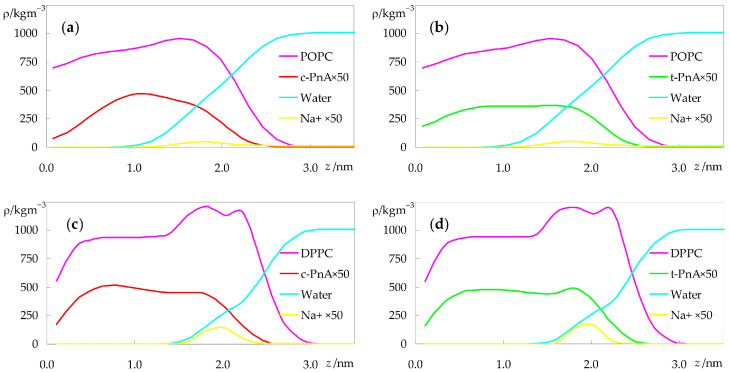
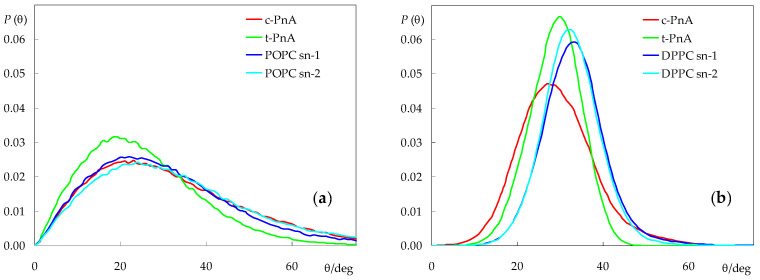
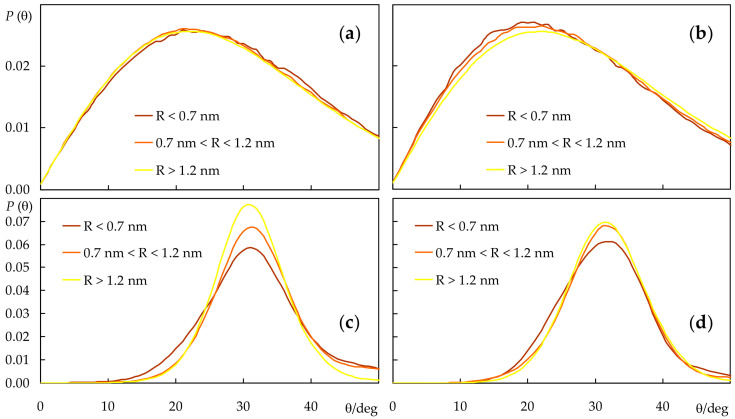
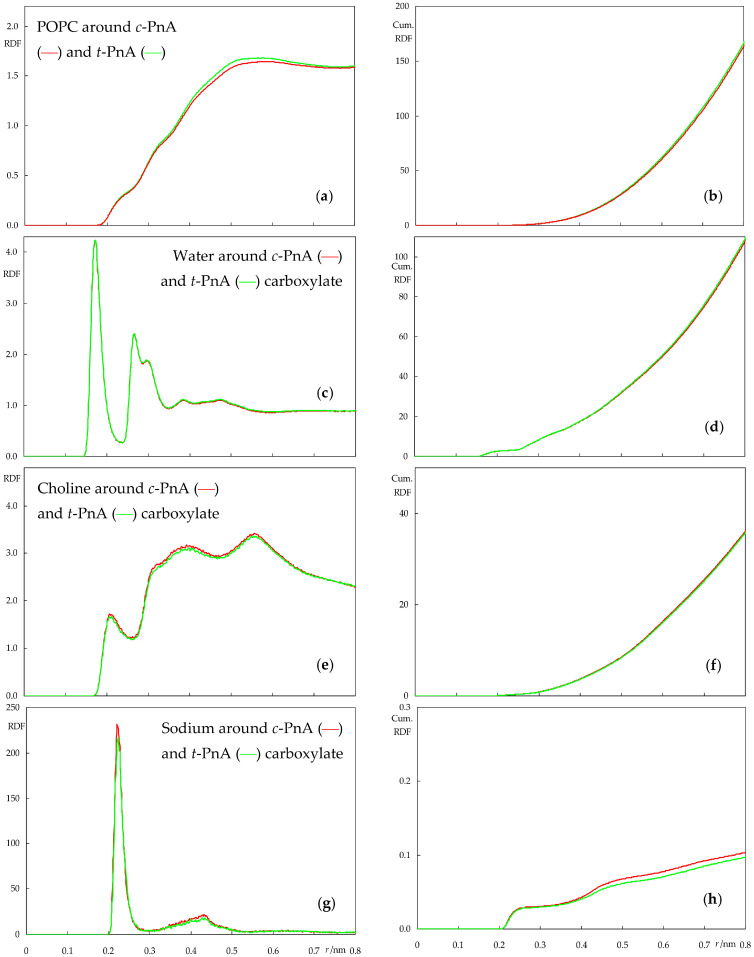
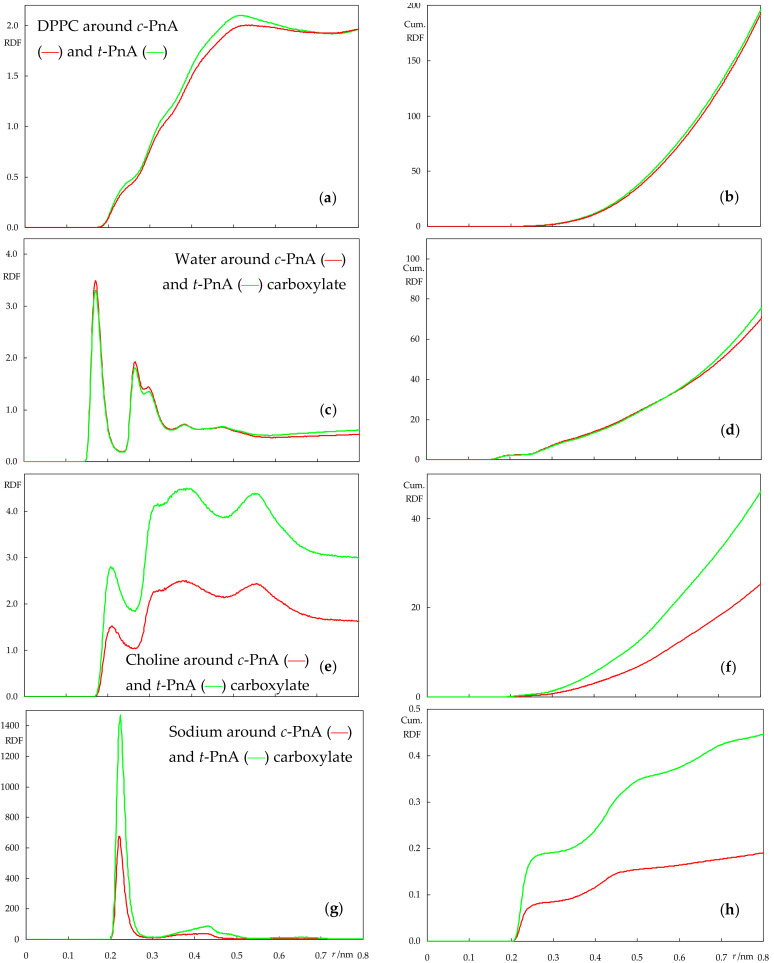
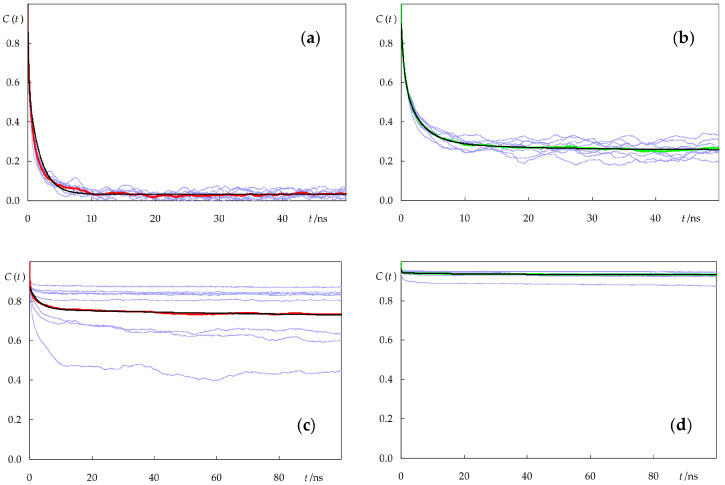
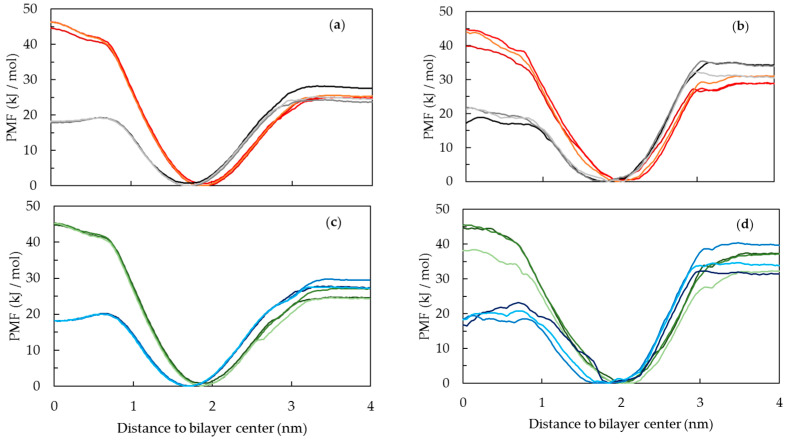
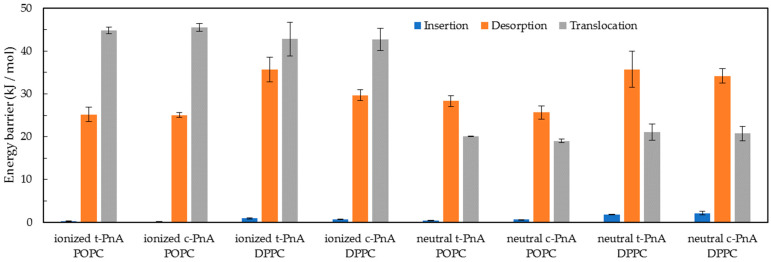
Fluorescence probes are indispensable tools in biochemical and biophysical membrane studies. Most of them possess extrinsic fluorophores, which often constitute a source of uncertainty and potential perturbation to the host system. In this regard, the few available intrinsically fluorescent membrane probes acquire increased importance. Among them, cis- and trans-parinaric acids (c-PnA and t-PnA, respectively) stand out as probes of membrane order and dynamics. These two compounds are long-chained fatty acids, differing solely in the configurations of two double bonds of their conjugated tetraene fluorophore. In this work, we employed all-atom and coarse-grained molecular dynamics simulations to study the behavior of c-PnA and t-PnA in lipid bilayers of 1-palmitoyl-2-oleoyl-sn-glycero-3-phosphocholine (POPC) and 1,2-dipalmitoyl-sn-glycero-3-phosphocholine (DPPC), representative of the liquid disordered and solid ordered lipid phases, respectively. All-atom simulations indicate that the two probes show similar location and orientation in the simulated systems, with the carboxylate facing the water/lipid interface and the tail spanning the membrane leaflet. The two probes establish interactions with the solvent and lipids to a similar degree in POPC. However, the almost linear t-PnA molecules have tighter lipid packing around them, especially in DPPC, where they also interact more with positively charged lipid choline groups. Probably for these reasons, while both probes show similar partition (assessed from computed free energy profiles across bilayers) to POPC, t-PnA clearly partitions more extensively than c-PnA to the gel phase. t-PnA also displays more hindered fluorophore rotation, especially in DPPC. Our results agree very well with experimental fluorescence data from the literature and allow deeper understanding of the behavior of these two reporters of membrane organization.
Keywords: fluorescence spectroscopy; lipid membranes; membrane probe; molecular dynamics simulations.
Conflict of interest statement
The authors declare no conflict of interest. The funders had no role in the design of the study; in the collection, analyses, or interpretation of data; in the writing of the manuscript; or in the decision to publish the results.
Figures
Similar articles
-
Diphenylhexatriene membrane probes DPH and TMA-DPH: A comparative molecular dynamics simulation study.Biochim Biophys Acta. 2016 Nov;1858(11):2647-2661. doi: 10.1016/j.bbamem.2016.07.013. Epub 2016 Jul 27. Biochim Biophys Acta. 2016. PMID: 27475296
-
Biophysical properties of ergosterol-enriched lipid rafts in yeast and tools for their study: characterization of ergosterol/phosphatidylcholine membranes with three fluorescent membrane probes.Chem Phys Lipids. 2012 Jul;165(5):577-88. doi: 10.1016/j.chemphyslip.2012.06.002. Epub 2012 Jun 15. Chem Phys Lipids. 2012. PMID: 22705749
-
Sensing hydration and behavior of pyrene in POPC and POPC/cholesterol bilayers: a molecular dynamics study.Biochim Biophys Acta. 2013 Mar;1828(3):1094-101. doi: 10.1016/j.bbamem.2012.12.014. Epub 2012 Dec 26. Biochim Biophys Acta. 2013. PMID: 23274277
-
The partition of cis-parinaric acid and trans-parinaric acid among aqueous, fluid lipid, and solid lipid phases.Mol Cell Biochem. 1980 Nov 20;32(3):169-77. doi: 10.1007/BF00227444. Mol Cell Biochem. 1980. PMID: 7007869 Review.
-
The Secret Lives of Fluorescent Membrane Probes as Revealed by Molecular Dynamics Simulations.Molecules. 2020 Jul 28;25(15):3424. doi: 10.3390/molecules25153424. Molecules. 2020. PMID: 32731549 Free PMC article. Review.
Cited by
-
Interaction of MRI Contrast Agent [Gd(DOTA)]- with Lipid Membranes: A Molecular Dynamics Study.Inorg Chem. 2024 Jun 17;63(24):10897-10914. doi: 10.1021/acs.inorgchem.4c00972. Epub 2024 May 25. Inorg Chem. 2024. PMID: 38795015 Free PMC article.
-
Flavonoid Glycosides and Phenolic Acids from Inula Oculus-Christi Modulate Membrane Organization and Provide Antioxidant Protection.Molecules. 2025 Jun 25;30(13):2740. doi: 10.3390/molecules30132740. Molecules. 2025. PMID: 40649258 Free PMC article.
-
Interaction of Hoechst 33342 with POPC Membranes at Different pH Values.Molecules. 2023 Jul 25;28(15):5640. doi: 10.3390/molecules28155640. Molecules. 2023. PMID: 37570608 Free PMC article.
-
Interaction of Near-Infrared (NIR)-Light Responsive Probes with Lipid Membranes: A Combined Simulation and Experimental Study.Pharmaceutics. 2023 Jun 30;15(7):1853. doi: 10.3390/pharmaceutics15071853. Pharmaceutics. 2023. PMID: 37514039 Free PMC article.
References
-
- Lakowicz J.R. In: Principles of Fluorescence Spectroscopy. 3rd ed. Lakowicz J.R., editor. Springer; Boston, MA, USA: 2006.
-
- Demchenko A.P., Duportail G., Oncul S., Klymchenko A.S., Mély Y. Methods in Membrane Lipids. Methods in Molecular Biology. Volume 1232. Humana Press; New York, NY, USA: 2015. Introduction to Fluorescence Probing of Biological Membranes; pp. 19–43. - PubMed
-
- Sarmento M.J., Fernandes F. Fluorescence Spectroscopy in Biology-Springer Series on Fluorescence. Springer; Cham, Switzerland: 2022. Choosing the Right Fluorescent Probe; pp. 1–49. - DOI
MeSH terms
Substances
Grants and funding
LinkOut - more resources
Full Text Sources
