Review
. 2023 Mar 2;28(5):2320.
doi: 10.3390/molecules28052320.

Non-Invasive Disease Specific Biomarker Detection Using Infrared Spectroscopy: A Review

Affiliations
Review

Non-Invasive Disease Specific Biomarker Detection Using Infrared Spectroscopy: A Review

Kiran Sankar Maiti. Molecules. .

Abstract

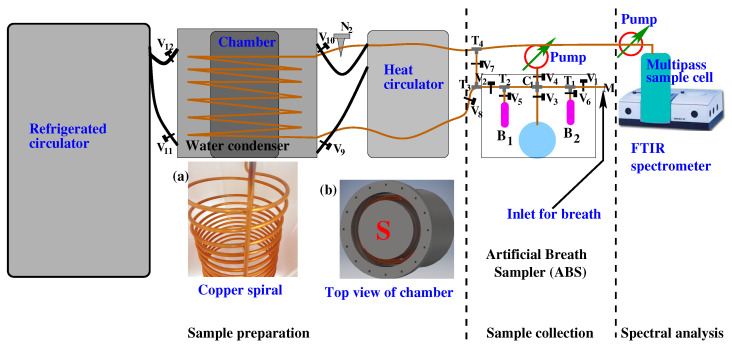
Many life-threatening diseases remain obscure in their early disease stages. Symptoms appear only at the advanced stage when the survival rate is poor. A non-invasive diagnostic tool may be able to identify disease even at the asymptotic stage and save lives. Volatile metabolites-based diagnostics hold a lot of promise to fulfil this demand. Many experimental techniques are being developed to establish a reliable non-invasive diagnostic tool; however, none of them are yet able to fulfil clinicians' demands. Infrared spectroscopy-based gaseous biofluid analysis demonstrated promising results to fulfil clinicians' expectations. The recent development of the standard operating procedure (SOP), sample measurement, and data analysis techniques for infrared spectroscopy are summarized in this review article. It has also outlined the applicability of infrared spectroscopy to identify the specific biomarkers for diseases such as diabetes, acute gastritis caused by bacterial infection, cerebral palsy, and prostate cancer.

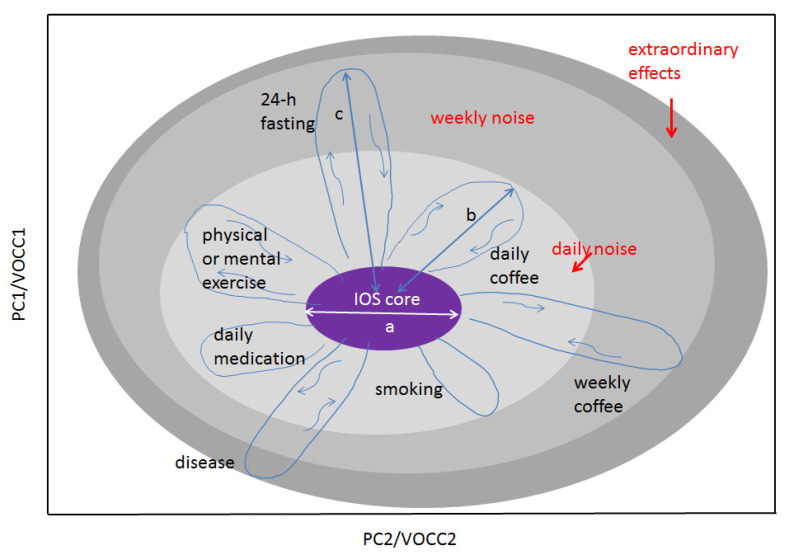
Keywords: biofluid; biomarker; cerebral palsy; helicobacter pylori; infrared spectroscopy; island of stability (IOS); non-invasive diagnostics; prostate cancer; standard operating procedure (SOP); volatile organic compound (VOC).


Conflict of interest statement

The author declares no conflict of interest.

Figures

Figure 1
Figure 1
A schematic diagram of the experimental scheme for gaseous biofluid analysis by infrared spectroscopy. It consists of three major parts: (1) sample collection—in this part, breath or headspace of liquid biofluids is collected; (2) sample preparation—a water-suppressed sample is prepared for infrared spectroscopy when gaseous biofluids are passing through the “Water Condenser”; (3) spectral analysis—water suppressed gaseous sample is collected in a multipass gas cell and measured with an FTIR spectrometer. For details see the Ref. [74].
Figure 2
Figure 2
The effect of physical exercise. (a) Absorption spectra of breath CO2. (b) The dynamics of CO2 concentration during and after jogging. (Ref. [17]).
Figure 3
Figure 3
Effect of coffee for rare and moderate coffee drinkers. (a) The shift of the steady state point in PCA representation and its return for the rare coffee drinker (green) and a moderate drinker (blue). (b) The dynamics of CO2 concentration of a rare coffee drinker in time. Note that the effect reaches its maximum 1 h after the intake and lasts up to 7 h (evaluation). (Ref. [17]).
Figure 4
Figure 4
(a) Variations of isoprene and carbon monoxide after the first meal ending 24 h fasting (left). Horizontal lines are the steady-state levels of the corresponding VOCs. (b) Circadian variations of acetone and isoprene of a healthy person. (Ref. [17]).
Figure 5
Figure 5
The three-dimensional component space representation of VOCs for healthy volunteers. Each enclosed cluster of points represents data from a single volunteer. The cyan colour horizontal plane separated (a) methanogenic and non-methanogenic volunteers and (b) smoker and non-smoker volunteers. (Ref. [17]).
Figure 6
Figure 6
An illustration of the IOS concept for an individual. Any physiological parameters of the body can be presented on this graph. The space of representation can be blind (PC, canonical analysis) or show measurable variables such as VOC concentrations (VOCC) as its axes. Shown: the light grey area represents several daily factors affecting the IOS core and increasing thus the measurable IOS size; the medium grey area, factors affecting IOS on a weekly or monthly scale such as fasting or coffee intake for rare coffee drinkers; the dark grey area, extraordinary effects such as strong stress or disease. There are two main scales making the concept quantifiable: the core size a and the strength of the effect b, c, etc. In the case of VOCC representation, scale parameters a and b are reduced to n and δn. The concept can be extended to many individuals. In this case, two other scales should be used: a and l, where l is the distance between the IOS cores. The higher the space dimensionality, the more cross sections can be found where any two persons will have l > a. (Ref. [17]).
Figure 7
Figure 7
Two-dimensional illustration of different effects affecting the IOS on isoprene-acetone (a) and acetone-methane (b) plots. The same colours in the plots correspond to the same volunteers. Dashed lines are used to visualize the trajectory of the concentration variation of VOCs for different effects. The red colour plot represents the fasting effect and the green trajectory represents circadian variation. (Ref. [17]).
Figure 8
Figure 8
Acetone spectra in a real breath of a healthy volunteer (black line). The red plot is the fitting curve of acetone spectra. (Ref. [74]).
Figure 9
Figure 9
(a) Absorption spectra of breath when the person infected by bacteria. (Ref. [132]). (b) Absorption spectra of the breath of a healthy volunteer (grey) and in bacterial infection (cyan). The red curve is the spectral difference between the above two spectra. The blue plot represents the IR spectrum of methyl butyrate. (Ref. [122]). (c) The recovery dynamics of acute gastritis via QAC. (Ref. [132]).
Figure 10
Figure 10
(a) The average absorption spectra of healthy (red) and CP (blue) volunteers. Dashed lines: fitting curves of three main VOC candidates; (b,c), plot boxes for healthy, CP, and a patient with muscular dystrophy (MD), with the corresponding median values and error bars. (Ref. [141]).
Figure 11
Figure 11
(a) Average absorption spectra of the healthy (red) and prostate cancer (blue) volunteers. The shaded plots are from each individual in respective sample groups. Dashed line: fitting curves of acetic anhydride, identified as biomarker. (b) Average absorption spectra of the prostate cancer (blue), bladder cancer (cyan), and kidney cancer (violate) patients. The molecular structure of acetic anhydride is presented as a ball-and-stick model. (Ref. [158]).
Figure 12
Figure 12
(a) Statistical analysis using PCA method. Ellipses are shown for visualization, with the corresponding centres marked by “x”. (b,c) The box plots of statistical results. (Ref. [158]).

References

    1. Sung H., Ferlay J., Siegel R.L., Laversanne M., Soerjomataram I., Jemal A., Bray F. Global Cancer Statistics 2020: GLOBOCAN Estimates of Incidence and Mortality Worldwide for 36 Cancers in 185 Countries. CA Cancer J. Clin. 2021;71:209–249. doi: 10.3322/caac.21660. - DOI - PubMed
    1. Virani S.S., Alonso A., Aparicio H.J., Benjamin E.J., Bittencourt M.S., Callaway C.W., Carson A.P., Chamberlain A.M., Cheng S., Delling F.N., et al. Heart Disease and Stroke Statistics—2021 Update. Circulation. 2021;143:e254–e743. doi: 10.1161/CIR.0000000000000950. - DOI - PubMed
    1. Tsao C.W., Aday A.W., Almarzooq Z.I., Alonso A., Beaton A.Z., Bittencourt M.S., Boehme A.K., Buxton A.E., Carson A.P., Commodore-Mensah Y., et al. Heart Disease and Stroke Statistics—2022 Update: A Report From the American Heart Association. Circulation. 2022;145:e153–e639. doi: 10.1161/CIR.0000000000001052. - DOI - PubMed
    1. Barnes P.J., Burney P.G.J., Silverman E.K., Celli B.R., Vestbo J., Wedzicha J.A., Wouters E.F.M. Chronic obstructive pulmonary disease. Nat. Rev. Dis. Prim. 2015;1:15076. doi: 10.1038/nrdp.2015.76. - DOI - PubMed
    1. Kitabchi A.E., Umpierrez G.E., Miles J.M., Fisher J.N. Hyperglycemic Crises in Adult Patients with Diabetes. Diabetes Care. 2009;32:1335–1343. doi: 10.2337/dc09-9032. - DOI - PMC - PubMed

LinkOut - more resources