

Yield and Grain Quality of Common Wheat (Triticum aestivum L.) Depending on the Different Farming Systems (Organic vs. Integrated vs. Conventional)
- PMID: 36903883
- PMCID: PMC10005047
- DOI: 10.3390/plants12051022
Yield and Grain Quality of Common Wheat (Triticum aestivum L.) Depending on the Different Farming Systems (Organic vs. Integrated vs. Conventional)
Abstract
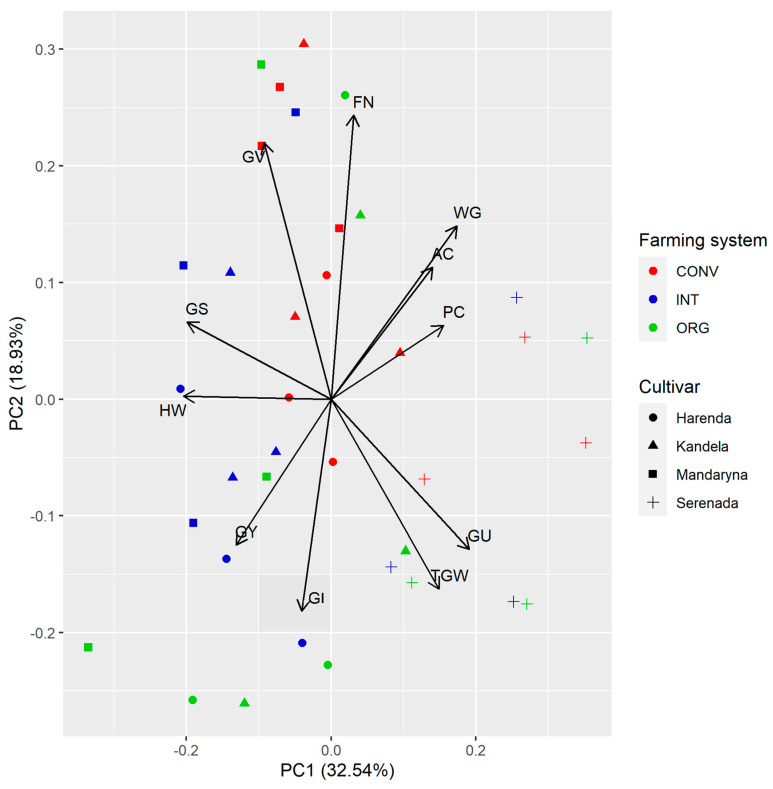
Genotype (cultivar), soil and climatic conditions, the agrotechnology used, and the interaction of the factors mentioned play a key role in the yield and quality of wheat grain. Currently, the European Union recommends the balanced use of mineral fertilisers and plant protection products in agricultural production (integrated production) or the use of only natural production methods (organic production). The aim of the study was to compare the yield and grain quality of four spring common wheat cultivars Harenda, Kandela, Mandaryna, and Serenada, grown under three farming systems: organic (ORG), integrated (INT), and conventional (CONV). A three-year field experiment was conducted between 2019 and 2021 at the Osiny Experimental Station (Poland, 51°27' N; 22°2' E). The results showed that significantly the highest wheat grain yield (GY) was obtained at INT, while the lowest was obtained at ORG. The physicochemical and rheological characteristics of the grain were significantly influenced by the cultivar factor and, with the exception of 1000 grain weight (TGW) and ash content (AC), by the farming system. There were also numerous interactions between the cultivar and farming systems, which suggests different performances of cultivars and, in fact, that some cultivars are better or worse suited to different production systems. The exceptions were protein content (PC) and falling number (FN), which were significantly highest in grain with CONV and lowest in grain with ORG farming systems.
Keywords: 1000 grain weight; cultivars; falling number; farming system; grain yield; protein content; spring wheat; wet gluten.
Conflict of interest statement
The authors declare no conflict of interest.
Figures


References
-
- FAOSTAT. [(accessed on 29 November 2022)]. Available online: https://www.fao.org/
-
- Łaba S., Cacak-Pietrzak G., Łaba R., Sułek A., Szczepański K. Food Losses in Consumer Cereal Production in Poland in the Context of Food Security and Environmental Impact. Agriculture. 2022;12:665. doi: 10.3390/agriculture12050665. - DOI
-
- Biel W., Kazimierska K., Bashutska U. Nutritional value of wheat, triticale, barley and oat grains. Acta Sci. Pol. Zootech. 2020;19:19–28. doi: 10.21005/asp.2020.19.2.03. (In Polish) - DOI
-
- Cacak-Pietrzak G. The use of wheat in various branches of the food industry—Technological requirements. Prz. Zboż. Młyn. 2008;52:11–13. (In Polish)
LinkOut - more resources
Full Text Sources
Research Materials
Miscellaneous
