. 2023 Feb 21;15(5):1077.
doi: 10.3390/nu15051077.

Stimulation of GHRH Neuron Axon Growth by Leptin and Impact of Nutrition during Suckling in Mice

Affiliations

Stimulation of GHRH Neuron Axon Growth by Leptin and Impact of Nutrition during Suckling in Mice

Lyvianne Decourtye-Espiard et al. Nutrients. .

Abstract

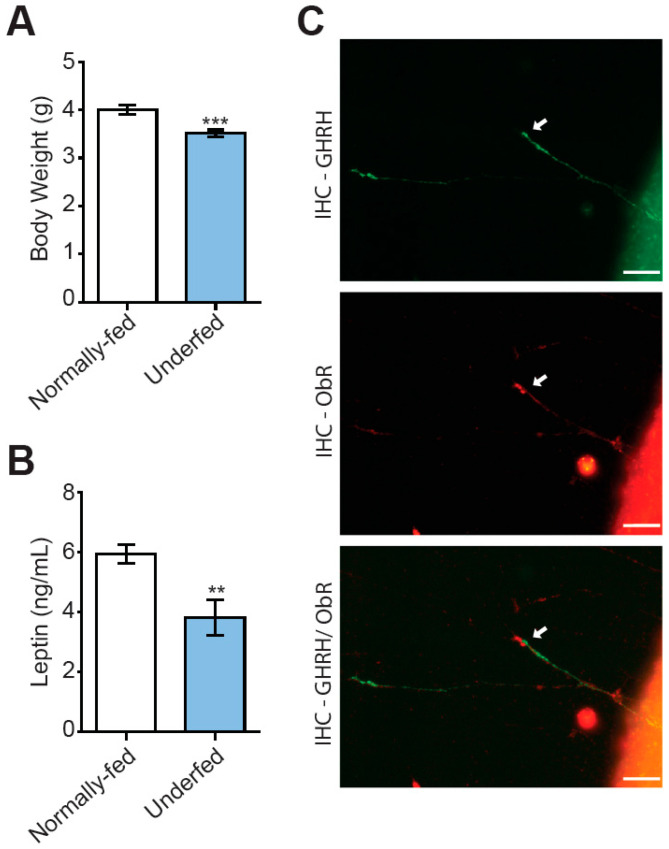
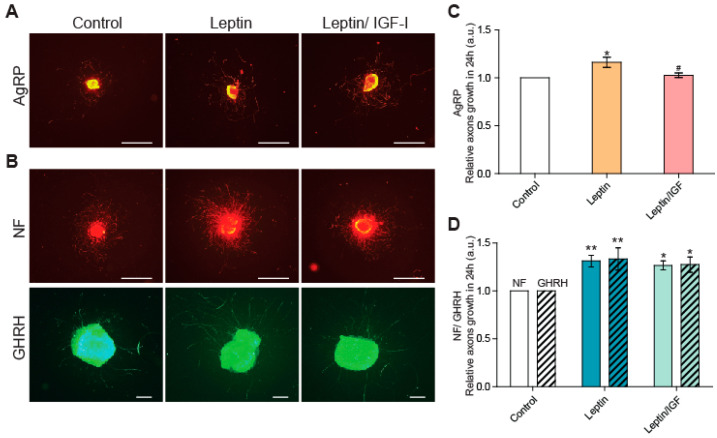
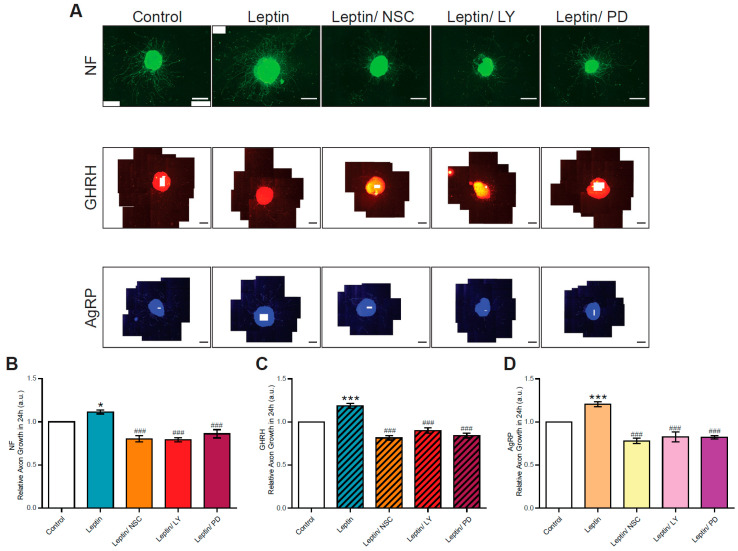
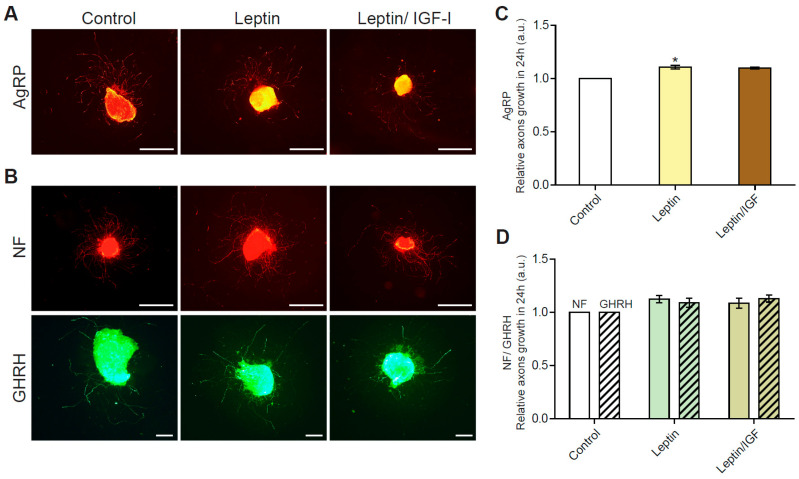
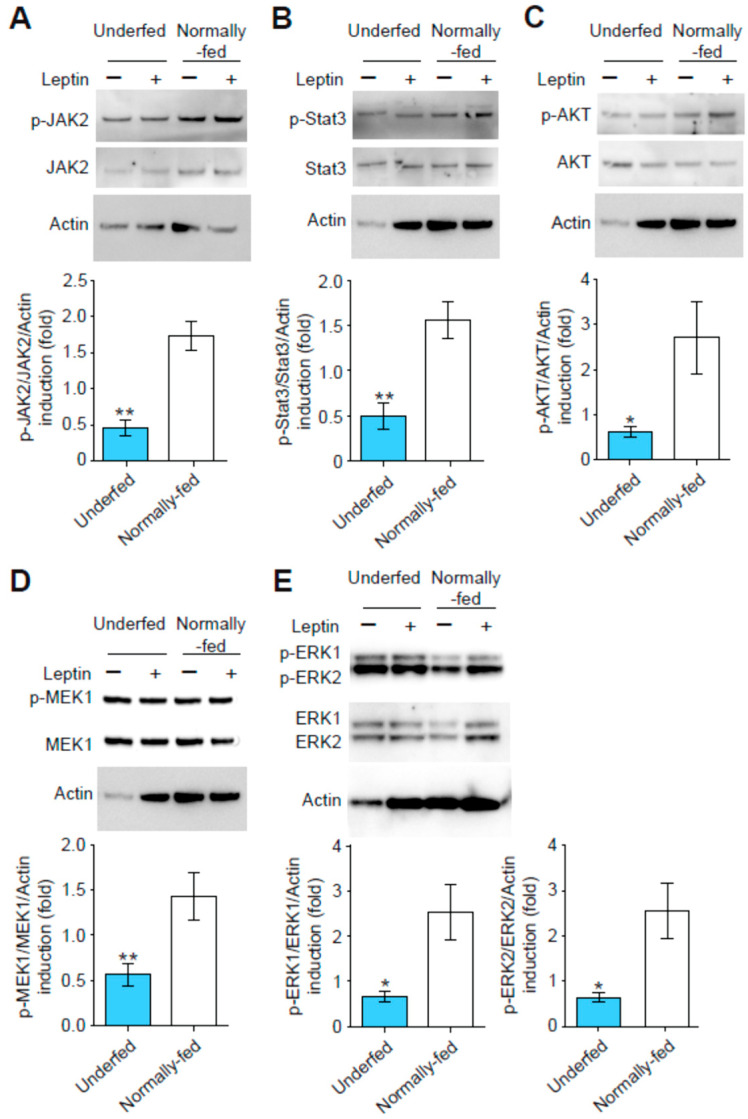
Nutrition during the early postnatal period can program the growth trajectory and adult size. Nutritionally regulated hormones are strongly suspected to be involved in this physiological regulation. Linear growth during the postnatal period is regulated by the neuroendocrine somatotropic axis, whose development is first controlled by GHRH neurons of the hypothalamus. Leptin that is secreted by adipocytes in proportion to fat mass is one of the most widely studied nutritional factors, with a programming effect in the hypothalamus. However, it remains unclear whether leptin stimulates the development of GHRH neurons directly. Using a Ghrh-eGFP mouse model, we show here that leptin can directly stimulate the axonal growth of GHRH neurons in vitro in arcuate explant cultures. Moreover, GHRH neurons in arcuate explants harvested from underfed pups were insensitive to the induction of axonal growth by leptin, whereas AgRP neurons in these explants were responsive to leptin treatment. This insensitivity was associated with altered activating capacities of the three JAK2, AKT and ERK signaling pathways. These results suggest that leptin may be a direct effector of linear growth programming by nutrition, and that the GHRH neuronal subpopulation may display a specific response to leptin in cases of underfeeding.

Keywords: GHRH; hypothalamus; leptin; linear growth; nutrition; somatotropic axis.


Conflict of interest statement

The authors declare no conflict of interest.

Figures

Figure 1
Figure 1
Underfeeding during suckling results in lower body weight and plasma leptin levels. (A) Increases in litter size from six (normally fed, open bars) to nine (underfed, blue bars) pups per dam are associated with a lower body weight in pups, by the age of seven days (n = 32 normally fed pups and 41 underfed pups of both sexes). (B) Underfeeding during suckling was associated with lower plasma levels of leptin at 10 days of age, as determined by ELISA (n = 8 per group). (C) Illustration (40X magnification obtained with a BX43 Olympus fluorescence microscope equipped with a DP73 CCD camera) of a growing axon from an arcuate nucleus explant cultured in vitro, showing that the GHRH+ axon in green (uppermost image) expresses the leptin receptor in red (middle image). A merged image is shown at the bottom (arrow). Scale bars represent 20 µm. Data are presented as the mean ± SEM. Comparisons were performed in Mann–Whitney tests, with ** p < 0.01 and *** p < 0.001.
Figure 2
Figure 2
Leptin stimulates axon growth in GHRH neurons in arcuate nucleus explants from normally fed pups. (A) Illustrative IHC of AgRP neurons from arcuate nucleus explants micro-dissected from one-week-old normally fed pups, in control conditions (left panels), and after stimulation with leptin (middle panels) and with leptin/IGF-1 (right panels). (B) Illustrative images of dual IHC for the axons of total arcuate nucleus neurons labeled with NF (top panels in red) and GHRH neurons labeled with eGFP (bottom panels in green), in the same conditions. Scale bars represent 1000 µm for AgRP+ and NF+ IHC (4X magnification) and 200 µm for GHRH+ IHC (10X magnification), for images from a BX612 Olympus fluorescence microscope equipped with a DP71 CCD camera. (C) Quantification of the growth of AgRP axons after 24 h of stimulation with leptin or leptin/IGF-I relative to control conditions (n = 4 experiments), and (D) of the growth of NF (plain bars) and GHRH (dashed bars) axons (n = 5–7 experiments). Data are presented as the mean ± SEM. Results were compared in a one-way ANOVA with the Newman–Keuls post hoc test (c) or a two-way ANOVA with Bonferroni correction (d), with *: p < 0.05 and **: p < 0.01 vs. control conditions and #: p < 0.05 vs. leptin stimulation.
Figure 3
Figure 3
Signaling pathways involved in the axon growth of arcuate neurons in explants from normally fed pups. (A) Illustrative triple IHC of arcuate nucleus explants from the hypothalamus micro-dissected from one-week-old normally fed pups under control conditions (first panel), and following stimulation with leptin (second panel), leptin/NSC (third panel), leptin/LY (fourth panel) and leptin/PD (fifth panel), with NF (top panels in green), GHRH (middle panels in red) and AgRP (bottom panels in blue). Scale bars represent 100 µm for NF+ IHC (4X magnification) and 200 µm for GHRH+ and AgRP+ IHC (10X magnification), on images obtained with an Olympus BX43 fluorescence microscope equipped with a DP73 CCD camera. Quantifications of the growth of (B) NF (n = 5–9 experiments), (C) GHRH (n = 4–10 experiments) and (D) AgRP (n = 5–10 experiments) axons stimulated for 24 h with leptin alone, or in combination with one of the three inhibitors (NSC_33994, LY_294002 or PD_0325901). Data are presented as the mean ± SEM. Results were analyzed by two-way ANOVA with Bonferroni correction, with *: p < 0.05 and ***: p < 0.001 vs. control conditions and ###: p < 0.001 vs. leptin stimulation.
Figure 4
Figure 4
GHRH neurons from underfed pups are resistant to leptin for the stimulation of axon growth. (A) Illustrative IHC of arcuate nucleus explants from the hypothalamus micro-dissected from one-week-old underfed pups in control conditions (left panel), and after stimulation with leptin alone (middle panel), or with leptin/IGF-1 (right panel), with AgRP axons labeled in orange. (B) Axons from total arcuate nucleus neurons and GHRH neurons labeled by dual-IHC for neurofilament (NF, in red) and eGFP (in green), respectively. Scale bars represent 1000 µm for AgRP+ and NF+ IHC (4X magnification) and 200 µm for GHRH+ IHC (10X magnification), on images from an Olympus BX612 fluorescence microscope equipped with a DP71 CCD camera. (C) Quantification of the growth of AgRP axons stimulated by incubation for 24 h with leptin or leptin/IGF-I, relative to control conditions (n = 5 experiments), and (D) quantification of the growth of NF (plain bars) and GHRH (dashed bars) axons (n = 6 experiments). Data are presented as the mean ± SEM. Results were compared in a one-way ANOVA with the Newman–Keuls post hoc test (c) or in a two-way ANOVA with Bonferroni correction (d), with *: p < 0.05.
Figure 5
Figure 5
Alterations to leptin-stimulated signaling pathways in arcuate nucleus explants from underfed pups. The activation of the three signaling pathways by the exposure of seven-day explants to leptin (+) for 15 min was different in explants from underfed pups (blue bars) and in explants from normally fed pups (open bars). Data are presented as the fold induction of phosphorylated protein/total protein ratios (normalized against actin) for stimulated relative to unstimulated conditions for (A) phosphorylated Jak2/Jak2/actin (n = 5 per group), (B) phosphorylated Stat3/Stat3/actin (n = 5–7 per group), (C) phosphorylated-AKT/AKT/actin (n = 9 per group), (D) phosphorylated MEK1/MEK1/actin (n = 5–6 per group), (E) phosphorylated ERK1/ERK1/actin (left panel) and phosphorylated-ERK2/ERK2/actin (right panel; n = 8 per group). Data are presented as the mean ± SEM, with a Mann–Whitney analysis, with *: p < 0.05, **: p < 0.01.

Similar articles

Cited by

References

    1. Bateson P., Barker D., Clutton-Brock T., Deb D., D’Udine B., Foley R.A., Gluckman P., Godfrey K., Kirkwood T., Lahr M.M., et al. Developmental plasticity and human health. Nature. 2004;430:419–421. doi: 10.1038/nature02725. - DOI - PubMed
    1. Gluckman P.D., Hanson M.A. Living with the past: Evolution, development, and patterns of disease. Science. 2004;305:1733–1736. doi: 10.1126/science.1095292. - DOI - PubMed
    1. Hales C.N., Barker D.J. The thrifty phenotype hypothesis. Br. Med. Bull. 2001;60:5–20. doi: 10.1093/bmb/60.1.5. - DOI - PubMed
    1. Kappeler L., De Magalhaes Filho C., Leneuve P., Xu J., Brunel N., Chatziantoniou C., Le Bouc Y., Holzenberger M. Early postnatal nutrition determines somatotropic function in mice. Endocrinology. 2009;150:314–323. doi: 10.1210/en.2008-0981. - DOI - PubMed
    1. Ong K.K., Emmett P., Northstone K., Golding J., Rogers I., Ness A.R., Wells J.C., Dunger D.B. Infancy weight gain predicts childhood body fat and age at menarche in girls. J. Clin. Endocrinol. Metab. 2009;94:1527–1532. doi: 10.1210/jc.2008-2489. - DOI - PubMed

LinkOut - more resources