. 2023 Feb 24;23(5):2536.
doi: 10.3390/s23052536.

3.6 mW Active-Electrode ECG/ETI Sensor System Using Wideband Low-Noise Instrumentation Amplifier and High Impedance Balanced Current Driver

Affiliations

3.6 mW Active-Electrode ECG/ETI Sensor System Using Wideband Low-Noise Instrumentation Amplifier and High Impedance Balanced Current Driver

Xuan Tien Nguyen et al. Sensors (Basel). .

Abstract

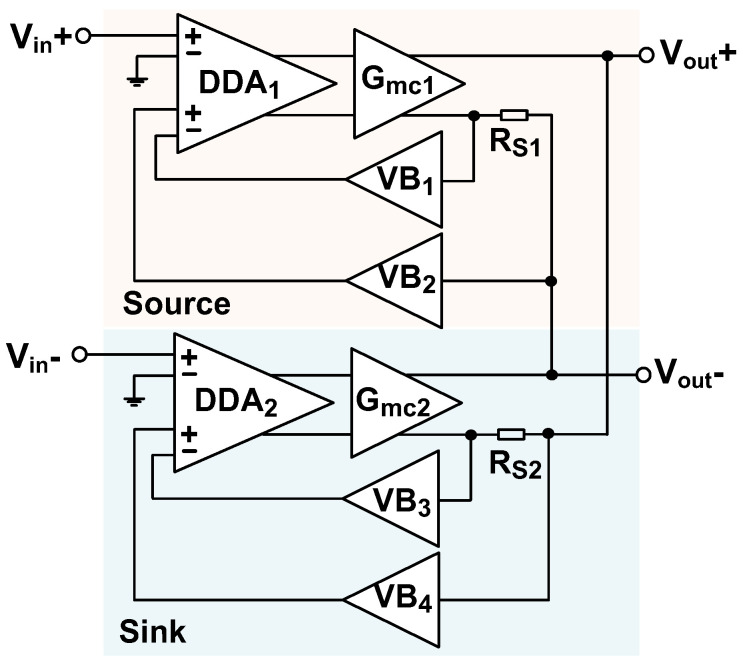
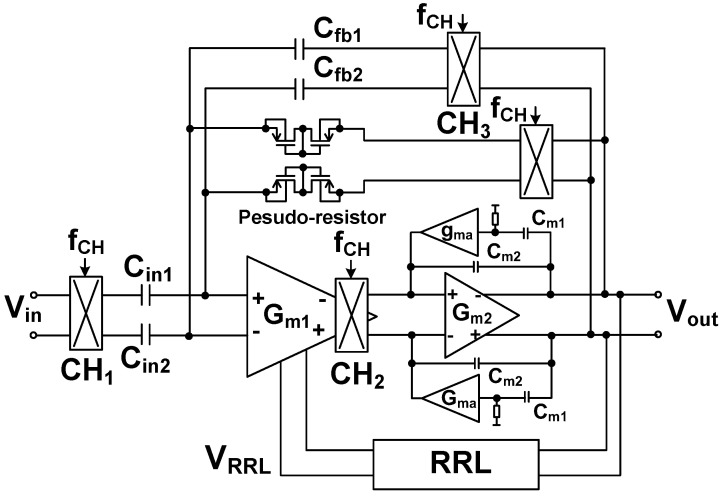
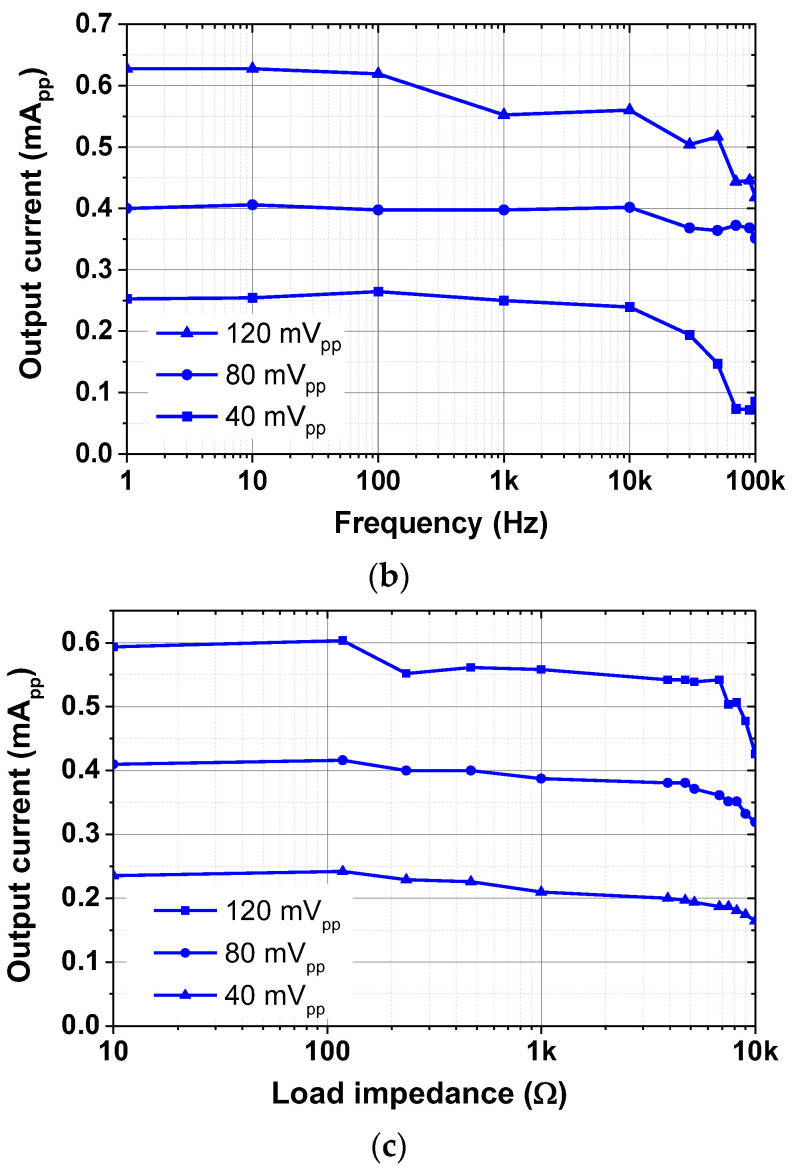
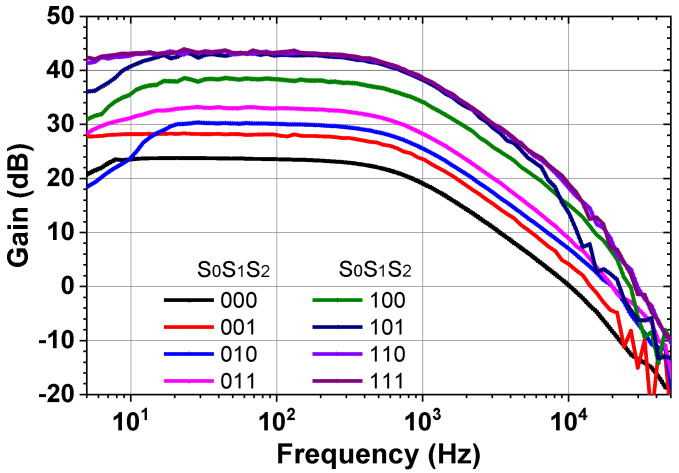
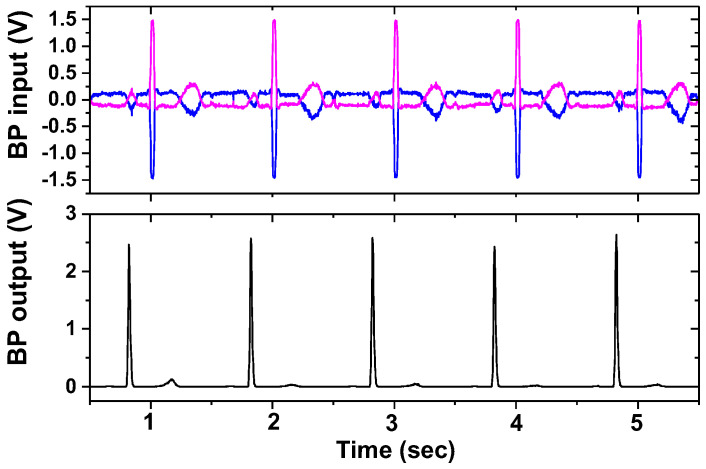
An active electrode (AE) and back-end (BE) integrated system for enhanced electrocardiogram (ECG)/electrode-tissue impedance (ETI) measurement is proposed. The AE consists of a balanced current driver and a preamplifier. To increase the output impedance, the current driver uses a matched current source and sink, which operates under negative feedback. To increase the linear input range, a new source degeneration method is proposed. The preamplifier is realized using a capacitively-coupled instrumentation amplifier (CCIA) with a ripple-reduction loop (RRL). Compared to the traditional Miller compensation, active frequency feedback compensation (AFFC) achieves bandwidth extension using the reduced size of the compensation capacitor. The BE performs three types of signal sensing: ECG, band power (BP), and impedance (IMP) data. The BP channel is used to detect the Q-, R-, and S-wave (QRS) complex in the ECG signal. The IMP channel measures the resistance and reactance of the electrode-tissue. The integrated circuits for the ECG/ETI system are realized in the 180 nm CMOS process and occupy a 1.26 mm2 area. The measured results show that the current driver supplies a relatively high current (>600 μApp) and achieves a high output impedance (1 MΩ at 500 kHz). The ETI system can detect resistance and capacitance in the ranges of 10 mΩ-3 kΩ and 100 nF-100 μF, respectively. The ECG/ETI system consumes 3.6 mW using a single 1.8 V supply.

Keywords: active electrode; bioimpedance; electrocardiogram; integrated circuit; preamplifier.


Conflict of interest statement

The authors declare no conflict of interest.

Figures

Figure 1
Figure 1
Block diagram for the ECG/ETI measurement system.
Figure 2
Figure 2
Schematic of electrode-tissue impedance (ETI) measurement.
Figure 3
Figure 3
Schematic of the balanced current driver.
Figure 4
Figure 4
Source degeneration method using (a) conventional and (b) proposed approach. (c) Comparison of the transfer characteristics.
Figure 5
Figure 5
Schematic of the differential difference amplifier. Circuits for source degeneration is shown in blue color. (W/L)3A,3B = (W/L)6A,6B = 1 μm/0.7 μm. Rb1,b2 is realized using a diode-connected transistor having a size of (W/L) = 0.9 μm /0.7 μm. Cb1,b2 = 0.32 pF.
Figure 6
Figure 6
Schematic of the transconductor.
Figure 7
Figure 7
Schematic of the CCIA using active feedback frequency compensation (AFFC) and ripple-reduction loop (RRL). Cin1,2 = 15 pF, Cfb1,2 = 0.14 pF.
Figure 8
Figure 8
Schematic of the folded-cascode amplifier with common-mode feedback.
Figure 9
Figure 9
Equivalent small-signal circuit of the amplifier for calculating the open-loop gain.
Figure 10
Figure 10
Comparison of the open-loop gain of the amplifier using AFFC and traditional Miller compensation.
Figure 11
Figure 11
Schematic showing the operation of the ripple-reduction loop.
Figure 12
Figure 12
Block diagram of the back-end signal processing IC. The spectrums of the ECG and IMP channels are shown in the inset.
Figure 13
Figure 13
Schematic of the instrumentation amplifier.
Figure 14
Figure 14
Schematic of the PGA.
Figure 15
Figure 15
Schematic of the low-pass filter.
Figure 16
Figure 16
Simulated frequency responses of the low-pass filters.
Figure 17
Figure 17
Microphotograph of (a) current driver, (b) preamplifier, (c) back-end signal processing IC.
Figure 18
Figure 18
Measure transconductances as a function of input voltage.
Figure 19
Figure 19
(a) Schematic of characterizing the output impedance. (b) Measured output current as a function of frequency under different inputs. (c) Measured output current as a function of load impedance under different inputs.
Figure 19
Figure 19
(a) Schematic of characterizing the output impedance. (b) Measured output current as a function of frequency under different inputs. (c) Measured output current as a function of load impedance under different inputs.
Figure 20
Figure 20
(a) Measured gain of the CCIA, (b) measured input-referred noise voltage spectral density of the CCIA for the active electrode.
Figure 20
Figure 20
(a) Measured gain of the CCIA, (b) measured input-referred noise voltage spectral density of the CCIA for the active electrode.
Figure 21
Figure 21
Measured frequency response of the ECG channel for eight gain settings.
Figure 22
Figure 22
Measured input-referred noise voltage spectral density of the ECG channel.
Figure 23
Figure 23
Measured amplified ECG signal.
Figure 24
Figure 24
Measured result of the impedance channel. The current driver injects input at three frequencies (1 kHz, 4 kHz, and 5 kHz). The demodulation is performed at 5 kHz.
Figure 25
Figure 25
Measured range of the ETI system for (a) differential resistance and (b) differential capacitance. The values of the injected current are also shown.
Figure 26
Figure 26
Measured result of band power channels. Positive and negative inputs are indicated with blue and red lines, and output is indicated with black lines.
Figure 27
Figure 27
Measured waveforms of the ECG and IMP channels.
Figure 28
Figure 28
Flowchart of the ECG peak detection algorithm.
Figure 29
Figure 29
Waveforms of the ECG signal and detected peaks.

References

    1. Halter R.J., Hartov A., Heaney J.A., Paulsen K.D., Schned A.R. Electrical impedance spectroscopy of the human prostate. IEEE Trans. Biomed. Eng. 2007;54:1321–1327. doi: 10.1109/TBME.2007.897331. - DOI - PubMed
    1. Moganti G.L.K., Siva Praneeth V.N., Vanjari S.R.K. A hybrid bipolar active charge balancing technique with adaptive electrode tissue interface (ETI) impedance variations for facial paralysis patients. Sensors. 2022;22:1756. doi: 10.3390/s22051756. - DOI - PMC - PubMed
    1. Marcôndes D.W.C., Paterno A.S., Bertemes-Filho P. Parasitic effects on electrical bioimpedance systems: Critical review. Sensors. 2022;22:8705. doi: 10.3390/s22228705. - DOI - PMC - PubMed
    1. Chi Y.M., Jung T.P., Cauwenberghs G. Dry-contact and noncontact biopotential electrodes: Methodological review. IEEE Rev. Biomed. Eng. 2010;3:106–119. doi: 10.1109/RBME.2010.2084078. - DOI - PubMed
    1. Matthews R., Turner P.J., McDonald N.J., Ermolaev K., Mc Manus T., Shelby R.A., Steindorf M. Real time workload classification from an ambulatory wireless EEG system using hybrid EEG electrodes; Proceedings of the 2008 30th Annual International Conference of the IEEE Engineering in Medicine and Biology Society; Vancouver, BC, Canada. 20–25 August 2008; pp. 5871–5875. - PubMed

LinkOut - more resources