. 2023 Feb 25;23(5):2571.
doi: 10.3390/s23052571.

The Loss-Function of KNL1 Causes Oligospermia and Asthenospermia in Mice by Affecting the Assembly and Separation of the Spindle through Flow Cytometry and Immunofluorescence

Affiliations

The Loss-Function of KNL1 Causes Oligospermia and Asthenospermia in Mice by Affecting the Assembly and Separation of the Spindle through Flow Cytometry and Immunofluorescence

Yuwei Zhao et al. Sensors (Basel). .

Abstract

KNL1 (kinetochore scaffold 1) has attracted much attention as one of the assembly elements of the outer kinetochore, and the functions of its different domains have been gradually revealed, most of which are associated with cancers, but few links have been made between KNL1 and male fertility. Here, we first linked KNL1 to male reproductive health and the loss-function of KNL1 resulted in oligospermia and asthenospermia in mice (an 86.5% decrease in total sperm number and an 82.4% increase in static sperm number, respectively) through CASA (computer-aided sperm analysis). Moreover, we introduced an ingenious method to pinpoint the abnormal stage in the spermatogenic cycle using flow cytometry combined with immunofluorescence. Results showed that 49.5% haploid sperm was reduced and 53.2% diploid sperm was increased after the function of KNL1 was lost. Spermatocytes arrest was identified at the meiotic prophase I of spermatogenesis, which was induced by the abnormal assembly and separation of the spindle. In conclusion, we established an association between KNL1 and male fertility, providing a guide for future genetic counseling regarding oligospermia and asthenospermia, and a powerful method for further exploring spermatogenic dysfunction by utilizing flow cytometry and immunofluorescence.

Keywords: KNL1; asthenospermia; flow cytometry; immunofluorescence staining; oligospermia.


Conflict of interest statement

The authors declare no conflict of interest.

Figures

Figure 1
Figure 1
Log2 TPM values in different spermatogenic stages. A1 represents the type A1 spermatogonia. In represents the Intermediate spermatogonia. BS represents the Type B spermatogonia S phase. BG2 represents the Type B spermatogonia G2M phase. G1 represents the G1 phase of the preleptotene spermatocyte stage. ePL represents the early phase of the preleptotene spermatocyte stage. mPL represents the medium-term phase of the preleptotene spermatocyte stage. IPL represents the late phase of the preleptotene spermatocyte stage. L represents the leptotene stage of meiosis. Z represents the even line stage of meiosis. eP represents the early pachytene of meiosis. mP represents the metaphase pachytene of meiosis. IP represents the late pachytene of meiosis. D represents the double-line stage of meiosis. MI represents the first meiotic division. MII represents the second meiotic division. RS1–2 represents the round spermatid stage 1–2. RS3–4 represents the round spermatid stage 3–4. RS5–6 represents the round spermatid stage 5–6. RS7–8 represents the round spermatid stage 7–8.
Figure 2
Figure 2
Operation diagram and the loss-function of KNL1 to the testicle phenotype. (A) Surgical model of injecting spermatogenic tubules in mice. a is the epididymis; b is the testis; c is the injection site in spermatogenic tubules. (B) The testicular phenotype of KNL1-Ctrl mice and KNL1-60 µg mice. bar = 1 mm. (C) The degree of difference between the KNL1-Ctrl mice and KNL1-60 µg mice. Data were presented as mean percentages (mean ± SEM) of at least three independent measurements. Asterisk denotes statistical difference level of significance (*, p < 0.05; ns > 0.05).
Figure 3
Figure 3
HE staining sections of loss-function of KNL1 on the phenotype of male mice. (A) The HE staining of testis sections between KNL1-Ctrl mice and KNL1-60 µg mice. The right represents the magnified portion of the white dashed box in the left line. Bar = 20 µm (B) The HE staining of epididymis sections between KNL1-Ctrl mice and KNL1-60 µg mice. The left is a 200× magnification and the right is a 400× magnification bar = 50 µm. (C) HE staining section of sperm between KNL1-Ctrl and KNL1-60 µg mice. The right represents the magnified portion of the white dashed box in the left line. Bar = 2 µm.
Figure 4
Figure 4
The CASA data of KNL1-Ctrl and KNL1-60 µg Group mice. (A) CASA total detection of KNL1-Ctrl and KNL1-60 µg. (B) CASA progressive detection of KNL1-Ctrl and KNL1-60 µg. (C) CASA motile detection of KNL1-Ctrl and KNL1-60 µg. (D) CASA static detection of KNL1-Ctrl and KNL1-60 µg. Asterisk denotes statistical difference level of significance (**, p < 0.01; ***, p < 0.001, ns > 0.05).
Figure 5
Figure 5
Effects of loss-function of KNL1 on acrosome and apoptosis. (A) The PNA immunofluorescence of a section of the testicle. Testis was immunostained with anti-PNA (green). Merge was DAPI (blue) and PNA (green). The top is KNL1-Ctrl mice and the bottom is KNL1-60 µg mice. Bar = 50 µm. (B) Mean immunofluorescence intensity of PNA between KNL1-Ctrl mice and KNL1-60 µg mice. (C) The TUNEL assay of a section of the testicle. The FITC immunofluorescence of a section of the testicle. Testis was immunostained with anti-FITC (green). Merge was DAPI (blue) and FITC (green). The top is KNL1-Ctrl mice and the bottom is KNL1-60 µg mice. Bar = 50 µm. (D) Mean immunofluorescence intensity of TUNEL between KNL1-Ctrl mice and KNL1-60 µg mice. All data were at least measured by three independent experiments. Asterisk denotes statistical difference level of significance (****, p < 0.0001, ns > 0.05).
Figure 6
Figure 6
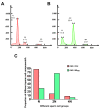
Effects of loss-function of KNL1 on the spermatogenic process by FCM. (A) The FCM results of KNL1-Ctrl mice. (B) The FCM results of KNL1-60 µg mice. N, 2N, and 4N represents a different period of sperm in spermatogenesis (A,B). (C) The percentage of sperm with different ploidy. All data were at least measured by three independent experiments.
Figure 7
Figure 7
Immunofluorescence of four markers between KNL1-Ctrl and KNL1-60 µg. (A) GFRα1 fluorescent images of testis in KNL1-Ctrl and KNL1-60 µg. Testis was immunostained with anti-GFRα1 (red). Merge was DAPI (blue) and GFRα1 (red). (B) PLZF fluorescent images of testis in KNL1-Ctrl and KNL1-60 µg. Testis was immunostained with anti-PLZF (green). Merge was DAPI (blue) and PLZF (green). (C) γH2AX fluorescent images of testis in KNL1-Ctrl and KNL1-60 µg. Testis was immunostained with anti-γH2AX (green). Merge was DAPI (blue) and γH2AX (green). (D) SYCP3 fluorescent images of testis in KNL1-Ctrl and KNL1-60 µg. Testis was immunostained with anti-SYCP3 (red). Merge was DAPI (blue) and SYCP3 (red). (EH) Data were presented as mean percentages (mean ± SEM) of at least three independent measurements. Asterisk denotes statistical difference at a p (**) < 0.0 1, p (****) < 0.0001 level of significance. Bar = 50 µm.
Figure 8
Figure 8
Effect of depletion of KNL1 on GC-2 cell separation. Fluorescent images of GC-2 cells interfered with by KNL1 siRNA. GC-2 cells were immunostained with anti-α-tubulin (red) and DAPI (blue). Merge was DAPI (blue) and anti-α-tubulin (red). The right represents the magnified portion of the white dashed box in the middle. The yellow arrow shows the cells that divide unequally. Bar = 50 µm.
Figure 9
Figure 9
Effect of depletion of KNL1 on GC-2 cell spindle assembly and chromosome. (A,B) The abnormal spindle after interfering with KNL1. Asterisks represent different spindle poles. (C,D) The abnormal chromosome arrangements after interfering with KNL1. Yellow arrows represent chromosomes not aligned on the equatorial plate, red arrows represent lagged chromosomes. Green is α-tubulin, and blue is DAPI. Bar = 5 µm.

References

    1. Mora-Bermúdez F., Kanis P., Macak D., Peters J., Naumann R., Xing L., Sarov M., Winkler S., Oegema C.E., Haffner C., et al. Longer metaphase and fewer chromosome segregation errors in modern human than Neanderthal brain development. Sci. Adv. 2022;8:eabn7702. doi: 10.1126/sciadv.abn7702. - DOI - PMC - PubMed
    1. Lara-Gonzalez P., Pines J., Desai A. Spindle assembly checkpoint activation and silencing at kinetochores. Semin. Cell Dev. Biol. 2021;117:86–98. doi: 10.1016/j.semcdb.2021.06.009. - DOI - PMC - PubMed
    1. Claeys Bouuaert C., Pu S., Wang J., Oger C., Daccache D., Xie W., Patel D.J., Keeney S. DNA-driven condensation assembles the meiotic DNA break machinery. Nature. 2021;592:144–149. doi: 10.1038/s41586-021-03374-w. - DOI - PMC - PubMed
    1. Stiff T., Echegaray-Iturra F.R., Pink H.J., Herbert A., Reyes-Aldasoro C.C., Hochegger H. Prophase-Specific Perinuclear Actin Coordinates Centrosome Separation and Positioning to Ensure Accurate Chromosome Segregation. Cell Rep. 2020;31:107681. doi: 10.1016/j.celrep.2020.107681. - DOI - PMC - PubMed
    1. Hinshaw S.M., Harrison S.C. Kinetochore Function from the Bottom Up. Trends Cell Biol. 2018;28:22–33. doi: 10.1016/j.tcb.2017.09.002. - DOI - PubMed

Substances

LinkOut - more resources