. 2023 Apr 18;122(8):1445-1458.
doi: 10.1016/j.bpj.2023.03.010. Epub 2023 Mar 10.

In silico modeling of patient-specific blood rheology in type 2 diabetes mellitus

Affiliations

In silico modeling of patient-specific blood rheology in type 2 diabetes mellitus

Keqin Han et al. Biophys J. .

Abstract

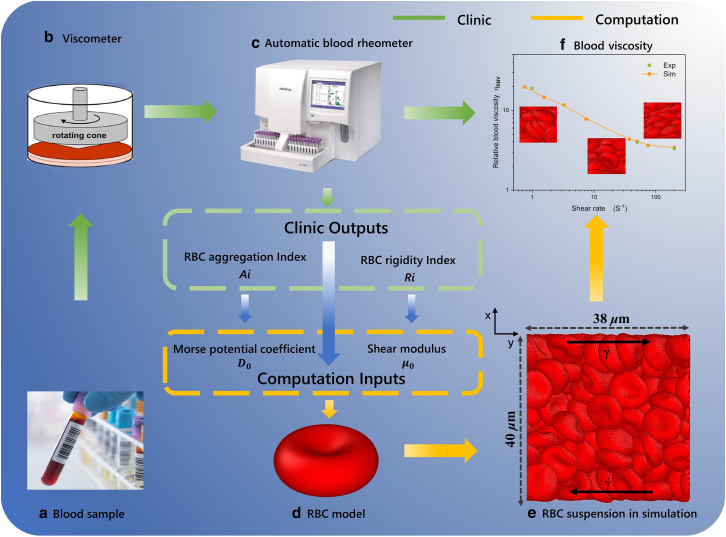
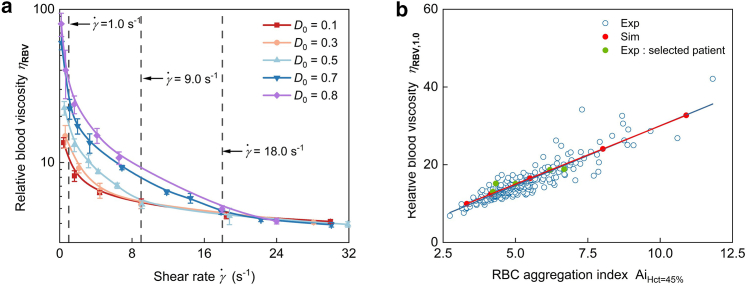
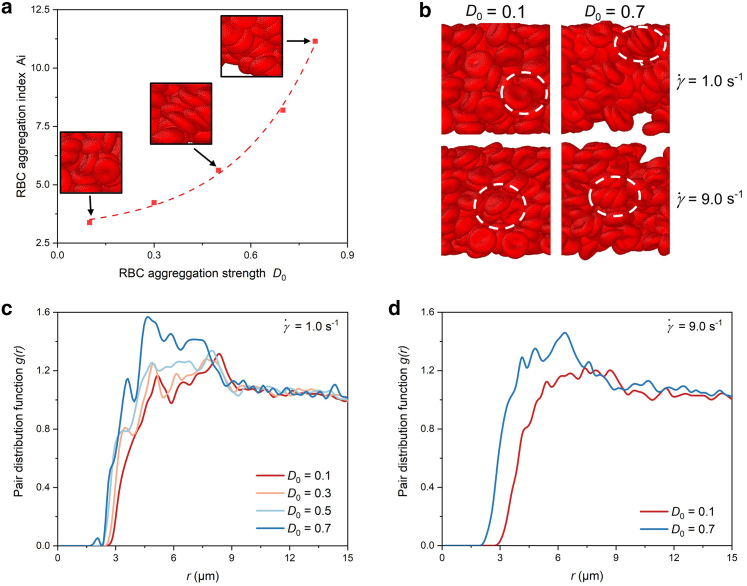
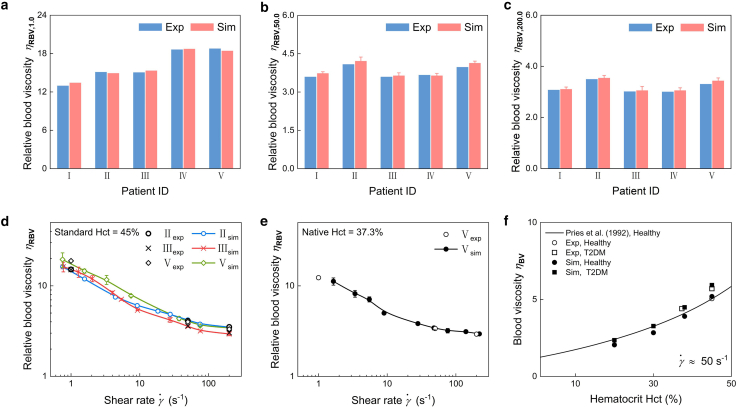
Increased blood viscosity in type 2 diabetes mellitus (T2DM) is a risk factor for the development of insulin resistance and diabetes-related vascular complications; however, individuals with T2DM exhibit heterogeneous hemorheological properties, including cell deformation and aggregation. Using a multiscale red blood cell (RBC) model with key parameters derived from patient-specific data, we present a computational study of the rheological properties of blood from individual patients with T2DM. Specifically, one key model parameter, which determines the shear stiffness of the RBC membrane (μ) is informed by the high-shear-rate blood viscosity of patients with T2DM. At the same time, the other, which contributes to the strength of the RBC aggregation interaction (D0), is derived from the low-shear-rate blood viscosity of patients with T2DM. The T2DM RBC suspensions are simulated at different shear rates, and the predicted blood viscosity is compared with clinical laboratory-measured data. The results show that the blood viscosity obtained from clinical laboratories and computational simulations are in agreement at both low and high shear rates. These quantitative simulation results demonstrate that the patient-specific model has truly learned the rheological behavior of T2DM blood by unifying the mechanical and aggregation factors of the RBCs, which provides an effective way to extract quantitative predictions of the rheological properties of the blood of individual patients with T2DM.


Conflict of interest statement

Declaration of interests The authors declare no competing interests.

Figures

Figure 1
Figure 1
Patient-specific computational framework for T2DM blood viscosity modeling. The green arrows point to the processes of measuring hemorheological characteristics of blood samples in clinical laboratories: (a) blood sample collection; (b) blood viscosity measurement with rotational viscometer; and (c) hemorheological and hemodynamic analysis (e.g., RBC rigidity index [Ri] and RBC aggregation index [Ai]) with automatic blood rheometer. The yellow arrows show the processes of patient-specific modeling of blood rheology: (d) particle-based RBC model that invokes key parameters (RBC shear modulus [μ] and aggregation strength [D0]) derived from patient-specific data (RBC Ri and RBC Ai parameters); (e) particle-based simulation of RBC suspension in plane Couette flow; and (f) blood viscosity obtained in the experiment (solid green squares) and simulation (solid yellow circles, solid line). To see this figure in color, go online.
Figure 2
Figure 2
Functional dependence of blood viscosity on RBC deformability and aggregation. (a) Dependence of ηBV,200 on the RBC Ri parameter of T2DM blood samples at their native Hct values under high shear rate γ˙ = 200 s−1, and (b) dependence of ηBV,1 on the RBC Ai parameter of T2DM blood samples at their native Hct values under low shear rate γ˙ = 1 s−1. Reproduced from (70) with permission of Frontiers Media SA.
Figure 3
Figure 3
Quantification of the effect of RBC deformation on blood viscosity. (a) Dependence of ηRBV,200 on shear modulus μ at Hct = 45% at high shear rate γ˙ = 200 s−1; the data points shown in the shear modulus range of 2–18 μN/m are calculated from T2DM RBC suspensions, and the data point shown in the range of 540–560 μN/m is from hardened RBC suspension. (b) Dependence of ηRBV,200 on the corrected RBC parameter RiHct=45% at Hct = 45% under high shear rate γ˙ = 200 s−1 obtained in clinical laboratories and computational simulations. Empty blue circles, clinical laboratory data; solid red circles and line, simulation; solid green circles, selected patients with T2DM as listed in Table 2. To see this figure in color, go online.
Figure 4
Figure 4
Quantification of the effect of RBC aggregation on blood viscosity. (a) Dependence of ηRBV with respect to imposed shear rate γ˙ under different aggregation strength D0 at the standardized Hct level of 45%, and (b) dependence of ηRBV,1 with respect to corrected RBC AiHct=45% parameter at the standardized Hct level of 45% under low shear rate γ˙ = 1 s−1 obtained in clinical laboratories and computational simulations. Empty blue circles and line, clinical laboratory data; solid red circles and line, simulation; solid green circles, selected patients with T2DM in the study of subsection D. To see this figure in color, go online.
Figure 5
Figure 5
Altered size and microstructure of RBC aggregate at different values of aggregate strength D0 at low shear rates. (a) Functional dependence of the RBC Ai parameter on the aggregate strength D0. (b) Representative snapshots of the RBC rouleaux pattern at different aggregate strengths D0 under two different shear rates γ˙. White circles highlight the microstructures of the RBC aggregates. (c and d) Calculated pair distribution function g(r) at shear rate γ˙ = (c) 1 and (d) 9 s−1. To see this figure in color, go online.
Figure 6
Figure 6
Shear-rate-dependent blood viscosity of individual patients with T2DM obtained from clinical laboratory measurements and computational simulations. (ac) Predicted ηRBV of the five representative patients with T2DM at the standardized Hct level of 45% at shear rate γ˙ = (a) 1, (b) 50, and (c) 200 s−1. (d) Functional dependence of ηRBV versus shear rate γ˙ for selected patients II, III, and V at the standardized Hct level of 45%. (e) Functional dependence of ηRBV versus shear rate γ˙ for selected patient V at its native Hct level of 37.3%. Error bars represent the standard deviation of the simulation data set. (f) Functional dependence of ηBV on blood Hct level at a fixed shear rate of γ˙ 50 s−1. The black curve is obtained from the theoretical solution described by Pries et al. (87). Experimental and simulation points are as follows: empty black circle, experimental data for healthy blood; empty black squares, experimental data for T2DM blood; solid black circles, simulation data for healthy RBC suspension; solid black squares, simulation data for T2DM RBC suspension. To see this figure in color, go online.
Figure 7
Figure 7
Ranges of variation of several selected parameters to vary the fit by 10% of (a) calculated low-shear-rate blood viscosity at γ˙ = 1 s−1(ηRBV,1) and (b) high-shear-rate blood viscosity at γ˙ = 200 s−1(ηRBV,200). To see this figure in color, go online.

References

    1. Secomb T.W. Blood flow in the microcirculation. Annu. Rev. Fluid Mech. 2017;49:443–461.
    1. Baskurt O.K., Meiselman H.J. Blood rheology and hemodynamics. Semin. Thromb. Hemost. 2003;29:435–450. - PubMed
    1. Barshtein G., Arbell D., Yedgar S. Hemodynamic functionality of transfused red blood cells in the microcirculation of blood recipients. Front. Physiol. 2018;9:41. - PMC - PubMed
    1. Fedosov D.A., Dao M., et al. Suresh S. Computational biorheology of human blood flow in health and disease. Ann. Biomed. Eng. 2014;42:368–387. - PMC - PubMed
    1. Gnasso A., Cacia M., et al. Irace C. Influence of acute reduction of blood viscosity on endothelial function. Clin. Hemorheol. Microcirc. 2019;72:239–245. - PubMed

Publication types