. 2023 May 29;35(6):1848-1867.
doi: 10.1093/plcell/koad075.

The translational landscape of bread wheat during grain development

Affiliations

The translational landscape of bread wheat during grain development

Yiwen Guo et al. Plant Cell. .

Abstract

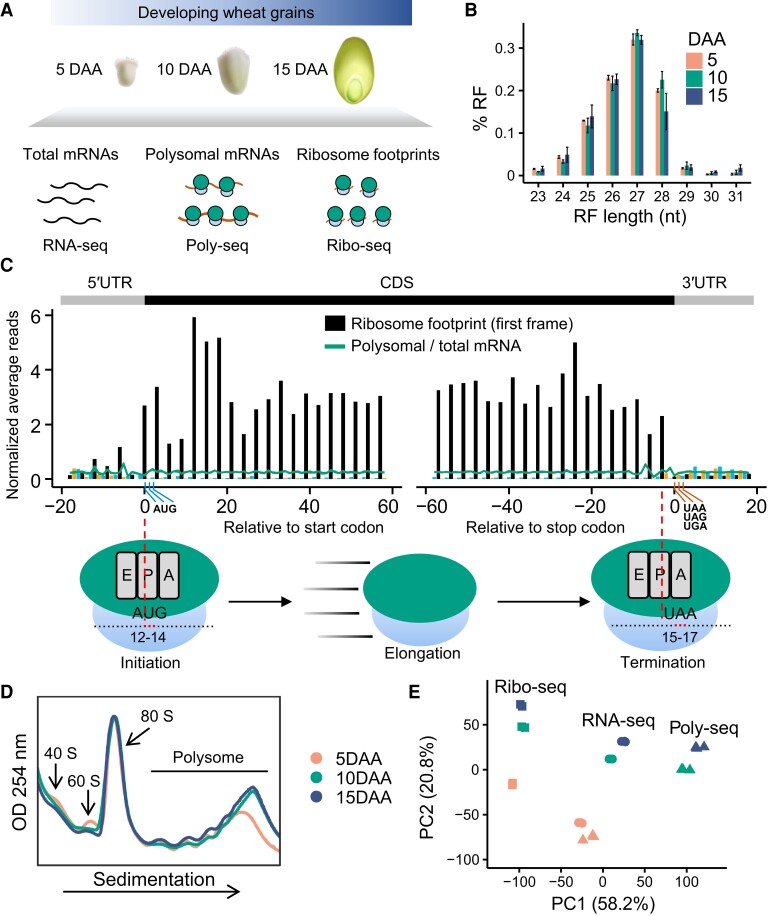
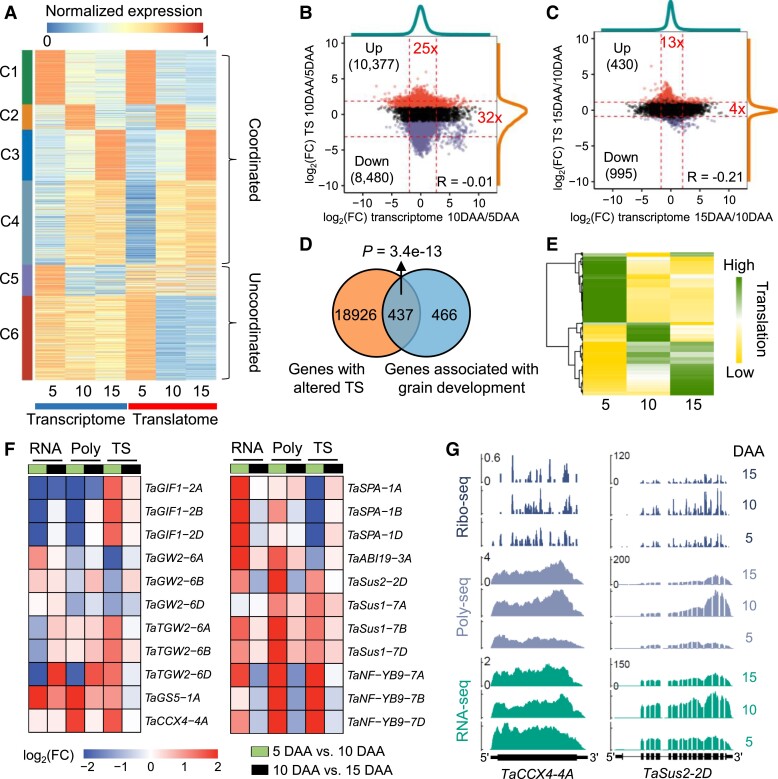
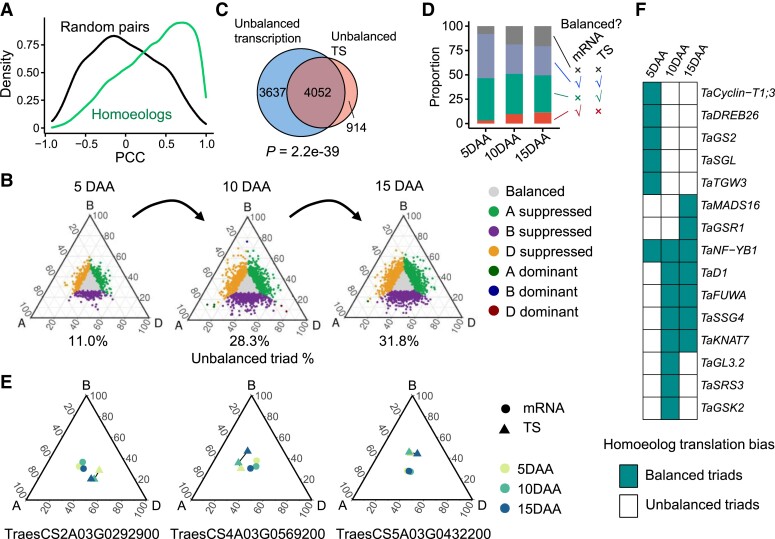
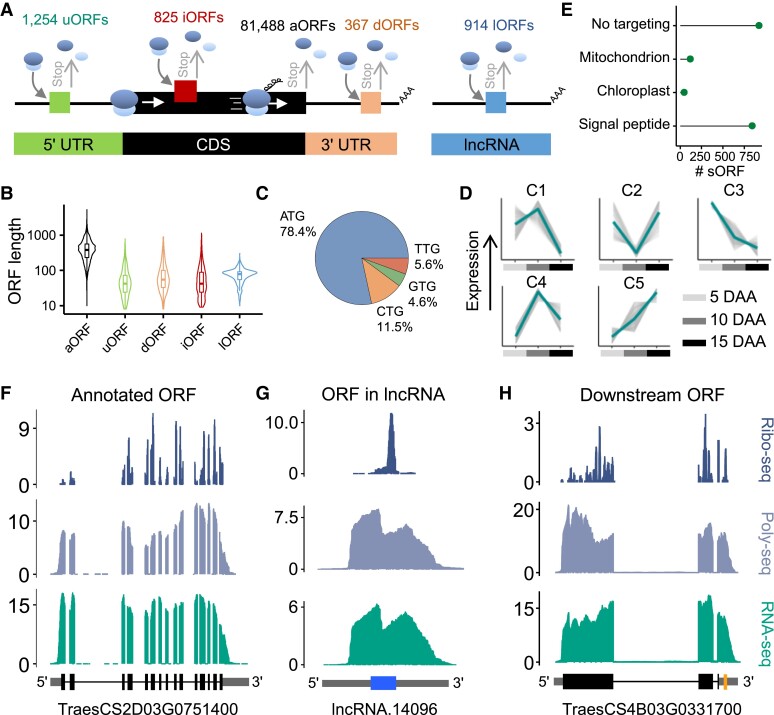
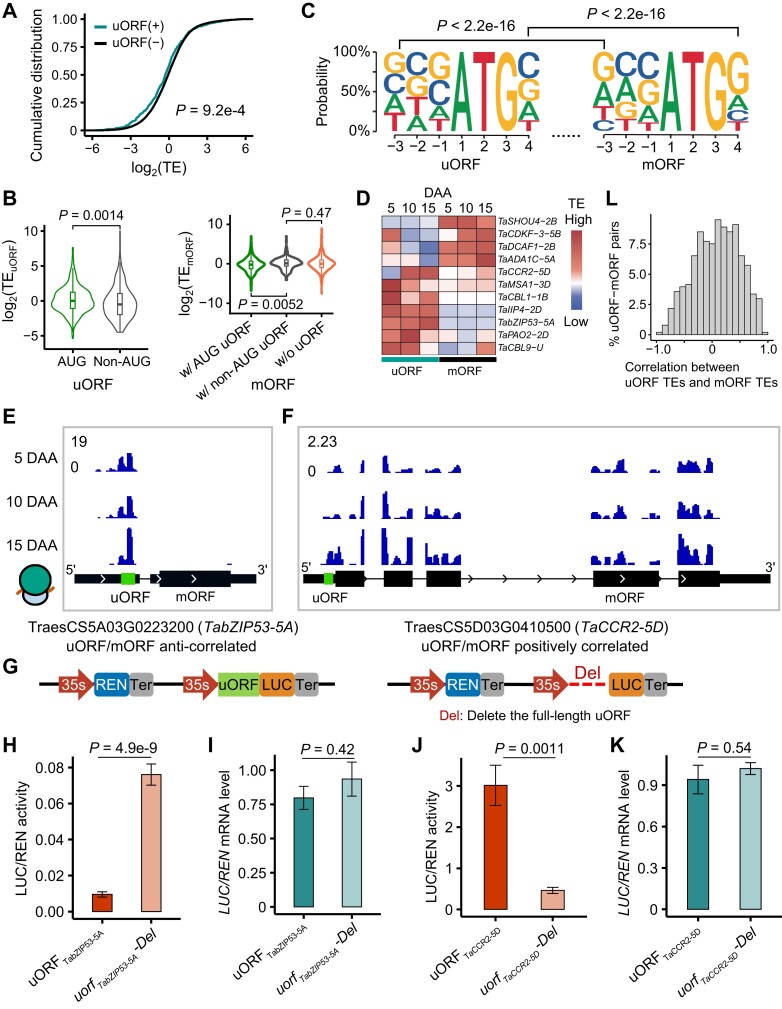
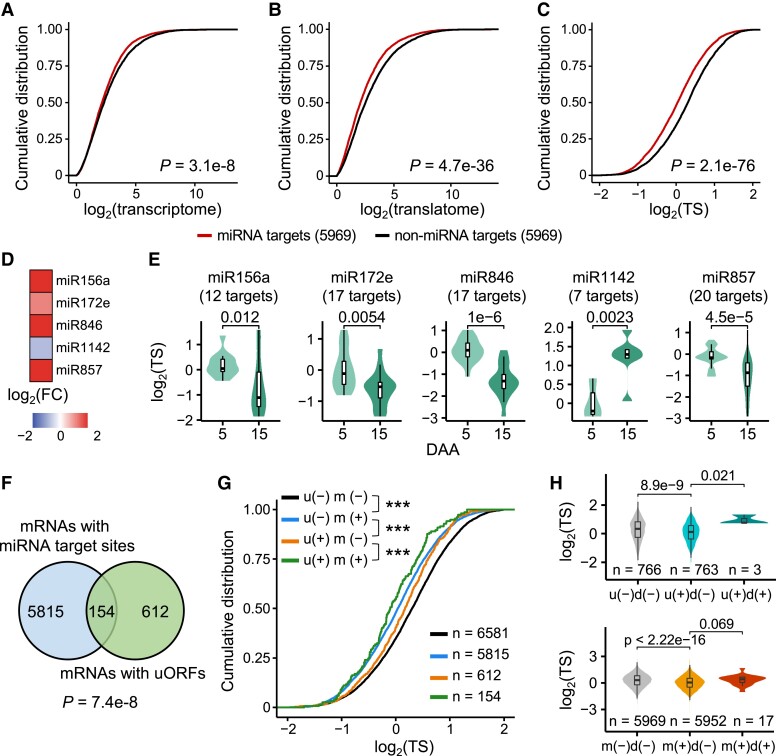
The dynamics of gene expression in crop grains has typically been investigated at the transcriptional level. However, this approach neglects translational regulation, a widespread mechanism that rapidly modulates gene expression to increase the plasticity of organisms. Here, we performed ribosome profiling and polysome profiling to obtain a comprehensive translatome data set of developing bread wheat (Triticum aestivum) grains. We further investigated the genome-wide translational dynamics during grain development, revealing that the translation of many functional genes is modulated in a stage-specific manner. The unbalanced translation between subgenomes is pervasive, which increases the expression flexibility of allohexaploid wheat. In addition, we uncovered widespread previously unannotated translation events, including upstream open reading frames (uORFs), downstream open reading frames (dORFs), and open reading frames (ORFs) in long noncoding RNAs, and characterized the temporal expression dynamics of small ORFs. We demonstrated that uORFs act as cis-regulatory elements that can repress or even enhance the translation of mRNAs. Gene translation may be combinatorially modulated by uORFs, dORFs, and microRNAs. In summary, our study presents a translatomic resource that provides a comprehensive and detailed overview of the translational regulation in developing bread wheat grains. This resource will facilitate future crop improvements for optimal yield and quality.


Conflict of interest statement

Conflict of interest statement. None declared.

Figures

Figure 1.
Figure 1.
Polysome profiling and ribosome profiling expose translational dynamics during grain development. A) A schematic overview of the experimental approach. The wheat grains from 3 developmental stages were used for the translatome investigation. B) Size distribution of the ribosome footprint (RF). Mean and standard error are shown. C) Metagene analysis of the RF reads near the annotated translation start and stop sites. The 27-nucleotide RF reads and the combination of replicates are shown. The density of reads at each position was normalized across the density of the surrounding reads. Bars show RFs, and lines show total and polysomal mRNAs. The predicted position of the ribosome's peptidyl (P) site of RF reads relative to the CDS start and stop codons is shown. The position of the RF reads is indicated by its 12th nucleotide within each footprint. The x-axis represents the relative distance of each RF reads to the start codon or the stop codon. The 0 on the x-axis represents that the 12th nucleotide of the RF reads was mapped to the 1st nucleotide of the start codon. The red, blue, and green bars represent the RF reads mapped to the 1st (expected), 2nd, and 3rd reading frames, respectively. The inferred peptidyl (P) site (nucleotides 12 to 14) in the start codon and the acceptor (A) site (nucleotides 15 to 17) in the stop codon are illustrated. D) Polysome profiling was analyzed using a sucrose gradient sedimentation with 3 replicates using grain sampled at 5, 10, and 15 d after anthesis (DAA), and the optical density and a wavelength of 254 nm (OD254; arbitrary units) was measured for the 3 grain developmental stages at the times indicated. E) Principal component analysis (PCA) of the RNA-seq, Poly-seq, and Ribo-seq data from the 3 grain development stages using the 10,000 most variable genes.
Figure 2.
Figure 2.
Translational dynamics of gene expression during grain development. A) Coexpression of differentially expressed genes (DEGs) at the transcriptional and translational levels at 3 different grain development stages (5, 10, and 15 d after anthesis). For the transcriptome and translatome, the expression values (FPKMs) were normalized by dividing by the maximum FPKM at the transcriptional or translational level. The K-means method was employed to identify coexpression clusters. B and C) Scatterplots showing the fold changes of the translation state (TS) and transcriptional expression levels during grain development. The transitions from 5 d after anthesis (DAA) to 10 DAA B) and from 10 to 15 DAA C) were analyzed. Dashed lines represent the 2.5 and 97.5 percentiles. The fold changes of the mRNA abundance ratio B) and TS ratio C) between the 2.5 and 97.5 percentiles are indicated in red text, respectively. Red and purple points indicate genes with upregulated and downregulated TSs, respectively. D) The Venn diagram shows that most of the genes involved in grain development have an altered TS. The genes involved in grain development were taken from the literature (Yao et al. 2018; Chen et al. 2020b). P-value, hypergeometric test. E) Translational expression patterns of 437 grain development–related genes with altered TS. The Z-scores of the expression levels of each gene at the translational level were visualized. The high Z-score on the gradient scale represents the high expression levels at the translational level. F) Expression profiles of 9 functional genes. Differential expression and translation analyses were performed. G) Total mRNA (RNA-seq), polysomal mRNA (Poly-seq), and ribosome footprint (Ribo-seq) read coverage on key genes regulating wheat grain development and filling. The read coverage was normalized by the million reads mapped to nuclear coding sequences.
Figure 3.
Figure 3.
Expression bias of homoeologs at the translational level. A) Pearson correlation coefficients (PCCs) of the translation state (TS) between homoeolog triads (green) and random (black) gene pairs. B) Ternary plots showing the relative TSs of triads in grains at 5 d after anthesis (DAA), 10, and 15 DAA. Each point corresponds to a gene triad with an A, B, and D coordinate. The color indicates the homoeolog bias pattern. The bottom percentage is the proportion of unbalanced homoeolog triads. The unbalanced group consists of 6 other groups of triads, excluding the balanced triads. C) Overlap between the triads with unbalanced transcriptional expressions and the triads with unbalanced TSs. P-value, hypergeometric test. Triads were combined for the 3 developmental stages. D) Summary of the homoeolog expression bias patterns at the transcriptional and translational levels in 5-, 10-, and 15-DAA grains. The ordinate shows the proportion of each triad group. The right panel indicates whether homoeolog triads in each group have balanced mRNA abundance or TE. E) Several examples show the unbalanced TSs between the homoeolog triads that are balanced at the transcriptional level. The relative TS of each triad was calculated. F) Unbalanced translation of triads of the well-known genes involved in grain development. Each block represents a homoeolog triad.
Figure 4.
Figure 4.
Genome-wide identification and characterization of actively translated open reading frames (ORFs). A) Summary of the ORFs identified, including the upstream ORFs (uORFs), annotated ORFs (aORFs), downstream ORFs (dORFs), internal ORFs (iORFs), and ORFs in lncRNAs (lORFs). B) Size distribution of the identified ORFs. The lengths were normalized. C) Start-codon usage of the identified ORFs. Numbers within the plots represent the percentages of ORFs with different start-codon usages. D) Translational expression patterns of the identified short ORFs (sORFs), which contain fewer than 300 nucleotides. Expression values were scaled to Z-scores. The K-means method was used to construct coexpression clusters of sORFs. The thick line in the middle represents mean. E) Predicted subcellular localization of the proteins encoded by sORFs. The TargetP software (Almagro Armenteros et al. 2019) was used here. FH) Coverage of RNA-seq, Poly-seq, and Ribo-seq in examples of an aORF F), lORF G), and dORF H). Read coverage was normalized by the million reads mapped to nuclear coding sequences. The gene model of the aORF is well supported by the sequencing reads F). In long noncoding RNA (lncRNA), the sequencing reads support the expression of a lORF G). Sequencing reads in aORFs provided strong support for dORFs H).
Figure 5.
Figure 5.
Upstream open reading frames (uORFs) alter the translation efficiency (TE) of mRNAs in wheat. A) Cumulative distributions of the TEs of mRNAs with uORFs. A 2-sided Wilcoxon test was performed. B) TE of uORFs with and without an AUG start codon and their downstream mORFs. The left panel shows TEs of AUG uORFs and non-AUG uORFs. The right panel shows TEs of mORFs with and without an AUG uORF. The “w/o uORF” group represents 1,000 randomly selected mORFs without uORFs. Two-sided Wilcoxon tests were performed. C) Kozak sequences of uORFs and main ORFs (mORFs). A chi-square test was performed. D) Several genes with uORFs alter the mORF TE. The TEs of the uORFs and mORFs across developmental stages are anticorrelated. E and F) Coverage of Ribo-seq reads in TabZIP53-5AE) and TaCCR2-5DF). Read coverage was normalized by the million reads mapped to nuclear coding sequences. In the region upstream of the mORF, the sequencing reads support the expression of uORFs. Green boxes, uORFs. The base sequences and the length of the uORFs (uORFTabZIP53-5A, uORFTaCBL1-1B) can be found in Supplemental Data Set 10. G) Schematic of the dual-luciferase system used to investigate the effect of uORFs on the translation of mORFs. 35S, cauliflower mosaic virus 35S promoter. REN, Renilla reniformis luciferase; LUC, firefly luciferase. Del indicates the deletion of a uORF. HK) The effect of the different cassettes on the LUC/REN activity H and J) and LUC/REN mRNA level I and K) associated with the mORF in the dual-luciferase reporter system. P-values were calculated using 2-sided Student's t-test. uORFTabZIP53-5A and uORFTaCCR2-5 were derived from TabZIP53-5A and TaCCR2-5D, respectively. H and I) TabZIP53-5A. J and K) TaCCR2-5D. Mean and standard error are shown. L) A frequency distribution histogram of the correlation between the TEs of uORFs and those of their mORFs. TEs of uORFs and their mORFs were calculated, respectively. All replicates from 3 developmental stages were used. The Spearman correlation coefficients were used to measure the correlation.
Figure 6.
Figure 6.
Combinatorial regulation of gene expression at the translational level by upstream open reading frames (uORFs), downstream ORFs (dORFs), and microRNAs (miRNAs). AC) Cumulative distributions of the transcriptional level (A), translational level (B), and translation state (TS) (C) of the miRNA target genes and non-miRNA target genes. The different colored lines represent mRNAs with or without miRNA target sites. Two-sided Wilcoxon tests were performed. Only expressed genes with a FPKM > 1 were retained. A random set of the gene without miRNA target sites was used as a control. D) The fold changes in expression levels of several miRNAs during grain development. The comparison of 15-DAA grains to 5-DAA grains was shown. E) The TS distributions of the targets of several miRNAs. The predicted targets with miRNA-mediated translation repression were shown. Two-sided Wilcoxon tests were performed. F) A Venn diagram illustrates the cooccurrence of miRNAs and uORFs in gene models. A hypergeometric test was performed. G) The TS distributions of the “u−m−,” “u−m+,” “u+m−,” and “u+m+” mRNAs. “u−,” genes without an uORF; “u+,” genes with an uORF; “m−,” non-miRNA target genes; “m+,” miRNA target genes. A random set of the gene without uORFs or miRNA target sites was used as a control. Two-sided Wilcoxon tests were performed. ***P < 0.001. H) dORFs enhance the TSs of mRNAs with uORFs or microRNA target sites. “d−”, genes without a dORF. “d+”, genes with a dORF. The random set of the gene without specific features was used as a control.

Comment in

References

    1. Almagro Armenteros JJ, Salvatore M, Emanuelsson O, Winther O, von Heijne G, Elofsson A, Nielsen H. Detecting sequence signals in targeting peptides using deep learning. Life Sci Alliance. 2019:2(5):e201900429. 10.26508/lsa.201900429 - DOI - PMC - PubMed
    1. Altschul SF, Gish W, Miller W, Myers EW, Lipman DJ. Basic local alignment search tool. J Mol Biol. 1990:215(3):403–410. 10.1016/S0022-2836(05)80360-2 - DOI - PubMed
    1. Axtell MJ. Classification and comparison of small RNAs from plants. Annu Rev Plant Biol. 2013:64(1):137–159. 10.1146/annurev-arplant-050312-120043 - DOI - PubMed
    1. Axtell MJ, Meyers BC. Revisiting criteria for plant microRNA annotation in the era of big data. Plant Cell. 2018:30(2):272–284. 10.1105/tpc.17.00851 - DOI - PMC - PubMed
    1. Bai AN, Lu XD, Li DQ, Liu JX, Liu CM. NF-YB1-regulated expression of sucrose transporters in aleurone facilitates sugar loading to rice endosperm. Cell Res. 2016:26(3):384–388. 10.1038/cr.2015.116 - DOI - PMC - PubMed

Publication types

LinkOut - more resources