. 2023 Mar 11;14(1):1351.
doi: 10.1038/s41467-023-36922-1.

Recapitulating thyroid cancer histotypes through engineering embryonic stem cells

Affiliations

Recapitulating thyroid cancer histotypes through engineering embryonic stem cells

Veronica Veschi et al. Nat Commun. .

Abstract

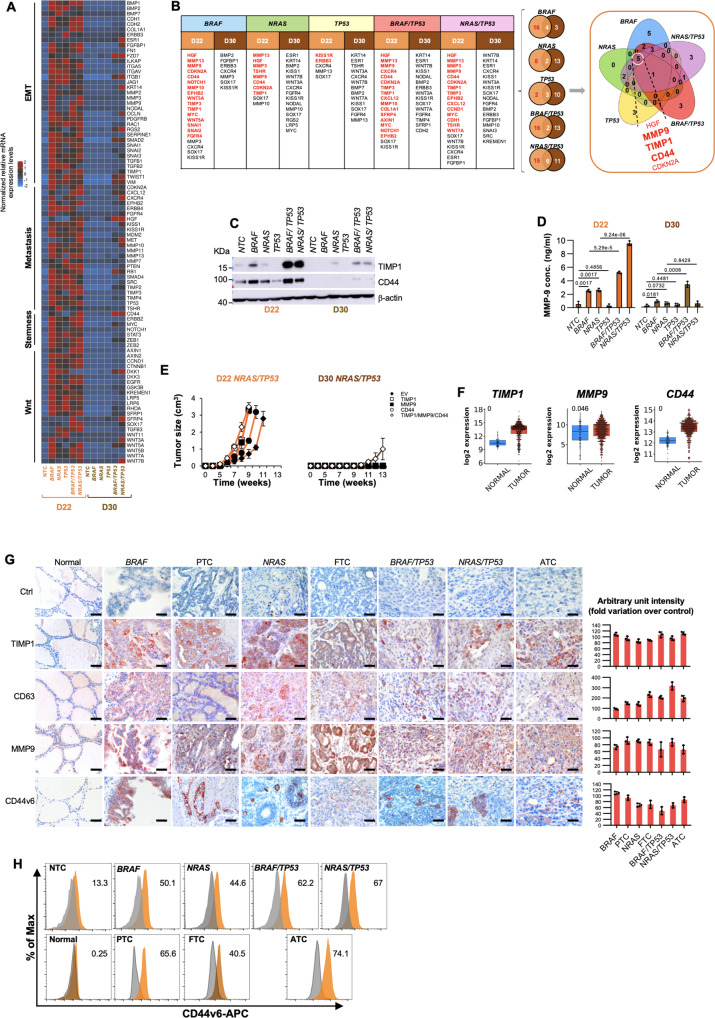
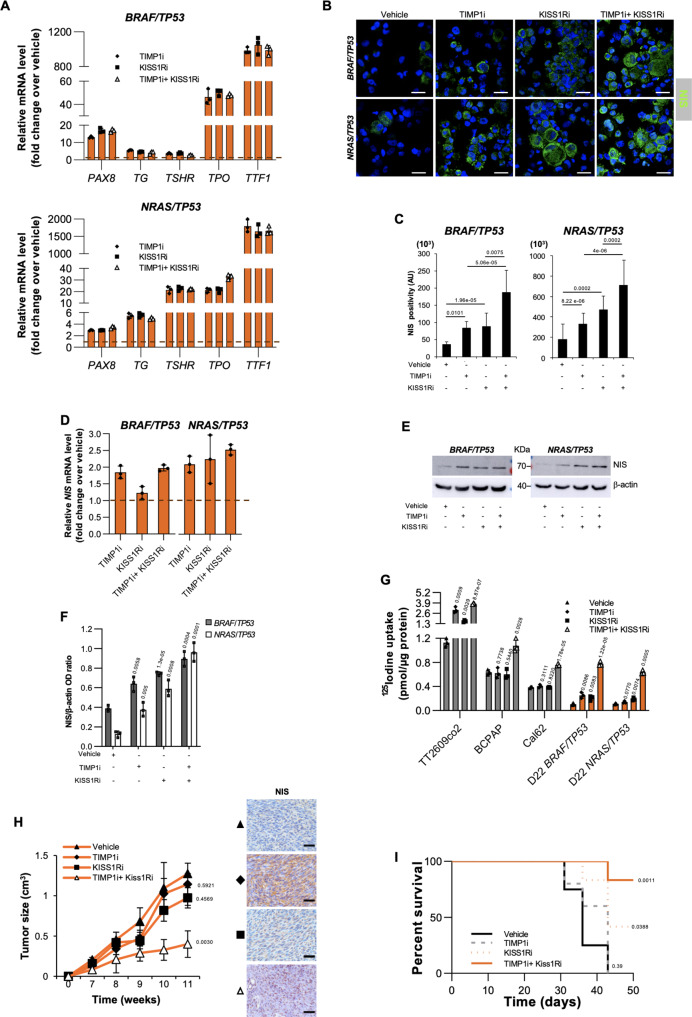
Thyroid carcinoma (TC) is the most common malignancy of endocrine organs. The cell subpopulation in the lineage hierarchy that serves as cell of origin for the different TC histotypes is unknown. Human embryonic stem cells (hESCs) with appropriate in vitro stimulation undergo sequential differentiation into thyroid progenitor cells (TPCs-day 22), which maturate into thyrocytes (day 30). Here, we create follicular cell-derived TCs of all the different histotypes based on specific genomic alterations delivered by CRISPR-Cas9 in hESC-derived TPCs. Specifically, TPCs harboring BRAFV600E or NRASQ61R mutations generate papillary or follicular TC, respectively, whereas addition of TP53R248Q generate undifferentiated TCs. Of note, TCs arise by engineering TPCs, whereas mature thyrocytes have a very limited tumorigenic capacity. The same mutations result in teratocarcinomas when delivered in early differentiating hESCs. Tissue Inhibitor of Metalloproteinase 1 (TIMP1)/Matrix metallopeptidase 9 (MMP9)/Cluster of differentiation 44 (CD44) ternary complex, in cooperation with Kisspeptin receptor (KISS1R), is involved in TC initiation and progression. Increasing radioiodine uptake, KISS1R and TIMP1 targeting may represent a therapeutic adjuvant option for undifferentiated TCs.


Conflict of interest statement

The authors declare no competing interests.

Figures

Fig. 1
Fig. 1. hESCs engineered with the most common TC genetic alterations recapitulate thyroid cancer histotypes.
A Model of directed differentiation of human embryonic stem cell (hESC) into thyroid lineage. To promote thyroid lineage specification, hESCs were exposed to the indicated stimuli. Treatment with FGF10, KGF, BMP4 and EGF is reported as FKBE. B Cell cycle analysis in non-targeting control (NTC) hESC-derived cells at the indicated stage of thyroid differentiation lineage. The data show percentage of cell number in G0/G1, S, and G2/M cell cycle phases. Data are expressed as mean ± SD of three independent experiments. C Cell proliferation in hESC-derived cells, engineered with the indicated mutations, at the indicated stage of thyroid differentiation lineage, at 7 days. D Invasion analysis in cells engineered as in (C) at 72 h. E Clonogenic assay in D22 thyroid progenitor cells (TPCs) engineered as in (C) at 21 days. For (C–E) statistical significance was calculated using the two-tailed unpaired t test and data are mean ± standard error of three independent experiments. F (upper panel) Growth kinetics of xenograft tumors generated by subcutaneous injection of D22 TPCs. (lower panel) Frequency of teratocarcinoma (TerC) or TCs obtained by the injection of hESC-derived cells harboring different mutational background, at different stages of thyroid differentiation lineage. Data are shown as mean ± SD. n = 12 mice per group. G H&E staining and immunohistochemistry analysis of thyroglobulin (Tg), cytokeratin 19 (CK19), β-catenin and NIS on xenograft tumors obtained following injection of D22 TPCs engineered with different mutational background and compared with patient-derived PTC, FTC and ATC. Number of tissues analyzed n = 5. Mutational status of human tissues: PTC BRAF mutated ID#6, FTC NRAS mutated, and ATC BRAF/TP53 mutated ID#96. Scale bars, 100 µm. H Correlation analysis in Gene Expression Omnibus (GEO) (GSE33630) of CTNNB1 mRNA expression levels in normal thyroid tissue, PTC and ATC. Boxes represent the interquartile range (IQR) and midline represents the median. Statistical significance was calculated using Kruskal-Wallis test. i Immunoblot analysis of β-catenin in D22 TPCs engineered as in (c). β-actin was used as loading control. Source data are provided as a Source Data file.
Fig. 2
Fig. 2. The ternary complex TIMP1-MMP9-CD44 sustains the tumor initiation capability of engineered D22 TPCs.
A Heatmap of Wnt-, stemness-, metastasis- and EMT- related genes in D22 TPCs and in D30 mature thyrocytes engineered with the indicated mutations. Data are presented as 2−ΔCt normalized values of three independent experiments. B Table and Venn diagrams of common (black color) and exclusive upregulated genes (red color) with logFC > 1.5 in D22 TPCs vs thyrocytes (D30). C Immunoblot analysis of TIMP1 and CD44 in hESC-derived cells harboring different mutational background, at D22 and D30. β-actin was used as loading control. One representative of three independent experiments is shown. Source data are provided as a Source Data file. D MMP9 production in cells as in (C) at 48 h. Statistical significance was calculated using the unpaired two-tailed t test. Data are expressed as mean ± SD of three independent experiments. E Growth kinetics of xenograft tumors generated by subcutaneous injection of the indicated engineered D22 TPCs and D30 cells overexpressing TIMP1, MMP9 and CD44 alone and in combination. Data are shown as mean ± SD. n = 10 mice per group. F Relative mRNA expression levels of TIMP1, MMP9 and CD44 in normal (n = 59) and tumor (n = 509) thyroid tissue from TGCA database, thyroid carcinoma (THCA) branch. Boxes represent the IQR and midline represents the median. Statistical significance was calculated using the Wilcoxon test. G (left panel) Immunohistochemical analysis of TIMP1, CD63, MMP9 and CD44v6 on xenografts obtained by injecting engineered D22 TPCs and compared with normal thyroid tissue, patient-derived PTC, FTC and ATC. Ctrl= negative control. The number of tissues analyzed n = 5. Mutational status of human tissues: PTC BRAF mutated ID#6, FTC NRAS mutated, and ATC BRAF/TP53 mutated ID#96. Scale bars, 100 µm. (right panel) Histograms represent the percentage of TIMP1, CD63, MMP9 and CD44v6 positive cells. Data are expressed as mean ± SD of three independent experiments. H CD44v6 flow cytometry analysis (orange histograms) and corresponding isotype-matched control (grey histograms), in engineered D22 TPCs and compared with isolated normal thyroid cells and patient-derived PTC, FTC and ATC cells.
Fig. 3
Fig. 3. TIMP1 blockade and CD44v6 silencing significantly impair survival and invasive capacity of D22 TPCs.
A Cell proliferation in D22 TPCs engineered with the indicated mutations treated with vehicle, TIMP1, TIMP1 inhibitor (TIMP1i) alone or in combination up to 3 days. B Invasion analysis in D22 TPCs harboring the indicated mutations treated as in (A) up to 4 days. For (A and B) statistical significance was calculated using the two-tailed unpaired t test and data are mean ± standard error of three independent experiments. C Immunoblot of pAKT and AKT in engineered D22 TPCs treated as in (A) for 48 h. β-actin was used as loading control. One representative of three independent experiments is shown. Source data are provided as a Source Data file. D Relative mRNA expression levels of CD44v6 in D22 TPCs engineered with the indicated mutations and treated with TIMP1 inhibitor (TIMP1i) for 24 h. Data are presented as fold change over vehicle ± SD of three independent experiments. E Immunoblot analysis of pAKT and AKT levels in D22 TPCs engineered with the indicated mutations and transduced with control shRNA (scramble, scr) or CD44v6 shRNA (shCD44v6). β-actin was used as loading control. One representative of three independent experiments is shown. Source data are provided as a Source Data file. f Cell proliferation in D22 TPCs engineered with the indicated mutations transduced with control shRNA (scramble, scr) or CD44v6 shRNA (shCD44v6), up to 72 h. G Invasion analysis in D22 TPCs harboring the indicated mutations transduced with control scramble (scr) or shCD44v6, up to 4 days. For (F and G) statistical significance was calculated using the two-tailed unpaired t test and data are mean ± standard error of three independent experiments. H Immunoblot analysis of pAKT and AKT in the indicated engineered D22 TPCs overexpressing CD44v6, untreated and treated with TIMP1i for 48 h. β-actin was used as loading control. One representative of three independent experiments is shown. Source data are provided as a Source Data file. I Heatmap of Wnt-, EMT- stemness and metastasis-related genes in D22 TPCs engineered with the indicated mutations and treated with vehicle or TIMP1i for 24 h. Data are presented as normalized 2−ΔCt values of three independent experiments.
Fig. 4
Fig. 4. MAPK and PI3K/AKT pathways, along with EMT-associated signature, are enriched in D22 TPCs, mouse avatars and human PTC and ATC.
A (upper panels) Heatmaps showing the top 100 differentially expressed genes (DEGs) with logFC > 2 obtained by total transcriptome analysis (mRNAseq), in engineered D22 TPCs harboring the pathogenetic TC mutations versus their derived-xenograft tumors. (lower panels) Barplots indicate the significantly enriched pathways (p value < 0.05) performed using a Gene set enrichment analysis (GSEA) on Hallmark category from MSigDB database of differentially expressed genes (DEGs) obtained by RNAseq. B Venn diagram of the common enriched pathways in xenograft tumors versus D22 TPCs. List of the common 13 differentially regulated genes, associated with EMT-pathway. C Gene set enrichment analysis (GSEA) of EMT pathway in xeno NRAS/TP53 versus D22 NRAS/TP53 (ES = 0.549, NES = 2.378, p = 2.31E-07). Statistical significance was calculated using Benjamini & Hochberg test. D Heatmap showing normalized mRNA expression values of genes involved in PI3K/AKT-, MAPK-, EMT- and stemness-related pathways in the indicated engineered D22 TPCs, D22-derived xenograft tumors and human PTC and ATC. Mutational status of human tissues: PTC BRAF mutated ID#6, and ATC BRAF/TP53 mutated ID#96. Values are expressed as Log2 upper quartile (UQ).
Fig. 5
Fig. 5. KISS1R is a prognostic factor and a potential therapeutic target in advanced TCs.
A (left panel) H&E analysis of primary tumor (P), lymphnodes (Ly) and lung (Lu) metastatic lesions, generated by orthotopic injection of D22 TPCs engineered with the indicated mutations. Scale bars, 100 µm. (right panel) Immunohistochemical analysis of TIMP1, MMP9, CD44, β-catenin, TWIST and SNAIL on primary and metastasis mouse avatars. Ctrl= negative control. Scale bars, 100 µm. B Immunohistochemical analysis of TIMP1, MMP9, CD44, β-catenin, TWIST and SNAIL on primary and metastatic PTC (ID#61) and ATC (ID#96) patient-derived tumors harboring BRAF/TP53 mutations. Ctrl= negative control. Scale bars, 100 µm. For (A and B) n = 5 tissues analyzed. c Heatmap of Wnt-, EMT- stemness and metastasis-related genes (2−ΔCt expression values) in primary (P), metastatic (M) tumor xenografts and primary (P) and metastatic (M) PTC- and ATC-patient derived tumors, harboring BRAF/TP53 mutations. Data are presented as normalized mRNA expression values of three independent experiments. D Venn diagram showing common upregulated genes with logFC > 3.5 in metastasis (M) versus primary (P) tumor xenografts, in PTC-derived metastasis (PTC M) versus primary tumors (PTC P) and in ATC primary versus PTC primary tumors. E and F, (left panels) Immunohistochemical analysis of KISS1 (E) and KISS1R (F) on primary and metastatic PTC (ID#61) and ATC (ID#96) patient-derived tumors harboring BRAF/TP53 mutations. n = 5 tissues analyzed. Scale bars, 100 µm. (right panels) R2 database analysis of KISS1 (E) and KISS1R (F) mRNA expression levels in normal thyroid (nt, n = 6), PTC (n = 6), FTC (n = 6) and ATC (n = 10) patient-derived tissues (R2 database Tumor Thyroid Carcinoma all - Huettelmaier − 28 - tmm - jbseqrnanb1). Boxes represent the IQR and midline represents the median. Statistical significance was calculated using ANOVA test. G Immunohistochemistry score analysis of KISS1R expression in normal thyroid tissue (n = 56), primary PTC tumors (PTC P, n = 73), PTC-derived loco-regional lymphnode metastasis (PTC M, n = 19) and primary ATC tumors (n = 5). Mutational status of 97 primary and metastatic human tissues is reported in Supplementary Data 2. Boxes represent the IQR and midline represents the median. Statistical significance was calculated using Kruskal-Wallis test.
Fig. 6
Fig. 6. KISS1R and TIMP1 targeting restore the functional iodine uptake by increasing NIS expression.
A Relative mRNA expression levels of PAX8, TG, TSHR, TPO and TTF1 in the indicated engineered D22 treated with KISS1R inhibitor (KISS1Ri) alone or in combination with TIMP1 inhibitor (TIMP1i) for 24 h. Data are presented as fold change over vehicle ± SD of three independent experiments. B and c Immunofluorescence analysis of NIS and cell positivity in D22 TPCs engineered with the indicated mutations and treated as in (A) for 72 h. Nuclei were counterstained by Toto-3. Statistical significance was calculated using the unpaired two-tailed t test. Scale bars, 20 µm. Data are mean ± SD of 3 independent experiments. n = 12 wells analyzed. D Relative mRNA expression levels of NIS in cells engineered and treated as in (A) for 24 h. Data are presented as fold change over vehicle ± SD of three independent experiments. E and F Immunoblot of NIS (E) and relative optical density ratio (F) in cells as in (A) for 48 h. β-actin was used as loading control. One representative of three independent experiments is shown. Source data are provided as a Source Data file. G Radioiodine uptake in the indicated established thyroid cancer cell lines and engineered D22 TPCs treated as in (A) for 48 h. For (F and G) statistical significance was calculated using the two-tailed unpaired t test and data are mean ± standard error of three independent experiments. H (left panel) Growth kinetics of xenograft tumors generated by subcutaneous injection of D22 TPCs engineered for NRASQ61R/TP53R248Q treated with TIMP1 inhibitor (TIMP1i) and KISS1R inhibitor (KISS1Ri) alone and in combination. Statistical significance was calculated using the unpaired two-tailed t test. Data are shown as mean ± SD. n = 6 mice per group. (right panels) Immunohistochemical analysis of NIS on xenograft tumors obtained following injection of D22 TPCs engineered for NRASQ61R/TP53R248Q treated as indicated, left panel. Scale bars, 100 µm. I Kaplan-Meier graph showing the murine survival of D22 TPCs engineered with NRASQ61R/TP53R248Q treated as in (H). The statistical significance between groups was evaluated using a log rank Mantel-Cox test.
Fig. 7
Fig. 7. Model of TC tumorigenesis and progression.
A Schematic model illustrating that the most common TC genetic alterations (BRAFV600E, NRASQ61R, BRAFV600E/TP53R248Q and NRASQ61R/TP53R248Q) in thyroid progenitor cell (TPC) recapitulate the different TC histotypes (FTC, PTC and ATC). Of note TP53R248Q alone is not required for TC initiation. B Model of ternary complex (TIMP1/MMP9/CD44) and KISS1R driven pathways in engineered D22 TPCs. TIMP1 and pro-MMP9 complex formation activates MMP9 and consequently leads to the cleavage of CD44. The CD44 intracytoplasmic domain (CD44icd) translocates into the nucleus where it induces CD44v6 transcription. CD44v6 promotes TPC proliferation through PI3K/AKT pathway. The binding of kisspeptins (KP) to KISS1R activates ERK and cooperates with MMP9 to promote the transcription of EMT-related genes, including TWIST and SNAIL, driving metastatic engraftment.

Comment in

References

    1. Zane M, et al. Normal vs cancer thyroid stem cells: the road to transformation. Oncogene. 2016;35:805–815. doi: 10.1038/onc.2015.138. - DOI - PubMed
    1. Veschi V, et al. Cancer Stem Cells in Thyroid Tumors: From the Origin to Metastasis. Front Endocrinol. (Lausanne) 2020;11:566. doi: 10.3389/fendo.2020.00566. - DOI - PMC - PubMed
    1. Haugen BR, et al. 2015 American Thyroid Association Management Guidelines for Adult Patients with Thyroid Nodules and Differentiated Thyroid Cancer: The American Thyroid Association Guidelines Task Force on Thyroid Nodules and Differentiated Thyroid Cancer. Thyroid. 2016;26:1–133. doi: 10.1089/thy.2015.0020. - DOI - PMC - PubMed
    1. Maniakas A, et al. Evaluation of Overall Survival in Patients With Anaplastic Thyroid Carcinoma, 2000-2019. JAMA Oncol. 2020;6:1397–1404. doi: 10.1001/jamaoncol.2020.3362. - DOI - PMC - PubMed
    1. Romitti M, et al. Signaling pathways in follicular cell-derived thyroid carcinomas. (Rev.). Int J. Oncol. 2013;42:19–28. doi: 10.3892/ijo.2012.1681. - DOI - PubMed

Publication types

MeSH terms

Substances