. 2023 Mar 11;14(1):1350.
doi: 10.1038/s41467-023-36961-8.

Interpretable and context-free deconvolution of multi-scale whole transcriptomic data with UniCell deconvolve

Affiliations

Interpretable and context-free deconvolution of multi-scale whole transcriptomic data with UniCell deconvolve

Daniel Charytonowicz et al. Nat Commun. .

Abstract

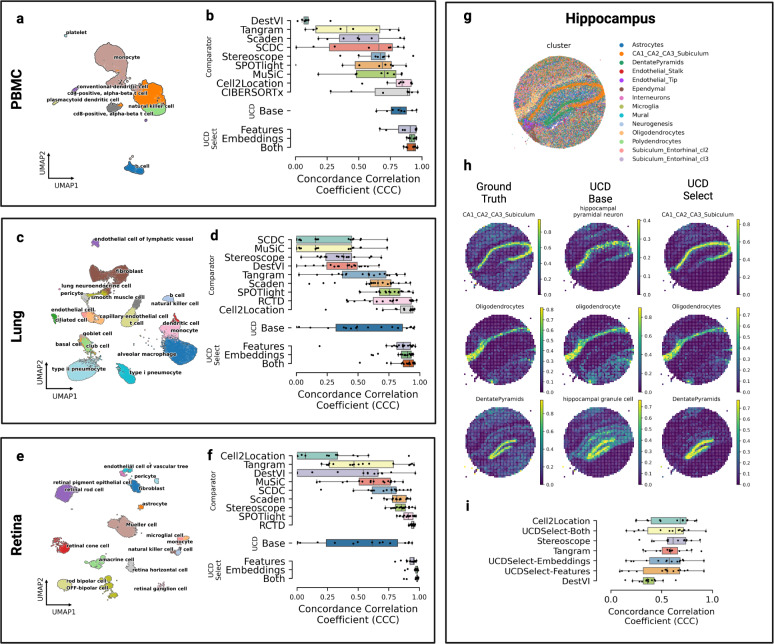
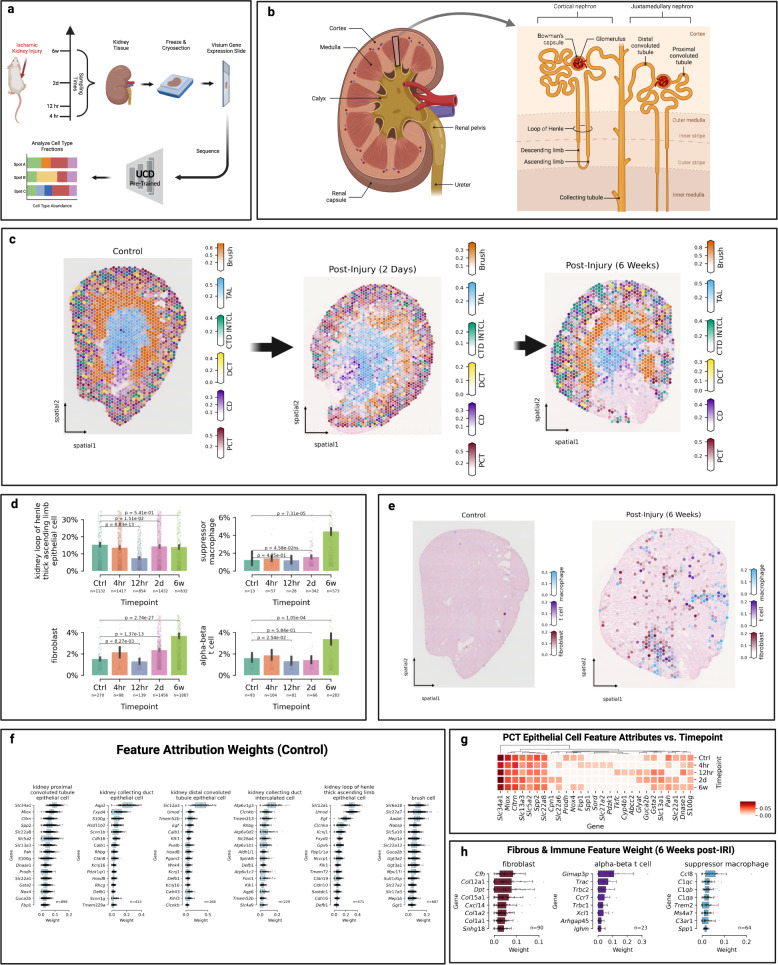
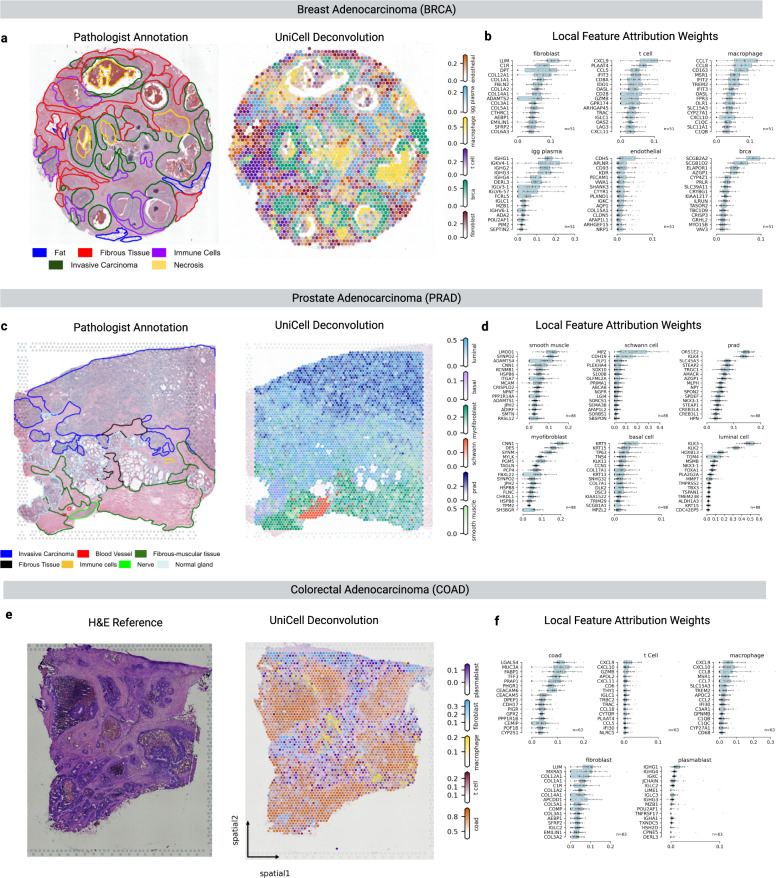
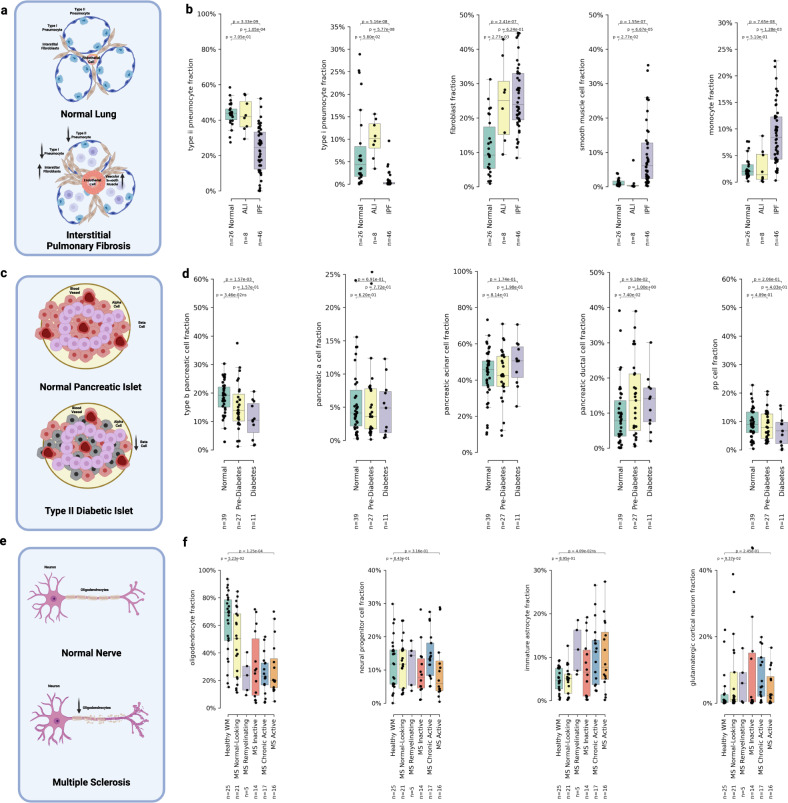
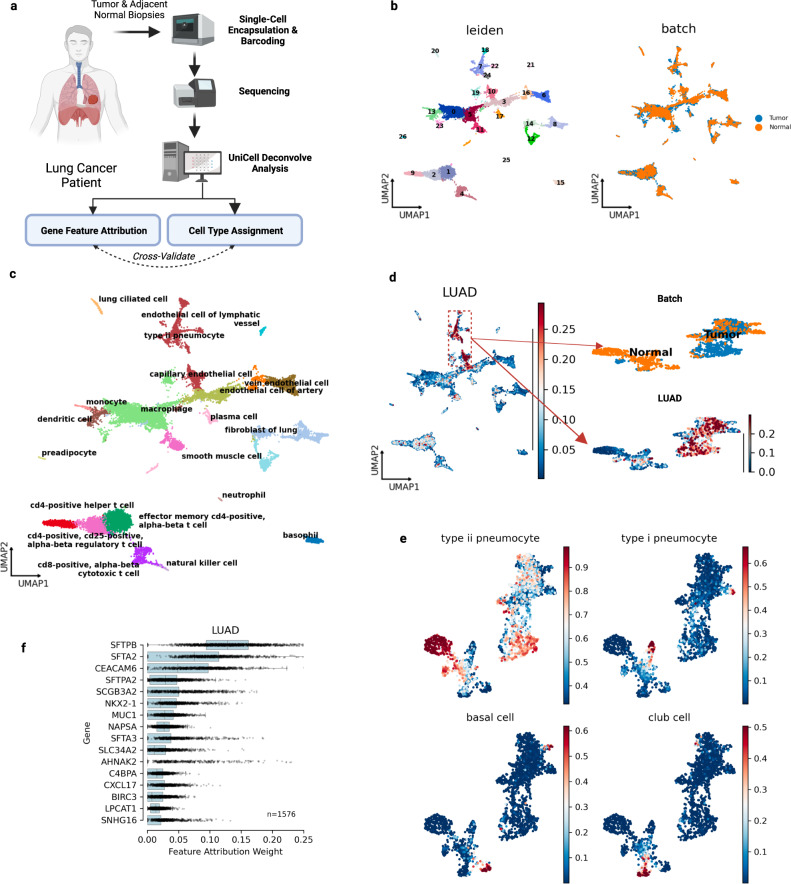
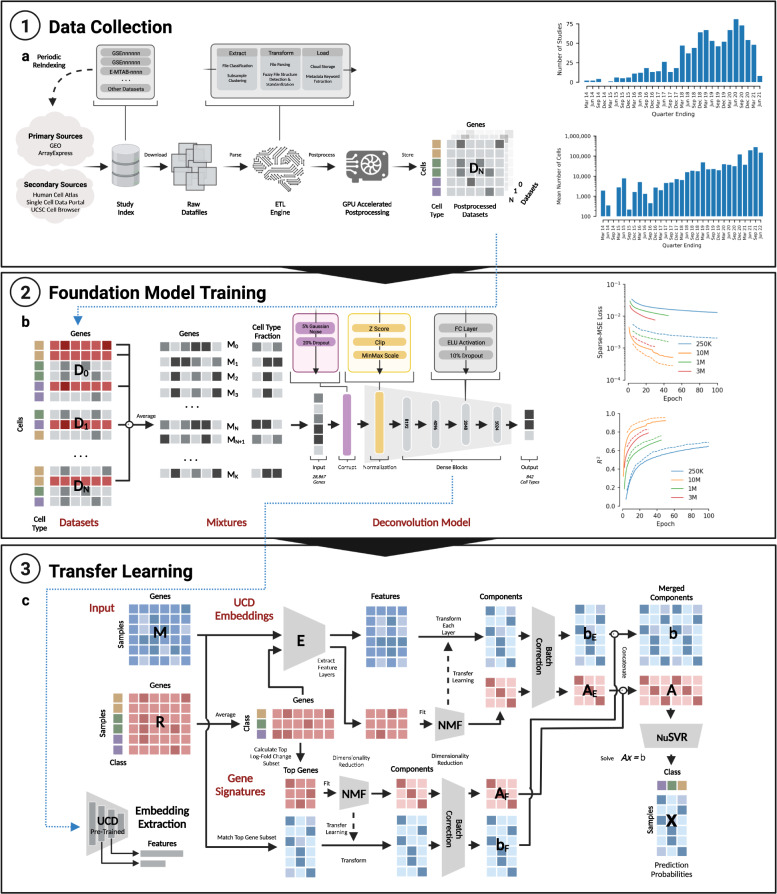
We introduce UniCell: Deconvolve Base (UCDBase), a pre-trained, interpretable, deep learning model to deconvolve cell type fractions and predict cell identity across Spatial, bulk-RNA-Seq, and scRNA-Seq datasets without contextualized reference data. UCD is trained on 10 million pseudo-mixtures from a fully-integrated scRNA-Seq training database comprising over 28 million annotated single cells spanning 840 unique cell types from 898 studies. We show that our UCDBase and transfer-learning models achieve comparable or superior performance on in-silico mixture deconvolution to existing, reference-based, state-of-the-art methods. Feature attribute analysis uncovers gene signatures associated with cell-type specific inflammatory-fibrotic responses in ischemic kidney injury, discerns cancer subtypes, and accurately deconvolves tumor microenvironments. UCD identifies pathologic changes in cell fractions among bulk-RNA-Seq data for several disease states. Applied to lung cancer scRNA-Seq data, UCD annotates and distinguishes normal from cancerous cells. Overall, UCD enhances transcriptomic data analysis, aiding in assessment of cellular and spatial context.


Conflict of interest statement

D.C., R.B., and R.S. declare no competing interests. RS is a consultant/advisor as of July 2022 at GeneDx, a company with no direct relationships to the present work.

Figures

Fig. 1
Fig. 1. Benchmarking UniCell deconvolution performance across tissue types.
a UMAP visualization of human peripheral blood mononuclear cell (PBMC) single cells used to generate pseudobulk mixtures for deconvolution benchmarking, annotated by cell type. b Box plots of deconvolution performance for each cell type (n = 8) in the PBMC dataset, stratified by method (y-axis), as measured by concordance correlation coefficient (x-axis). c UMAP visualization of human lung tissue single cells used to generate pseudobulk mixtures for deconvolution benchmarking, annotated by cell type. d Box plots of deconvolution performance for each cell type (n = 19) in the lung dataset, stratified by method (y-axis), as measured by concordance correlation coefficient (x-axis). e UMAP visualization of human retina periphery single cells used to generate pseudobulk mixtures for deconvolution benchmarking, annotated by cell type. f Box plots of deconvolution performance for each cell type (n = 17) in the retina dataset, stratified by method (y-axis), as measured by concordance correlation coefficient (x-axis). g Spatial profile of murine hippocampal formation profiled using Slide-SeqV2 colored by individual cell type. h Spatial heatmaps representing a downsampled hippocampal dataset, where each spot represents the average gene expression profile obtained from multiple individual cells in close spatial proximity. The first column illustrates the ground truth fractions of three representative cell types comprising the downsampled spatial spots (with the scale ranging from 0 to 1 representing 0% to 100% of cells in that downsampled spatial spot corresponding to a given cell type). The middle column denotes cell fraction predictions for matched or related cell types given by UCD Base. The rightmost column denotes cell type predictions made by UCD Select trained on individual cell profiles from the source dataset. i Box plots of deconvolution performance for each cell type (n = 14) in the hippocampal dataset, stratified by method (y-axis), as measured by concordance correlation coefficient (x-axis). For boxplots in b, d, f and i, the center line, box limits and box whiskers correspond to the median, first and third quartiles, and the 1.5x interquartile range, respectively. Individual data points are superimposed over each boxplot.
Fig. 2
Fig. 2. UniCell deconvolves mouse kidney undergoing ischemic reperfusion injury.
a Five publically available spatial transcriptomics samples were acquired representing kidney cross sections taken from mice at different stages of ischemic renal reperfusion injury (IRI), and analyzed using UCDBase to determine predicted cell type compositions. A visual summary of the experimental conditions and sample processing is provided. b Overview of critical kidney anatomy and general spatial localization of key kidney cell types is shown as a reference. c Spatial deconvolution and distribution of select cell types of the murine kidney across different time points (n = 1 spatial sample at each time point) following IRI. d Bar plots of average predicted fractions (y-axis) for select cell types deconvolved from spatial transcriptomics samples taken at different time points (x-axis) following IRI. Sample sizes are shown beneath each compared condition, representing individual spatial capture spots. Spots with <0.5% reported fraction of a given cell type were excluded from analysis. Bar height denotes the average predicted cell type fraction for each cell type across conditions. Error bars denote 95% confidence interval (CI). P-values indicate the significance of difference between groups evaluated using an unpaired two-sided Wilcoxon rank sum test, with Benjamini-Hochberg correction for multiple comparisons (Source Data File—(d)). e Spatial predictions of fibrotic and immune infiltrate before and after IRI (n = 1 spatial sample at each time point). f Box plots of feature attribution weights (x-axis) for genes (y-axis) indicative of select cell types predicted to be present at the control (n = 1) timepoint. Sample sizes represent individual spatial capture spots with at least 10% predicted fraction for that given cell type (Source Data File—Fig. 2f). g Changes in feature attribution weights for select genes (x-axis) indicating proximal convoluted tubule (PCT) epithelial cell fractions shown across different time points (y-axis) following IRI (Source Data File—Fig. 2g). h Box plots of feature attribution weights (x-axis) for genes (y-axis) indicative of select cell types predicted to be present at the 6-week post-IRI (n = 1) timepoint. Sample sizes represent individual spatial capture spots with at least 10% predicted fraction for that given cell type (Source Data File—Fig. 2h). For scale bars in c and e, these represent the fraction (range 0–1) a given spatial coordinate is predicted to be composed of a given cell type. For boxplots in f and h, the center line, box limits and box whiskers correspond to the median, first and third quartiles, and the 1.5x interquartile range, respectively. Individual data points are superimposed over each boxplot.
Fig. 3
Fig. 3. UniCell allows for deconvolution of tumor microenvironments across varying cancer subtypes with unique histologic features.
a (left) Hematoxylin & Eosin (H&E) stained section of a breast invasive adenocarcinoma (BRCA) sample with human-derived pathological annotations (provided with source data) overlaid. (right) UniCell Deconvolve Base (UCDBase) predicted distribution of key cell types in the tumor microenvironment for a sequential section derived from the same sample (n = 1). b Box plots of feature attribution weights (x-axis) for genes (y-axis) indicative of select cell types predicted to be present in the BRCA spatial sample. Sample sizes represent the top 2% (n = 51) of individual total spatial capture spots by predicted fraction for that given cell type (Source Data File—Fig. 3b). c (left) Hematoxylin & Eosin (H&E) stained section of a prostate adenocarcinoma (PRAD) sample with human-derived pathological annotations (provided with source data) overlaid. (right) UCDBase predicted distribution of key cell types in the tumor microenvironment for a sequential section derived from the same sample (n = 1). d Box plots of feature attribution weights (x-axis) for genes (y-axis) indicative of select cell types predicted to be present in the PRAD spatial sample. Sample sizes represent the top 2% (n = 88) of individual total spatial capture spots by predicted fraction for that given cell type (Source Data File—Fig. 3d). e (left) Hematoxylin & Eosin (H&E) stained section of a colorectal adenocarcinoma (COAD) sample. (right) UCDBase predicted distribution of key cell types in the tumor microenvironment for a sequential section derived from the same sample (n = 1). f Box plots of feature attribution weights (x-axis) for genes (y-axis) indicative of select cell types predicted to be present in the COAD spatial sample. Sample sizes represent the top 2% (n = 63) of individual total spatial capture spots by predicted fraction for that given cell type (Source Data File—Fig. 3f). For scale bars on the right-side of a, c, and e, these represent the fraction (range 0–1) a given spatial coordinate is predicted to be composed of a given cell type. For boxplots in b, d, and f, the center line, box limits and box whiskers correspond to the median, first and third quartiles, and the 1.5x interquartile range, respectively. Individual data points are superimposed over each boxplot.
Fig. 4
Fig. 4. UniCell resolves expected pathophysiological changes in cellular fractions from Bulk RNA-sequencing data.
a Visualization summarization basic pathophysiology of interstitial pulmonary fibrosis and potential shifts in cell type fractions. b Box plots of cell type fractions predicted by UniCell Deconvolve Base (UCDBase) for key lung cell types (y-axis) stratified by disease state (x-axis) (Source Data File—Fig. 4b). c Visualization summarization basic pathophysiology of type ii diabetes and potential shifts in cell type fractions. d Box plots of cell type fractions predicted by UCDBase for key pancreatic cell types (y-axis) stratified by disease state (x-axis) (Source Data File—Fig. 4d). e Visualization summarization basic pathophysiology of multiple sclerosis and potential shifts in cell type fractions. f Box plots of cell type fractions predicted by UCDBase for key brain white matter cell types (y-axis) stratified by disease state (x-axis) (Source Data File—Fig. 4f). For all boxplots shown in b, d, and f, the center line, box limits and box whiskers correspond to the median, first and third quartiles, and the 1.5x interquartile range, respectively. Sample sizes for each stratification across all dot plots are shown below x-axis labels, with individual data points being patient samples and superimposed over each boxplot. For all boxplots shown in b, d, and f, P-values indicate the significance of difference between groups evaluated using an unpaired two-sided Wilcoxon rank sum test, with Benjamini-Hochberg correction for multiple comparisons.
Fig. 5
Fig. 5. UniCell assists in rapid annotation of an integrated scRNA-seq Non-Small Cell Lung Cancer (NSCLC) dataset.
a Visualization demonstrating the basic steps underlying NSCLC sample collection, processing, and analysis using UniCell Deconvolve Base (UCDBase). b UMAP visualization of human lung cancer biopsy single cells, annotated by unsupervised leiden cluster (left) and sample of origin (right). c UMAP visualization of cell type labels applied for each leiden cluster using UCDBase deconvolution results to guide annotation. d UCDBase predictions are used to separate normal from malignant epithelium. UMAP visualization showing probability of malignant lung adenocarcinoma (LUAD) cells initially co-clustering with cells labeled as normal epithelium (left). Re-clustering select subpopulation reveals two major clusters separating by sample of origin, Adjacent Normal or Tumor (right upper). Visualizing UCDBase LUAD probabilities on re-clustered cells demonstrates Tumor-specific cluster contains the majority of predicted LUAD malignant cells. e UMAP visualization showing probabilities of four major lung normal epithelial cell types distributed across re-clustered cells. f Box plots of feature attribution weights (x-axis) for genes (y-axis) indicative of LUAD malignant cells learned by UCDBase. Sample size (n = 1576) reflects the total number of single cells annotated as malignant LUAD. For boxplots, center line, box limits and box whiskers correspond to the median, first and third quartiles, and the 1.5x interquartile range, respectively. Individual data points representing single cells are superimposed over each boxplot (Source Data File—Fig. 5f).
Fig. 6
Fig. 6. Summary of UniCell data collection, training mixture generation, foundation model architecture, and transfer learning strategy.
a Depicted on the left is a flow chart summarizing the training data collection strategy. Candidate studies are first indexed from several primary and secondary data sources. Raw data is downloaded from respective source locations, and processed through an ETL engine where the output represents a standardized single cell count matrix. GPU accelerated post processing is performed, resulting in a normalized single cell expression profile. The number of studies indexed and total number of cells profiled (y-axis) is shown as a histogram on the right, within 3 month interval buckets (x-axis). b Each normalized single cell expression profile is utilized to form training data in the form of single cell mixtures, whereby random subsets of cells from across studies are selected (see flow chart on left) and averaged together to create mixed expression vectors of known cell type fractions. Expression vectors are fed into a deep learning model trained to predict the known cell type fraction. The basic elements and structure of the UniCell Deconvolve Base model are shown in the flow chart. On the right, an overview of the training process is shown. The y-axis represents either model loss or coefficient of determination (R2) while the x-axis represents training epoch, where one epoch represents a single full cycle through training dataset. Each colored line corresponds to a different size of training dataset (250 K, 1 M, 3 M, or 10 M synthetic mixtures). Solid lines represent model performance on the training dataset, while dashed lines represent model performance on test dataset. c Users have the option of supplying a contextualized reference profile, which is used in conjunction with embeddings obtained from UCD Base acting as a universal cell state feature extractor. A regression model is then trained using processed embeddings, yielding a fine-tuned transfer learning model applicable to user-specific use cases. Details of the transfer learning model architecture are shown in the corresponding flow chart.

References

    1. Casamassimi A, Federico A, Rienzo M, Esposito S, Ciccodicola A. Transcriptome profiling in human diseases: new advances and perspectives. Int. J. Mol. Sci. 2017;18:1652. doi: 10.3390/ijms18081652. - DOI - PMC - PubMed
    1. Nomura S. Single-cell genomics to understand disease pathogenesis. J. Hum. Genet. 2021;66:75–84. doi: 10.1038/s10038-020-00844-3. - DOI - PMC - PubMed
    1. Xia C, Fan J, Emanuel G, Hao J, Zhuang X. Spatial transcriptome profiling by MERFISH reveals subcellular RNA compartmentalization and cell cycle-dependent gene expression. Proc. Natl Acad. Sci. USA. 2019;116:19490–19499. doi: 10.1073/pnas.1912459116. - DOI - PMC - PubMed
    1. Goh JJL, et al. Highly specific multiplexed RNA imaging in tissues with split-FISH. Nat. Methods. 2020;17:689–693. doi: 10.1038/s41592-020-0858-0. - DOI - PubMed
    1. Nguyen HQ, et al. 3D mapping and accelerated super-resolution imaging of the human genome using in situ sequencing. Nat. Methods. 2020;17:822–832. doi: 10.1038/s41592-020-0890-0. - DOI - PMC - PubMed

MeSH terms