. 2023 Mar 11;14(1):1348.
doi: 10.1038/s41467-023-37055-1.

Microbiota alters the metabolome in an age- and sex- dependent manner in mice

Affiliations

Microbiota alters the metabolome in an age- and sex- dependent manner in mice

Kirsty Brown et al. Nat Commun. .

Abstract

Commensal bacteria are major contributors to mammalian metabolism. We used liquid chromatography mass spectrometry to study the metabolomes of germ-free, gnotobiotic, and specific-pathogen-free mice, while also evaluating the influence of age and sex on metabolite profiles. Microbiota modified the metabolome of all body sites and accounted for the highest proportion of variation within the gastrointestinal tract. Microbiota and age explained similar amounts of variation the metabolome of urine, serum, and peritoneal fluid, while age was the primary driver of variation in the liver and spleen. Although sex explained the least amount of variation at all sites, it had a significant impact on all sites except the ileum. Collectively, these data illustrate the interplay between microbiota, age, and sex in the metabolic phenotypes of diverse body sites. This provides a framework for interpreting complex metabolic phenotypes and will help guide future studies into the role that the microbiome plays in disease.


Conflict of interest statement

The authors declare no competing interests.

Figures

Fig. 1
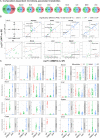
Fig. 1. Anatomical survey of intestinal tract metabolism.
A Heatmap depicting the 40 most variable metabolites in samples from luminal content of the jejunum, ileum, cecum, and colon. B Scatterplots showing the average relative abundance of carbohydrates, nucleosides, amino acids, and fatty acids that were differentially abundant along the GIT. Samples are ordered as indicated with a total of n = 72 samples/site (equal representation from male and female mice, GF, OMM12 and SPF colonized mice and 3-, 8- and 12-week-old mice). GF germ-free, OMM12 Oligo-MM12, SPF specific pathogen free, M male, F female. Source data are provided as a Source Data file.
Fig. 2
Fig. 2. Contribution of microbiome, age, and sex to metabolism.
A Estimated proportion of variation explained by microbiota, age and sex in each site sampled based on PERMANOVA statistics. B Proportion of metabolites altered (PAdj <0.05) by microbiome, age, and sex at each site. C Partial R2 showing the relative contribution of age, microbiota, and sex in explaining the variation in metabolite abundance at each site. Metabolites shown are the 20 metabolites where the most variation was explained by the three factors, full heatmap for all metabolites is shown in Supplementary Figure 1. Data is representative of n = 72 samples / site (equal representation from male and female mice, GF, OMM12 and SPF colonized mice and 3-, 8- and 12-week-old mice). P.F. = peritoneal fluid. Parts of Fig. 2A were generated using Biorender.org under license. Source data are provided as a Source Data file.
Fig. 3
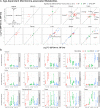
Fig. 3. Impact of microbial composition on metabolism.
A Number of metabolites that are differentially abundant (PAdj <0.05) in OMM12 vs. GF (red), SPF vs. GF (green) and OMM12 & SPF vs. GF (blue) in each sample site. B Biplot showing the Log2FC in SPF vs. GF and OMM12 vs. GF in metabolites that were significantly different (PAdj <0.05) from GF in either colonization (red dots = OMM12, green dots = SPF) or both colonizations (blue dots). C Violin plots of highlighted metabolites from B. Data represents 24 mice per group with equal representation from male and female mice and mice that are 3-, 8-, and 12- weeks of age. GF germ-free, OMM12 = Oligo-MM12, SPF-specific pathogen free. Source data are provided as a Source Data file.
Fig. 4
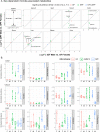
Fig. 4. Age-specific changes in microbiome-associated metabolism.
A Biplot showing the Log2FC in metabolites that were significantly different (PAdj <0.05) in 3-week-old vs. 8-week-old SPF mice or 3-week-old vs. 8-week-old GF mice. Metabolites were significantly different based on age in GF (red) or SPF (green) or both GF and SPF (blue). B Violin plots of highlighted metabolites from A that are differentially affected by colonization in young and adult mice. Data shown for GF, OMM12 and SPF colonized mice. Data represent 8 mice / group (n = 4 F and n = 4 M). P.F. peritoneal fluid. GF germ-free, OMM12 Oligo-MM12, SPF specific pathogen free, M male, F female. Source data are provided as a Source Data file.
Fig. 5
Fig. 5. Sex-specific changes in microbiota-associated metabolism.
A Biplot showing the Log2FC in metabolites that were significantly different (PAdj <0.05) in male vs. female SPF mice or male vs. female GF mice. Metabolites were significantly different based on age in either GF (red) or SPF (green) or in both GF and SPF (blue). B Violin plots of highlighted metabolites from A that are differentially affected by colonization in male and female mice. Data shown for GF, OMM12 and SPF colonized male and female mice. Data represented 8 mice/group. GF germ-free, OMM12 Oligo-MM12, SPF specific pathogen free, F female, M male. Source data are provided as a Source Data file.

References

    1. Judge A, Dodd MS. Metabolism. Essays Biochem. 2020;64:607–647. doi: 10.1042/EBC20190041. - DOI - PMC - PubMed
    1. Harding VJ. Metabolism in Pregnancy. Physiol. Rev. 1925;5:279–301. doi: 10.1152/physrev.1925.5.3.279. - DOI
    1. M. Kleiber, The fire of life: An introduction to animal energetics. (John Wiley & Sons, Inc., New York: London, 1961).
    1. P. J. Jurtshuk, in Medical Microbiology, S. Baron, Ed. (Galveston, TX, USA, 1996).
    1. Putnam EE, Goodman AL. B vitamin acquisition by gut commensal bacteria. PLoS Pathog. 2020;16:e1008208. doi: 10.1371/journal.ppat.1008208. - DOI - PMC - PubMed

Publication types

Grants and funding