. 2023 Mar 11;14(1):1353.
doi: 10.1038/s41467-023-37095-7.

Short-term molecular consequences of chromosome mis-segregation for genome stability

Affiliations

Short-term molecular consequences of chromosome mis-segregation for genome stability

Lorenza Garribba et al. Nat Commun. .

Abstract

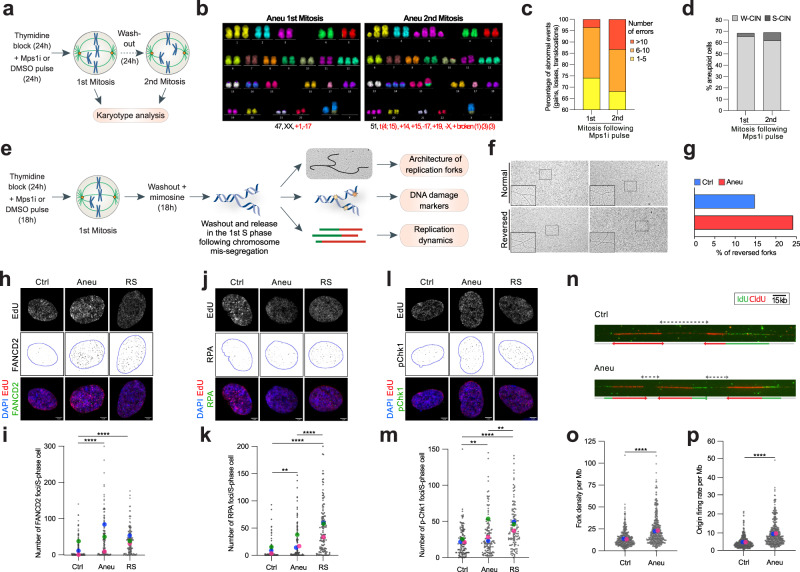
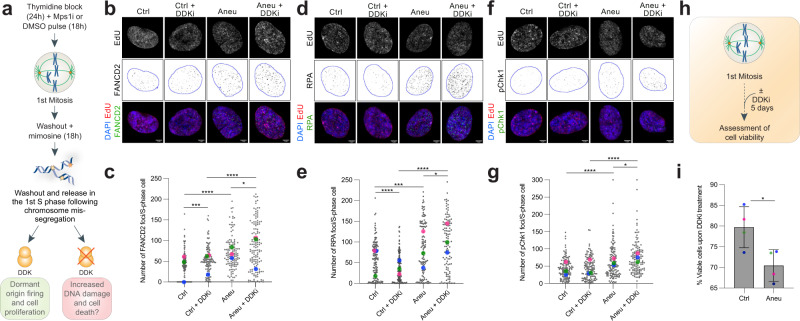
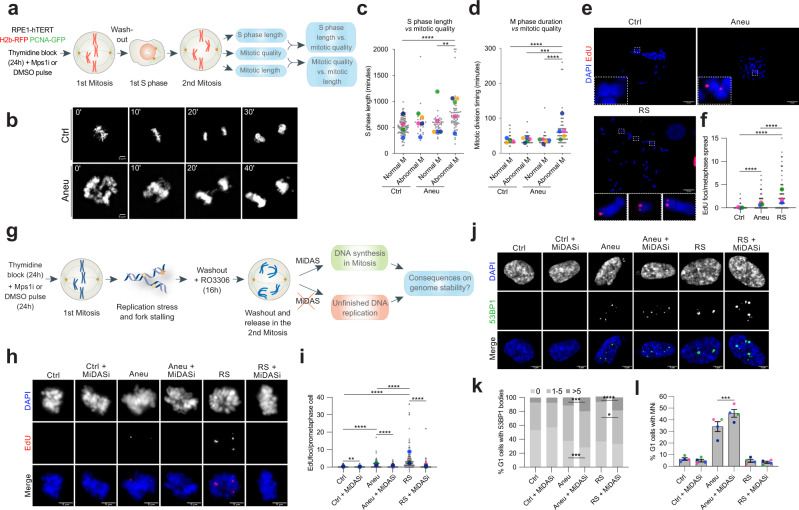
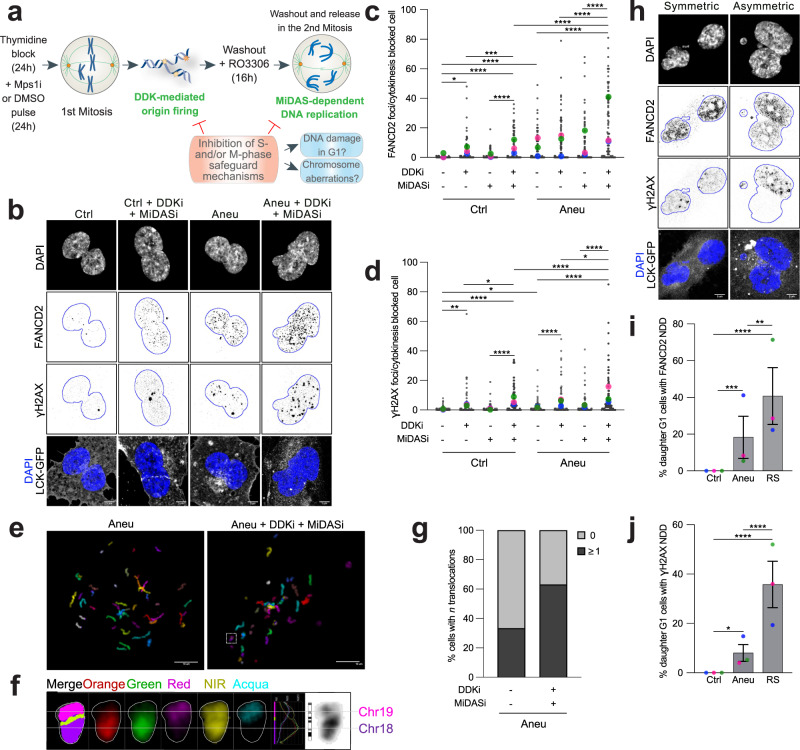
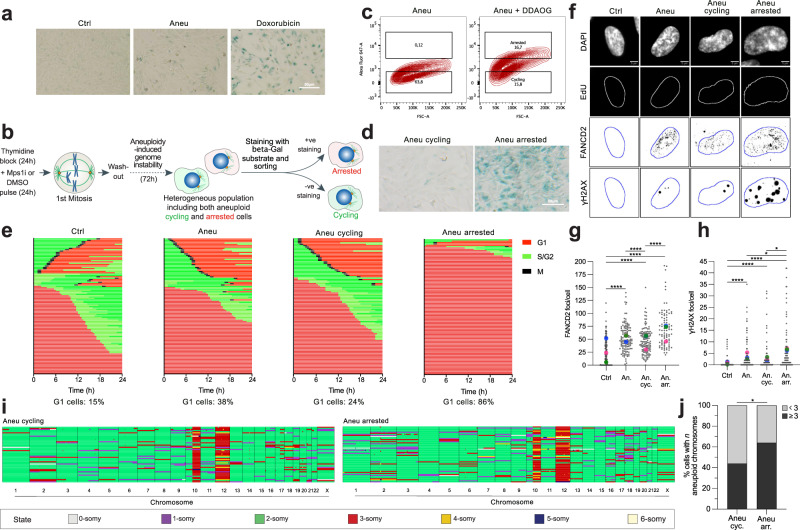
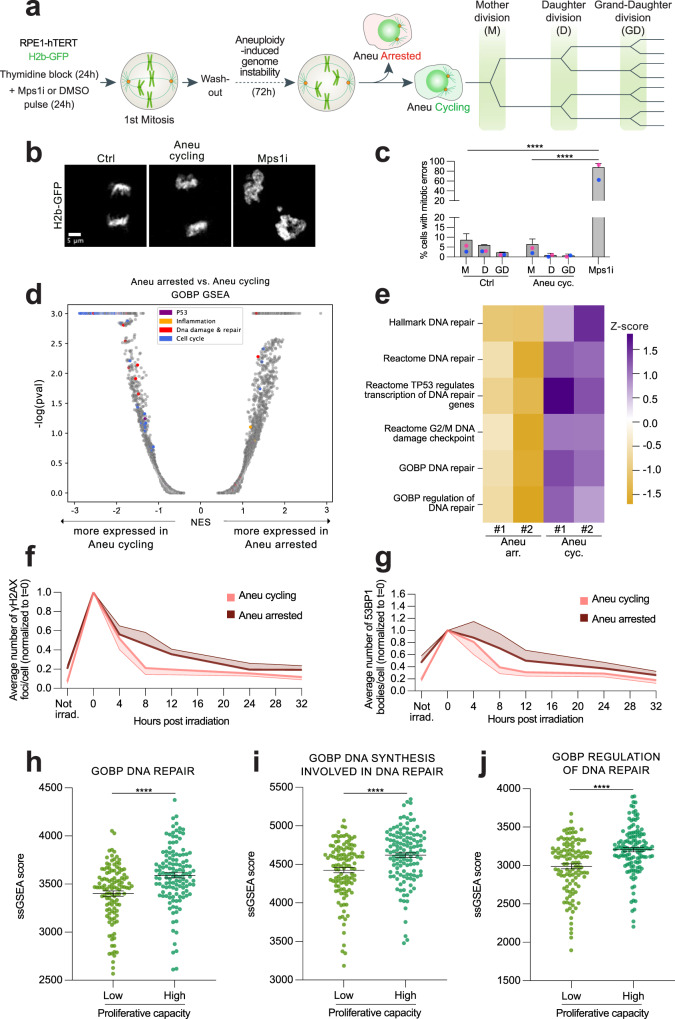
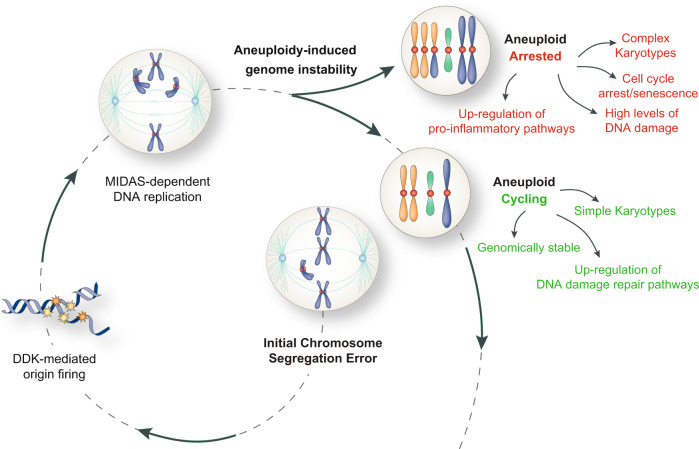
Chromosome instability (CIN) is the most common form of genome instability and is a hallmark of cancer. CIN invariably leads to aneuploidy, a state of karyotype imbalance. Here, we show that aneuploidy can also trigger CIN. We found that aneuploid cells experience DNA replication stress in their first S-phase and precipitate in a state of continuous CIN. This generates a repertoire of genetically diverse cells with structural chromosomal abnormalities that can either continue proliferating or stop dividing. Cycling aneuploid cells display lower karyotype complexity compared to the arrested ones and increased expression of DNA repair signatures. Interestingly, the same signatures are upregulated in highly-proliferative cancer cells, which might enable them to proliferate despite the disadvantage conferred by aneuploidy-induced CIN. Altogether, our study reveals the short-term origins of CIN following aneuploidy and indicates the aneuploid state of cancer cells as a point mutation-independent source of genome instability, providing an explanation for aneuploidy occurrence in tumors.


Conflict of interest statement

The authors declare no competing interests.

Figures

Fig. 1
Fig. 1. Aneuploid cells accumulate increasing genome instability and display higher levels of DNA replication stress markers in S-phase.
a Experimental setup for the analysis of genome instability of cells obtained from the 1st and the 2nd mitosis. Karyotype aberrations were assessed by mFISH analysis (see “Methods” for more details). Representative mFISH images (b) of karyotypes obtained from the 1st (n = 68) and the 2nd mitosis (n = 98) in aneuploid cells and relative quantification (c). Y axis shown from 60 to 100% for clarity (from 0 to 60%—and above—cells have 1–5 abnormal events, as indicated in key legend). T(10,X) and +12 were excluded from the analysis as they are clonal in hTERT RPE-1 cells. d Quantification of aneuploid cells with either numerical (W-CIN) or structural (S-CIN) aneuploidy in aneuploid cells obtained from the 1st (n = 68) and the 2nd mitosis (n = 98). e Schematic representation of the experimental approaches used for the study of the 1st S-phase after induction of chromosome missegregation. A short EdU pulse was performed before cell harvest in order to label S-phase cells to be analyzed by immunofluorescence. Representative images of normal and reversed replication forks (f) analyzed by electron microscopy and quantification (g) of the reversed ones in control (n = 108) and aneuploid (n = 95) cells. Representative images (h) and quantification (i) of FANCD2 foci per S-phase cell in control (n = 181) and aneuploid (n = 148) cells. **** indicates p < 0.0001. Representative images (j) and quantification (k) of RPA foci per S-phase cell in control (n = 133) and aneuploid (n = 136) cells. ** indicates p = 0.0015 and **** indicates p < 0.0001. Representative images (l) and quantification (m) of pChk1 foci per S-phase cell in control (n = 129) and aneuploid (n = 134) cells. ** indicates p = 0.0031 (Ctrl vs Aneu) or p = 0.0013 (Aneu vs RS) and **** indicates p < 0.0001. Cells treated with aphidicolin (RS, replication stress) were used as a positive control (n = 144 for (i), n = 137 for (k) and n = 131 for (m)). n Representative images of DNA fiber analysis in control and aneuploid cells. o,p, Quantification of fork density per Mb (o) and origin firing rate (p) per Mb in control (n = 411) and aneuploid (n = 425) cells. **** indicates p < 0.0001. Ctrl, control (DMSO pulsed). Aneu, aneuploid cells (Mps1 inhibitor pulsed). RS, replication stress (aphidicolin treated cells). W-CIN, numerical chromosomal instability. S-CIN, structural chromosomal instability. Scale bars, 5 μm. LUT was inverted for FANCD2, RPA and pChk1 images. Blue borders in images are based on DAPI staining and define nuclei. Data are means of three biological replicates, except for the EM (one replicate) and the DNA fiber analysis (two replicates). Two-sided Chi square test was performed for data in (c) Two-tailed unpaired Student’s t test was performed for data in (i, k, m, o, p). In graphs, average values for each biological replicate are shown by colored dots (each color corresponds to a different biological replicate). Source Data are provided as a Source Data file. Drawings of schemes were made by partially utilizing extracts of figures published elsewhere.
Fig. 2
Fig. 2. DDK protects aneuploid cells from DNA damage accumulation and consequent cell death.
a Experimental workflow for the analysis of DNA replication stress markers in S-phase cells upon treatment with the DDK inhibitor XL-413. A short EdU pulse was performed before cell harvest in order to label S-phase cells. Representative images (b) and quantification (c) of FANCD2 foci per S-phase cell in control or aneuploid cells ±DDK inhibitor (n = 123 for Ctrl, n = 125 for Ctrl+DDKi, n = 126 for Aneu, n = 137 for Aneu+DDKi). * indicates p = 0.0203, *** indicates p = 0.0002 and **** indicates p < 0.0001. Representative images (d) and quantification (e) of RPA foci per S-phase cell in control or aneuploid cells ±DDK inhibitor (n = 136 for Ctrl, n = 134 for Ctrl+DDKi, n = 119 for Aneu, n = 118 for Aneu+DDKi). * indicates = 0.0108, *** indicates p = 0.0001 and **** indicates p < 0.0001. Representative images (f) and quantification (g) of pChk1 foci per S-phase cell in control or aneuploid cells ±DDK inhibitor (n = 127 for Ctrl, n = 132 for Ctrl+DDKi; n = 131 for Aneu; n = 128 for Aneu+DDKi). * indicates p = 0.0449 and **** indicates p < 0.0001. h Experimental workflow for the assessment of cell viability upon exposure to the DDK inhibitor. i Quantification of live cells upon DDK inhibitor treatment in control and aneuploid cells (for each sample, values were normalized to the untreated control). n = 4 independent experiments. * indicates p = 0.0251. Ctrl, control (DMSO pulsed). Aneu, aneuploid cells (Mps1 inhibitor pulsed). DDKi, DDK inhibitor. Scale bars, 5 μm. LUT was inverted for FANCD2, RPA and pChk1 images. Blue borders in images are based on DAPI staining and define nuclei. Data are means of at least three biological replicates. Error bars in panel i represent SEMs. Two-tailed unpaired Student’s t test was performed for data in (c, e, g and i). In graphs, average values for each biological replicate are shown by colored dots (each color corresponds to a different biological replicate). Source Data are provided as a Source Data file. Drawings of schemes were made by partially utilizing extracts of figures published elsewhere.
Fig. 3
Fig. 3. MiDAS protects aneuploid cells from a further increase in their genome instability.
a Experimental workflow for the analysis of the 1st S-phase duration, 2nd M phase duration and quality by live-cell imaging in hTERT RPE-1 cells expressing H2b-RFP and PCNA-GFP. b Representative images from the movies of mitosis duration and quality in control and aneuploid cells. For illustration purposes, images were deconvoluted by using the Huygens software using the deconvolution express function. Correlation between (c) S-phase duration and quality of the subsequent mitosis and (d) mitotic timing and mitotic quality in control (for (c): n = 98 for Ctrl Normal M, n = 27 for Ctrl Abnormal M; for (d): n = 98 for Ctrl Normal M, n = 34 for Ctrl Abnormal M) and aneuploid (for (c): n = 43 for Aneu Normal M, n = 63 for Aneu Abnormal M; for (d): n = 43 for Aneu Normal M, n = 62 for Aneu Abnormal M) cells. Representative images (e) and quantification (f) of EdU incorporation on metaphase spreads in control (n = 129) and aneuploid (n = 167) cells. Cells treated with aphidicolin (RS, replication stress) were used as a positive control (n = 106). **** indicates p < 0.0001. g Experimental workflow for the assessment of genome instability in the following G1 phase upon MiDAS inhibition. Representative images (h) and quantification (i) of EdU incorporation in prometaphase cells upon MiDAS inhibition (n = 130 for Ctrl, n = 113 for Ctrl+MiDASi, n = 156 for Aneu, n = 116 for Aneu+MiDASi). Cells treated with aphidicolin (RS, replication stress) were used as a positive control (n = 111 for RS, n = 91 for RS + MiDASi). ** indicates p = 0.0081 and **** indicates p < 0.0001. Representative images (j) and quantification of 53BP1 body (k) and micronucleus (l) accumulation in G1 cells following inhibition of MiDAS (for (k): n = 544 for Ctrl, n = 518 for Ctrl + MiDASi, n = 543 for Aneu, n = 613 for Aneu + MiDASi, n = 446 for RS, n = 431 for RS + MiDASi. For (l): n = 556 for Ctrl, n = 643 for Ctrl + MiDASi, n = 543 for Aneu, n = 641 for Aneu + MiDASi, n = 397 for RS, n = 416 for RS + MiDASi). In (k), * indicates p = 0.0121; *** indicates p = 0,0007 (Aneu vs Aneu + MiDASi with 0 53BP1 bodies) or p = 0.0001 (Aneu vs Aneu + MiDASi with >5 53BP1 bodies); **** indicates p < 0,0001. In (l), *** indicates p = 0,0001. Ctrl, control (DMSO pulsed). Aneu, aneuploid cells (Mps1 inhibitor pulsed). RS, replication stress (aphidicolin treated cells). MiDASi, MiDAS inhibitor. Normal M, normal mitosis. Abnormal M, abnormal mitosis. Scale bars, 5 or 10 μm. Data are means of at least three biological replicates. Error bars in (l) represent SEMs. Two-tailed unpaired Student’s t test was performed for data in (c, d, f and i). Two-sided Chi square test was performed for data in (k) and (l). In graphs, average values for each biological replicate are shown by colored dots (each color corresponds to a different biological replicate). Source Data are provided as a Source Data file. Drawings of schemes were made by partially utilizing extracts of figures published elsewhere.
Fig. 4
Fig. 4. DDK and MiDAS act as surveillance mechanisms to limit genome instability accumulation in aneuploid cells.
a Experimental workflow for the analysis of DNA damage and chromosome aberrations in G1 cells following DDK and MiDAS inhibition in the cell cycle after chromosome missegregation induction. Representative images (b) and quantification of FANCD2 (c) and γH2AX (d) accumulation in cytokinesis-blocked pseudo-G1 cells expressing LCK-GFP (for FANCD2: n = 90 for Ctrl, n = 72 for Ctrl+DDKi; n = 84 for Ctrl+MiDASi, n = 81 for Ctrl+DDKi+MiDASi; n = 87 for Aneu, n = 88 for Aneu+DDKi, n = 90 for Aneu+MiDASi, n = 86 for Aneu+DDKi+MiDASi. For γH2AX: n = 90 for Ctrl, n = 72 for Ctrl+DDKi; n = 84 for Ctrl+MiDASi, n = 81 for Ctrl+DDKi+MiDASi; n = 88 for Aneu, n = 93 for Aneu+DDKi, n = 95 for Aneu+MiDASi, n = 90 for Aneu+DDKi+MiDASi.). In (c), * indicates p = 0,0113, *** indicates p = 0.0003 and **** indicates p < 0,0001. In (d), * indicates p = 0,0122 (Ctrl vs Aneu) or p = 0.0152 (Ctrl+DDKi vs Ctrl+DDKi+MiDASi) or p = 0.0242 (Aneu+DDKi vs Aneu+DDKi+MiDASi); ** indicates p = 0.0055 and **** indicates p < 0,0001. e Representative mFISH images of G1 cell-derived metaphase-like chromosomes from aneuploid cells upon DDK and MiDAS inhibition. f Zoomed image of the chromosome highlighted in the dotted-line box in (e) (image on the right) from the aneuploid sample in which DDK and MiDAS were inhibited showing a translocation between chromosome 19 and chromosome 18. g Quantification of the percentage of cells with more than 1 translocation in the two samples (n = 18 for Aneu, n = 19 for Aneu+DDKi+MiDASi). Representative images (h) and quantification of FANCD2 (i) and γH2AX (j) non-random distribution between the daughter pseudo-G1 cells (for FANCD2: n = 86 for Ctrl, n = 78 for Aneu. For γH2AX: n = 90 for Ctrl, n = 90 for Aneu). Cells treated with aphidicolin (RS, replication stress) were used as a positive control (n = 46 for FANCD2 and n = 81 for γH2AX). In (i), ** indicates p = 0.0021, *** indicates p = 0.0002 and **** indicates p < 0.0001. In (j), * indicates p = 0.0138 and **** indicates p < 0.0001. Ctrl, control (DMSO pulsed). Aneu, aneuploid cells (Mps1 inhibitor pulsed). RS, replication stress (aphidicolin treated cells). DDKi, DDK inhibitor. MiDASi, MiDAS inhibitor. NDD, non-random distribution. Scale bars, 5 or 10 μm. LUT was inverted for FANCD2 and γH2AX images. Blue borders in images are based on DAPI staining and define nuclei. Data are means of at least three biological replicates, except for data in (eg) that were obtained from three biological replicates. Error bars in (i) and (j) represent SEMs. Two-tailed unpaired Student’s t test was performed for data in (c) and (d). Two-sided Fisher’s test was performed for data in (i) and (j). In graphs, average values for each biological replicate are shown by colored dots (each color corresponds to a different biological replicate). Source Data are provided as a Source Data file. Drawings of schemes were made by partially utilizing extracts of figures published elsewhere.
Fig. 5
Fig. 5. Aneuploid cells that retained their proliferative capacity exhibit reduced levels of DNA damage and genome instability.
a Senescence-associated β-galactosidase staining in control and aneuploid cells. Doxorubicin-treated cells were used as a positive control. N = 3 independent experiments. b Experimental workflow for a method to separate and recover both cycling and arrested aneuploid cells based on FACS-sorting and the usage of a fluorescent substrate of the b-galactosidase enzyme. c FACS profiles showing the percentage of DDAOG-positive cells in aneuploid cells incubated or not with the DDAOG substrate. d Senescence-associated β-galactosidase staining in cycling and arrested aneuploid cells obtained after sorting. N = 3 independent experiments. e Cell cycle profiles of control, aneuploid, aneuploid cycling and aneuploid arrested FUCCI-cells analyzed by live-cell imaging and quantification of percentage of G1 cells in the four samples (n = 100 for each sample). Representative images (f) and quantification of FANCD2 (g) and γH2AX (h) foci per cell in the different samples. Only EdU negative cells were analyzed in order to exclude the contribution of S-phase cells present in the non-arrested cell samples (n = 123 for Ctrl, n = 123 for Aneu, n = 123 for Aneu cyc, n = 89 for Aneu arr). In (g) and (h), **** indicates p < 0,0001. In (h), * indicates p = 0.0439 (Aneu vs Aneu cycling) or p = 0.0123 (Aneu cycling vs Aneu arrested). I scWGS of cycling and arrested aneuploid cells. Single cells are represented in rows and chromosomes are plotted as columns (n = 50 for Aneu cyc, n = 53 for Aneu arr). Copy-number states are indicated in colors (see legend at the bottom). hTERT RPE-1 cells have clonal gains of 10q and chromosome 12. J Quantification of cells with at least 3 aneuploid chromosomes in the two samples (n = 50 for Aneu cyc, n = 53 for Aneu arr). Gains of 10q and chromosome 12 were excluded from the analysis. * indicates p = 0.049. Ctrl, control (DMSO pulsed). Aneu or An, aneuploid cells (Mps1 inhibitor pulsed). Aneu cycling or An cyc, aneuploid cycling cells. Aneu arrested or An arr, aneuploid arrested cells. Scale bars, 5 or 50 μm. LUT was inverted for FANCD2 and γH2AX images. Blue borders in images are based on DAPI staining and define nuclei. Data are means of three biological replicates, except for panel e (one replicate) and j (two replicates). Two-tailed unpaired Student’s t test was performed for data in (g) and (h). Two-sided Fisher’s test was performed for data in (j). In graphs, average values for each biological replicate are shown by colored dots (each color corresponds to a different biological replicate). Source Data are provided as a Source Data file. Drawings of schemes were made by partially utilizing extracts of figures published elsewhere.
Fig. 6
Fig. 6. Cycling aneuploid cells display decreased karyotype aberrations and upregulate DNA repair genes in comparison with arrested aneuploid cells.
a Experimental workflow for the assessment of genome instability levels by live-cell imaging in aneuploid cycling cells expressing H2b-GFP. b Representative images of cell divisions in the different samples. For illustration purposes, images were deconvoluted by using the Huygens software using the deconvolution express function. c Quantification of mitotic errors in 3 cell division rounds in control (n = 187) and aneuploid cycling (n = 274) cells. Cells treated with the Mps1 inhibitor just before starting the time-lapse were used as a positive control for mitotic errors (n = 83). **** indicates p < 0.0001. d Volcano plot illustrating the differentially expressed pathways between cycling and arrested aneuploid cells. Specific gene sets are highlighted in color. Significance was determined with an empirical p value, calculated using 1000 permutations, using the default GSEA parameters. P values were adjusted for multiple testing using the FDR method. e Heat-map showing the z-scores of single-sample GSEA (ssGSEA) scores for DNA damage-related gene sets. Quantification of γH2AX foci (f) and 53BP1 bodies (g) in cycling (n = 150) and arrested aneuploid (n = 150) cells upon IR exposure. Only EdU negative cells were analyzed in order to exclude the contribution of S-phase cells present in the non-arrested cell samples. Association between ssGSEA score for GOBP DNA repair (h) or GOBP DNA synthesis involved in DNA repair (i) or GOBP regulation of DNA repair (j) and proliferation capacity in top vs. bottom quartiles of cancer cell lines from. **** indicates p < 0.0001. Ctrl, control (DMSO pulsed). Aneu cycling or cyc, aneuploid cycling cells. Aneu arrested or arr, aneuploid arrested cells. M, mother division. D, daughter division. GD, grand-daughter division. Mps1i, Mps1 inhibitor. In (e), #1 and #2 refer to biological replicates. Not irrad., not irradiated. Data are means of two biological replicates, except for data in (f) and (g) (three replicates). Error bars represent SEMs. Shaded error bands in (f), (g) are shown above and below for arrested and cycling cells, respectively. Two-sided Fisher’s test was performed for data in (c). Two-tailed paired t test was performed for data in (f) and (g). Two-tailed Mann–Whitney test was performed for data in (hj). In (c), average values for each biological replicate are shown by colored dots (each color corresponds to a different biological replicate). Source Data are provided as a Source Data file. Drawings of schemes were made by partially utilizing extracts of figures published elsewhere.
Fig. 7
Fig. 7. Final model.
A model for how aneuploidy induces genome instability and its consequences. See text for more details. Drawings of schemes were made by partially utilizing extracts of figures published elsewhere.

References

    1. Santaguida S, Amon A. Short- and long-term effects of chromosome mis-segregation and aneuploidy. Nat. Rev. Mol. Cell Biol. 2015;16:473–485. doi: 10.1038/nrm4025. - DOI - PubMed
    1. Ben-David U, Amon A. Context is everything: aneuploidy in cancer. Nat. Rev. Genet. 2020;21:44–62. doi: 10.1038/s41576-019-0171-x. - DOI - PubMed
    1. Ippolito MR, et al. Gene copy-number changes and chromosomal instability induced by aneuploidy confer resistance to chemotherapy. Dev. Cell. 2021;56:2440–2454.e6. doi: 10.1016/j.devcel.2021.07.006. - DOI - PubMed
    1. Lukow DA, et al. Chromosomal instability accelerates the evolution of resistance to anti-cancer therapies. Dev. Cell. 2021;56:2427–2439.e4. doi: 10.1016/j.devcel.2021.07.009. - DOI - PMC - PubMed
    1. Shoshani O, et al. Transient genomic instability drives tumorigenesis through accelerated clonal evolution. Genes Dev. 2021;35:1093–1109. doi: 10.1101/gad.348319.121. - DOI - PMC - PubMed

Publication types