. 2023 Apr;42(17):1360-1373.
doi: 10.1038/s41388-023-02631-8. Epub 2023 Mar 11.

UHRF1/UBE2L6/UBR4-mediated ubiquitination regulates EZH2 abundance and thereby melanocytic differentiation phenotypes in melanoma

Affiliations

UHRF1/UBE2L6/UBR4-mediated ubiquitination regulates EZH2 abundance and thereby melanocytic differentiation phenotypes in melanoma

Gamze Kuser-Abali et al. Oncogene. 2023 Apr.

Abstract

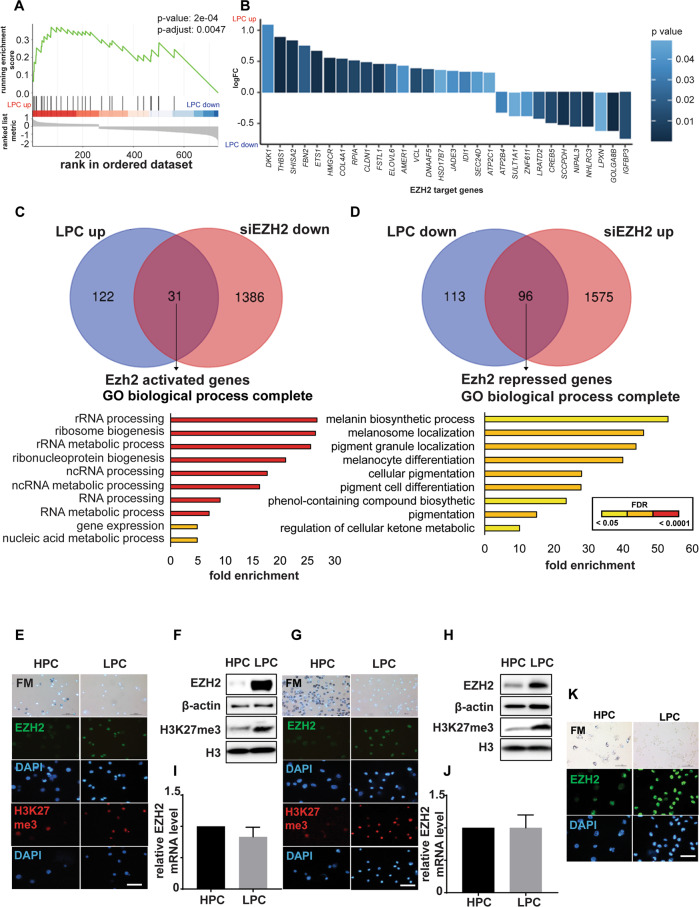
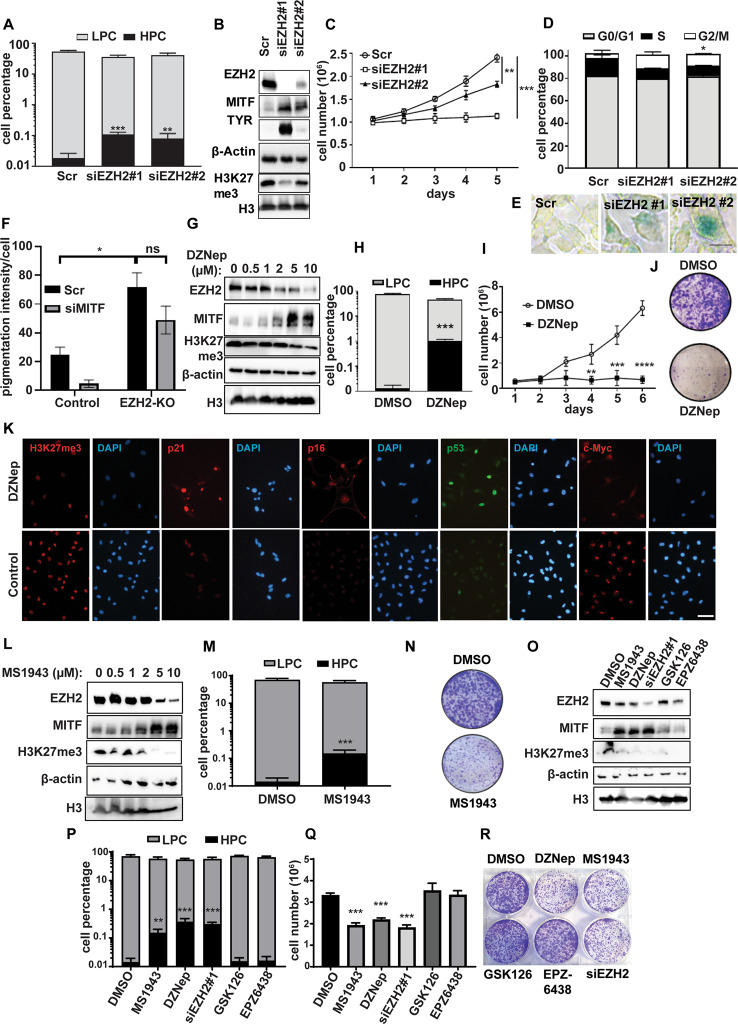
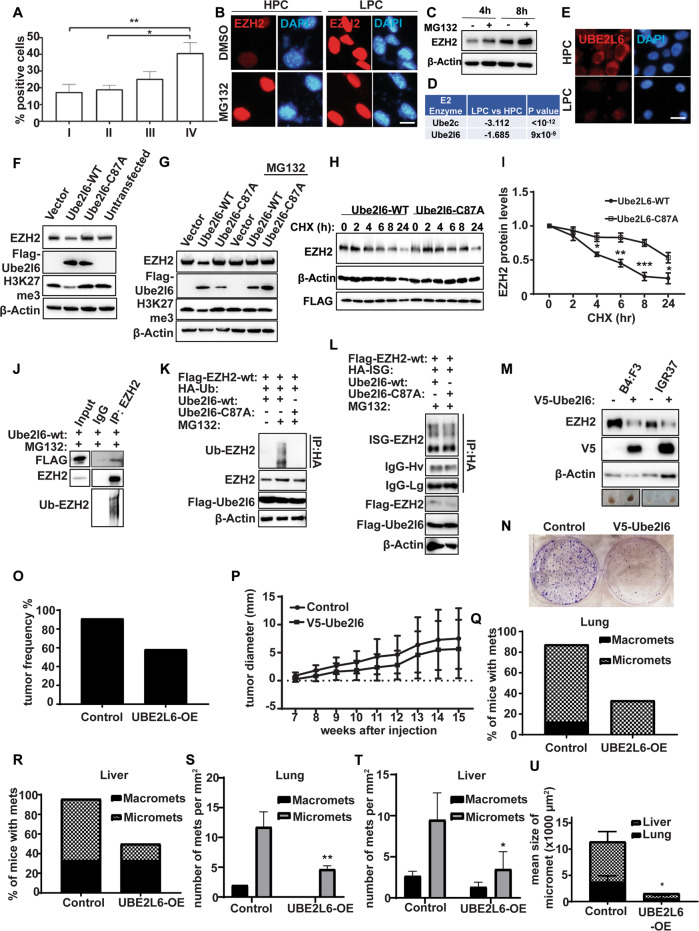
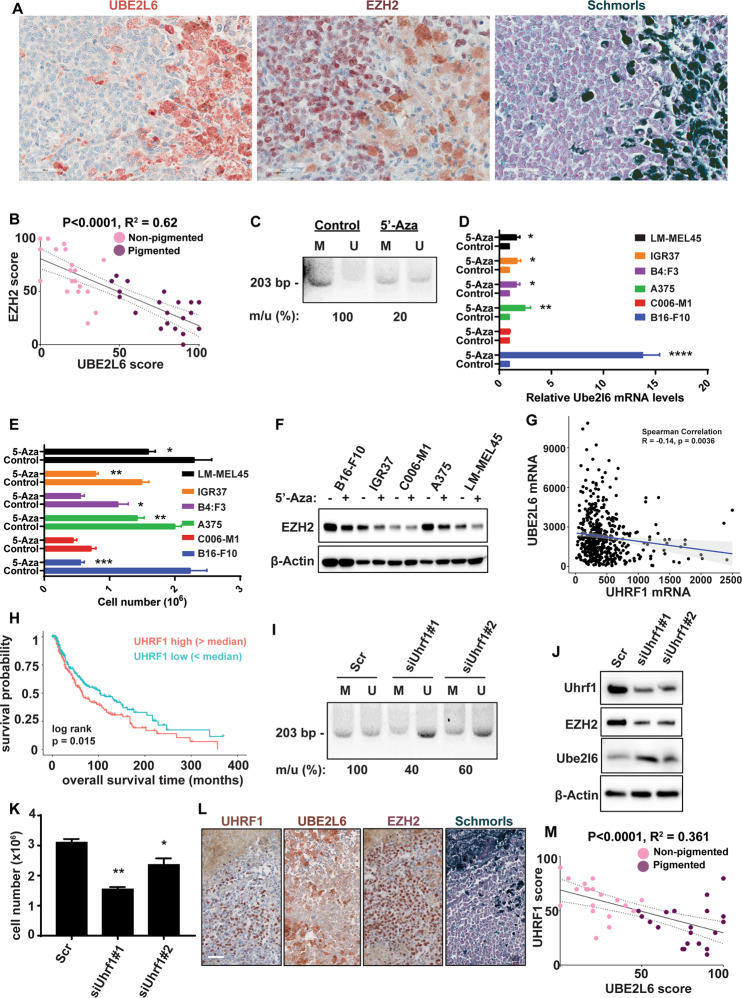
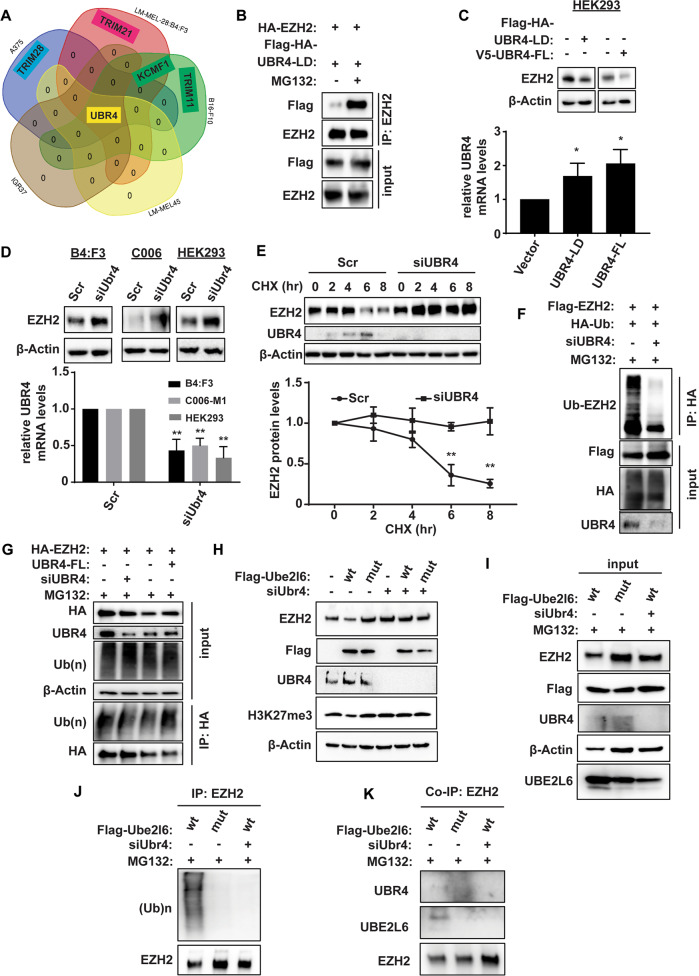
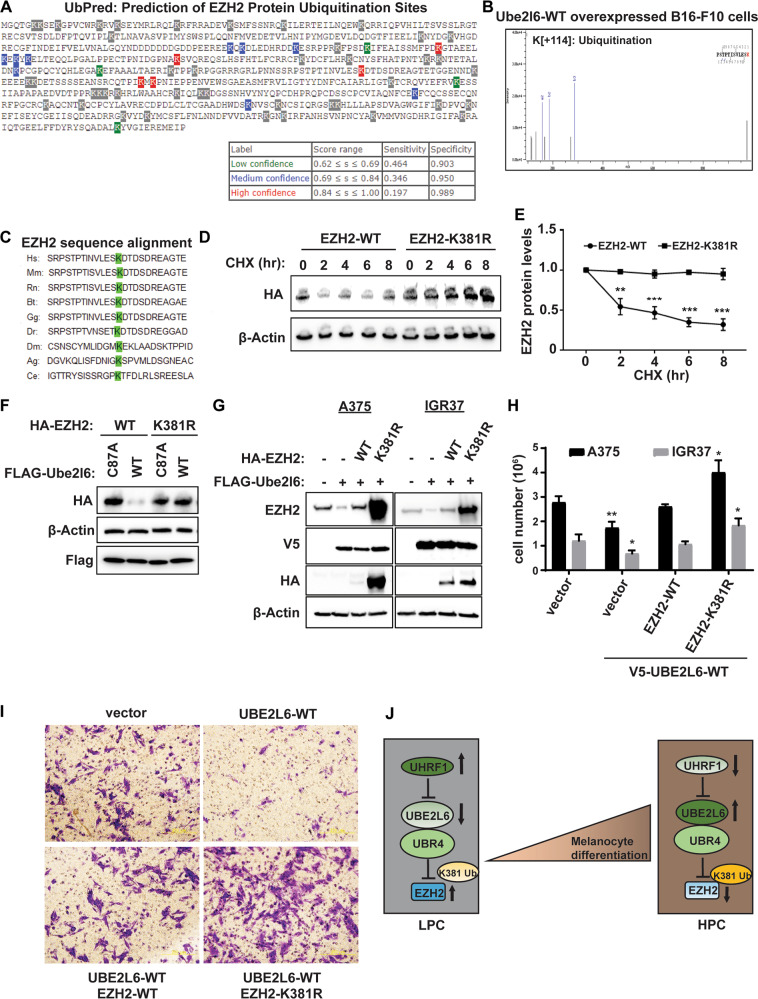
Cellular heterogeneity in cancer is linked to disease progression and therapy response, although mechanisms regulating distinct cellular states within tumors are not well understood. We identified melanin pigment content as a major source of cellular heterogeneity in melanoma and compared RNAseq data from high-pigmented (HPCs) and low-pigmented melanoma cells (LPCs), suggesting EZH2 as a master regulator of these states. EZH2 protein was found to be upregulated in LPCs and inversely correlated with melanin deposition in pigmented patient melanomas. Surprisingly, conventional EZH2 methyltransferase inhibitors, GSK126 and EPZ6438, had no effect on LPC survival, clonogenicity and pigmentation, despite fully inhibiting methyltransferase activity. In contrast, EZH2 silencing by siRNA or degradation by DZNep or MS1943 inhibited growth of LPCs and induced HPCs. As the proteasomal inhibitor MG132 induced EZH2 protein in HPCs, we evaluated ubiquitin pathway proteins in HPC vs LPCs. Biochemical assays and animal studies demonstrated that in LPCs, the E2-conjugating enzyme UBE2L6 depletes EZH2 protein in cooperation with UBR4, an E3 ligase, via ubiquitination at EZH2's K381 residue, and is downregulated in LPCs by UHRF1-mediated CpG methylation. Targeting UHRF1/UBE2L6/UBR4-mediated regulation of EZH2 offers potential for modulating the activity of this oncoprotein in contexts in which conventional EZH2 methyltransferase inhibitors are ineffective.


Conflict of interest statement

The authors declare no competing interests.

Figures

Fig. 1
Fig. 1. EZH2 protein, but not EZH2 mRNA, is upregulated in LPCs.
A Gene set enrichment analysis (GSEA) showing upregulated EZH2 targets in LPCs isolated from 28:B4:F3 cells. The EZH2 target genes were defined as down-regulated upon knockdown of EZH2 [51]. A positive normalized enrichment score (NES) indicates gene set enrichment at the top of the ranked list, which includes genes upregulated in LPC compared to HPC. B. EZH2 target genes that were differentially expressed between LPC and HCP. Positive logFC indicates upregulation in LPC. C, D Venn diagrams showing overlap of significantly upregulated (C) or downregulated (D) genes in B16-F10 LPCs relative to HPCs, and of siEzh2-downregulated (C) or upregulated (D) genes in parental B16-F10 cells relative to scramble controls (FDR-adjusted p-value < 0.05, upper panels). Lower bars show GO term enrichment analysis of the 31 (C) and 96 (D) common genes, showing enriched functions (FDR-adjusted p-value < 0.05, lower panel; colour indicates p-values adjusted by false discovery rate (FDR) via the Benjamini-Hochberg procedure). EJ Bright-field (BF) microscopy of Fontana-Masson staining (upper panel) and immunofluorescence (IF) images probed for EZH2 (green) and H3K27me3 (red) in HPCs and LPCs from 28:B4:F3 (E) and B16-F10 (G) cells. Nuclei shown by DAPI (blue; lower panels). Scale bars: 50 µm. To right of each set of images are shown endogenous EZH2 and H3K27me3 protein levels in HPCs and LPCs measured by western blot in (F) 28:B4:F3 and (H) B16-F10 cells, and EZH2 mRNA levels in HPCs and LPCs in (I) 28:B4:F3 and (J) B16-F10 cells. K BF microscopy of Fontana-Masson staining (upper panel) and IF images probed for EZH2 (green) and H3K27me3 (red) in HPCs and LPCs from a pigmented patient-derived xenograft melanoma. Nuclei shown by DAPI (blue; lower panels). Scale bar: 50 µm. n = 3 biological replicates.
Fig. 2
Fig. 2. Pharmacological inhibition of EZH2 abundance, but not of its methyltransferase activity, induces pigmented cell phenotypes in melanoma.
AE B16-F10 murine melanoma cells were transfected with either of two siRNAs against Ezh2 or scrambled controls, and analysed as follows: A HPC and LPC cell percentages assessed by flow cytometry, (B) Ezh2, Mitf, Tyr and H3K27me3 protein levels measured by western blot, including β-actin and H3 as loading controls, (C) cell growth measured by Trypan blue cell counting over 5 days, (D) cell cycle analysis measured by propidium iodide staining, and (E) cell senescence determined by β-gal staining (green). F Control and EZH2-KO 28:B4:F3 cells transfected with scrambled control or siMITF were stained with Fontana Masson to measure pigmentation. GK B16-F10 cells treated with 2 μM DZNep or DMSO (control) for 3 days were analysed for: (G) Ezh2, Mitf, and H3K27me3 expression by western blot, (H) HPC and LPC cell percentages by flow cytometry, (I) cell growth (7 days), (J) clonogenicity after low-density seeding (crystal violet stain), and (K) H3K27me3, p21, p16, p53, and c-Myc IF staining. Scale bar: 50 µm. LO B16-F10 cells were treated with 2 μM MS1943 or DMSO (control) for 3 days prior to: (L) Western blot analysis of Ezh2, Mitf, and H3K27me3 protein levels, (M) evaluation of HPC and LPC cell percentages by flow cytometry, (N) and clonogenicity after low-density seeding (crystal violet stain). OR B16-F10 cells were treated with 2 μM MS1943, 2 μM DZNep, siEzh2 #1, 2 µM GSK126, 2 µM EPZ6438 or DMSO (control) for 3 days prior to: (O) Western blot analysis of Ezh2, Tyr, and H3K27me3 expression, (P) evaluation of HPC and LPC cell percentages by flow cytometry, (Q) calculation of cell numbers counted by Trypan blue, and (R) clonogenicity estimation after low-density seeding (crystal violet stain). Clonogenicity was assessed in pre-treated (3 days) cells seeded at 2000 cells in 6-well plate followed by crystal violet staining (0.5% in methanol) after incubation for 10 days in drug-free media. Representative images of n = 3 biological replicates are shown for western blots (B, G, L, O), clonogenicity plates (J, N, R) and β-gal staining (E). Data for A, C, D, F, H, I, M, P and Q were derived from three independent experiments and are presented as means ± SD, analyzed by one-way ANOVA plus Tukey’s multiple comparison test. ns: non-significant. *p < 0.05, **p < 0.01, ***p < 0.001, ****p < 0.0001.
Fig. 3
Fig. 3. Ezh2 is proteasomally degraded via Ube2l6.
A EZH2 expression according to melanoma tumor stage in the Melanoma Research Victoria patient cohort. Stage I (n = 12 patients), Stage II (n = 10 patients), Stage III (n = 9 patients) and Stage IV (n = 8 patients). Data are presented as mean ± SD and analyzed by one-way ANOVA plus Tukey’s multiple comparison test. *p < 0.05, **p < 0.01. B Ezh2 (red) IF in HPCs and LPCs sorted from B16-F10 cells and treated with 10 µM MG132 or DMSO control for 16 h. DAPI (blue): nuclei. Scale bar: 10 µm. C Ezh2 protein levels determined by western blot in B16-F10 cells treated with 10 µM MG132 or DMSO control for 4 h or 8 h. D E2 ligases downregulated in RNAseq data from LPCs vs HPCs. E Ube2l6 IF in LPCs and HPCs from B16-F10 cells. Scale bar: 10 µm. F Ezh2 and H3K27me3 levels were determined by western blot in B16-F10 cells transfected with Flag-tagged Ube2l6-WT, Flag-tagged Ube2l6-C87A (enzyme-dead) or empty vector. (G) As in (F), with or without 10 µM MG132 treatment for 16 h. H Stability of endogenous Ezh2 protein determined by western blot in B16-F10 cells transfected with Flag-tagged Ube2l6-WT or Flag-tagged Ube2l6-C87A, followed by 50 µg/mL CHX treatment for the indicated times. I Densitometry for western blots shown in (H). Data from three independent experiments are presented as mean ± SD and were analyzed by one-way ANOVA plus Tukey’s multiple comparison test. *p < 0.05, **p < 0.01, ***p < 0.001. J Flag-tagged Ube2l6-WT was overexpressed in B16-F10 cells maintained in 10 µM MG132 for 16 h. Interactions between endogenous Ezh2 and Ube2l6 were determined by immunoprecipitation with anti-Ezh2 antibody followed by western blotting with anti-Flag antibody. K HEK293 cells were co-transfected with Flag-tagged EZH2 and Flag-tagged Ube2l6-WT or Flag-tagged Ube2l6-C87A, together with HA-tagged ubiquitin, or (L) HA-tagged ISG15 in the presence of 10 µM MG132. The ubiquitination (K) and ISGylation (L) of EZH2 were determined by anti-HA IP followed by western blot with anti-EZH2 antibody. M 28:B4:F3 and IGR37 cells were infected with V5-tagged empty vector or V5-tagged UBE2L6 lentiviral particles. Positive clones were selected by incubation in 2 µg/µL puromycin for 2 weeks. EZH2 was detected by western blot in stably transfected cells. Representative cell pellets are shown (bottom row). N Clonogenicity of 28:B4:F3 cells assessed by CV staining. O Tumor engraftment in NSG mice harboring control or V5-UBE2l6-WT vector cells 15 weeks after injection. P Volumes of tumors in NSG mice injected with 28:B4:F3 cells harboring control or V5-UBE2l6-WT vector after 15 weeks. The percentages of mice with macro- and micro-metastasis, and number of metastases per mm2 to either (Q, S) lung, or (R, T) liver, respectively. U Mean area of micro-metastases in lungs and liver. Control mice number = 11, UBE2L6-OE mice number = 11. Data analyzed by student t-test. *p < 0.05.
Fig. 4
Fig. 4. UBE2L6 promoter methylation via UHRF1 depletes UBE2L6 and stabilizes EZH2.
A Immunohistochemical staining of EZH2 and UBE2L6 in representative Schmorl’s stained pigmented human melanomas. Scale bar: 50 μm. B UBE2L6 protein scores (x-axis) negatively correlated with EZH2 protein scores (y-axis) in patient melanomas. Pink dots correspond to non-pigmented and purple dots to pigmented patient samples. p-value calculated from a linear regression analysis. R = correlation coefficient. Protein score = the percentage of immunopositive cells × immunostaining intensity. CF Indicated cell lines were treated with 2 µM 5’-Azacitidine or DMSO (vehicle) for 72 h prior to: (C) methylation specific primer (MSP) analysis of methylation at the UBE2L6 promoter (M: Methylated specific primer; U: Unmethylated specific primer; number below image represents percent ratio of methylated (m) to unmethylated (u) DNA quantified by ImageJ after normalization to controls (m/u), (D) UBE2L6 mRNA quantification with RT-qPCR, (E) cell number by Trypan blue cell counting, and (F) EZH2 protein quantification with western blot. G Correlation between UBE2L6 and UHRF1 mRNA levels in TCGA cutaneous melanoma samples. H Kaplan-Meier curves of overall survival of TCGA cutaneous melanoma patients (n = 427) stratified by UHRF1 mRNA levels. p = 0.015 (log-rank test). IK A375 human melanoma cells were transfected with one of two siRNAs against Uhrf1, or scrambled controls, followed by: (I) MSP analysis of UBE2L6 promoter as in (C), (J) EZH2 and UBE2L6 protein estimation by western blot, and (K) cell number by Trypan blue cell counting. L Immunohistochemical staining of UHRF1 and UBE2L6 in representative Schmorl’s stained pigmented human melanomas. Scale bar, 50 μm. M UBE2L6 protein scores (x-axis) in melanoma samples negatively correlated with UHRF1 scores (y-axis) in individual patients. Pink dots correspond to non-pigmented and purple dots to pigmented patient samples. P-value calculated from linear regression analysis. R = correlation coefficient. Protein score = percentage of immunopositive cells × immunostaining intensity. Data for D, E and K from three independent experiments are presented as means ± SD, analyzed by one-way ANOVA plus Tukey’s multiple comparison test. *p < 0.05, **p < 0.01, ***p < 0.001, ****p < 0.0001.
Fig. 5
Fig. 5. UBR4 is the E3 ligase of EZH2.
A Venn diagram depicting overlap of proteins co-immunoprecipitating with EZH2 from C006-M1, 28:B4:F3, IGR37, A375 and LM-MEL-45 cells (data derived from n = 3 biological replicates). B HA-tagged EZH2 and Flag-HA-tagged UBR4-LD (ligase domain) were co-expressed in HEK293 cells maintained ±MG132. Interactions between EZH2 and UBR4-LD were determined by immunoprecipitation with anti-EZH2 antibody and western blotting with anti-Flag antibody. C EZH2 protein was determined in HEK293 cells overexpressing either UBR4-LD or UBR4-FL (full length). UBR4 overexpression was measured by qPCR (lower panel: quantification relative to vector control, error bars: + SD). D UBR4 in 28:B4:F3, C006-M1 and HEK293 cells was knocked down by siRNA. EZH2 levels determined by western blot (top panels). Knockdown efficiency of UBR4 measured by qPCR as in (C). E Stability of EZH2 according to UBR4 levels (unaltered vs knockdown) was determined by western blot in A375 cells treated with cyclohexamide (CHX). Representative blot shown at the top, time-course plot at the bottom. F Ubiquitination of EZH2 was determined by anti-HA IP followed by western blot in A375 cells. G HEK293 cells with or without siUBR4 were transfected with HA-tagged EZH2 or V5-tagged UBR4-FL followed by 50 µM MG132 treatment for 4 h. Ubiquitination of EZH2 was determined by western blot with anti-ubiquitin (Ub) antibody. H B16-F10 cells ±siUBR4 were transfected with either Flag-tagged Ube2l6-WT (“wt”) or Flag-tagged Ube2l6-C87A (“mut”) and EZH2 levels determined by western blot. IK To evaluate EZH2/UBR4/UBE2L6 interactions, B16-F10 cells ±siUBR4 were transfected with either Flag-tagged Ube2l6-WT (“wt”) or Flag-tagged Ube2l6-C87A (“mut”) followed by 50 µM MG132 treatment for 4 h and then: (I) EZH2, UBR4 and UBE2L6 protein estimation by western blot, (J) determination of ubiquitination of EZH2 by western blot with anti-Ub antibody, and (K) co-immunoprecipitation of UBR4 and UBE2L6 with EZH2 antibody. Data represent n = 3 biological replicates. Data for D and E are from three independent experiments and presented as means ± SD, analyzed by one-way ANOVA plus Tukey’s multiple comparison test. **p < 0.01.
Fig. 6
Fig. 6. The K381 residue on EZH2 is ubiquitinated by UBE2L6/UBR4 in melanoma cells.
A Prediction of ubiquitination sites on human EZH2 was made using UbPred, shown as low (green), medium (blue) and high (red) confidence lysine ubiquitination sites (www.ubpred.org) (B) LC-MS analysis of mouse Ezh2 K376 ubiquitination in B16-F10 cells. C Sequence alignment of residues 368–392 of human (Hs) EZH2 protein against Mus musculus (Mm, mouse), Rattus norvegicus (Rn, rat), Bos taurus (Bt, cow), Gallus gallus (Gg, chicken), Danio rerio (Dr, zebrafish), Drosophila melanogaster (Dm, fruit fly), Anopheles gambiae (Ag, mosquito), and Caenorhabditis elegans (Ce, worm) showing conservation of K381 residues. D HEK293 cells with HA-tagged EH2-WT or HA-tagged EZH2-K381A were treated with 50 µg/mL CHX (cycloheximide) for the durations indicated. Stability of HA-tagged EZH2 protein was determined by western blot with anti-HA antibody. E Quantitated time course of EZH2 protein levels from (D). F B16-F10 cells were transfected with either Flag-tagged Ube2l6-WT or Flag-tagged Ube2l6-C87A (mutant) and HA-tagged EZH2-WT or HA-tagged EZH2-K381A, and HA-EZH2 levels determined by western blot with anti-HA antibody. G A375 and IGR37 cells transduced with V5-UBE2L6-WT were transfected transiently with either HA-tagged EZH2-WT or HA-tagged EZH2-K381R. Endogenous EZH2 levels were determined 48 h post-transfection with EZH2 antibody, HA-EZH2 levels were determined with anti-HA antibody and V5-UBE2L6 levels with V5 antibody. H Cells treated as in (G) were counted by Trypan blue 48 h post-transfection. I Invasion of cells treated as in (G) was measured 72 h post-transfection using Boyden chamber matrigel invasion assays followed by crystal violet staining. J Proposed model for UHRF1/UBE2L6/UBR4-mediated regulation of EZH2 and thereby melanocytic differentiation phenotypes in melanoma. Data for E and H from three independent experiments are presented as means ± SD, analyzed by one-way ANOVA plus Tukey’s multiple comparison test. *p < 0.05, **p < 0.01, ***p < 0.001.

References

    1. Swanton C. Intratumor heterogeneity: Evolution through space and time. Cancer Res. 2012;72:4875–82. doi: 10.1158/0008-5472.CAN-12-2217. - DOI - PMC - PubMed
    1. Carreira S, Goodall J, Denat L, Rodriguez M, Nuciforo P, Hoek KS, et al. Mitf regulation of Dia1 controls melanoma proliferation and invasiveness. Genes Dev. 2006;20:3426–39. doi: 10.1101/gad.406406. - DOI - PMC - PubMed
    1. Fane ME, Chhabra Y, Hollingsworth DEJ, Simmons JL, Spoerri L, Oh TG, et al. NFIB Mediates BRN2 Driven Melanoma Cell Migration and Invasion Through Regulation of EZH2 and MITF. EBioMedicine. 2017;16:63–75. doi: 10.1016/j.ebiom.2017.01.013. - DOI - PMC - PubMed
    1. Hoek KS, Eichhoff OM, Schlegel NC, Dobbeling U, Kobert N, Schaerer L, et al. In vivo switching of human melanoma cells between proliferative and invasive states. Cancer Res. 2008;68:650–6. doi: 10.1158/0008-5472.CAN-07-2491. - DOI - PubMed
    1. Boyer LA, Plath K, Zeitlinger J, Brambrink T, Medeiros LA, Lee TI, et al. Polycomb complexes repress developmental regulators in murine embryonic stem cells. Nature. 2006;441:349–53. doi: 10.1038/nature04733. - DOI - PubMed

Publication types