Review
. 2023 Aug;164(2):339-354.
doi: 10.1016/j.chest.2023.02.049. Epub 2023 Mar 11.

Lung Imaging in COPD Part 2: Emerging Concepts

Affiliations
Review

Lung Imaging in COPD Part 2: Emerging Concepts

Suhail Raoof et al. Chest. 2023 Aug.

Abstract

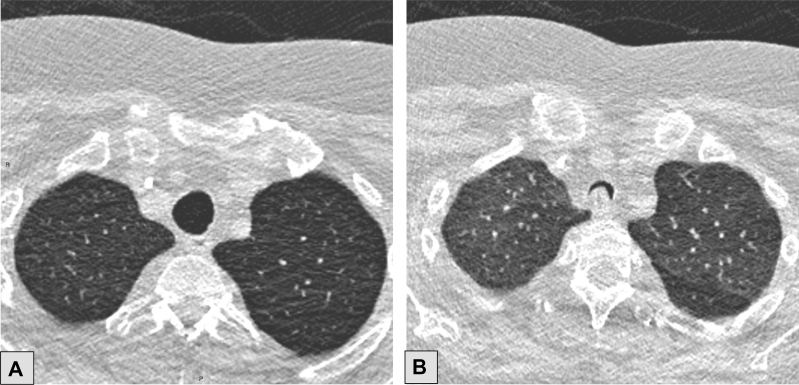
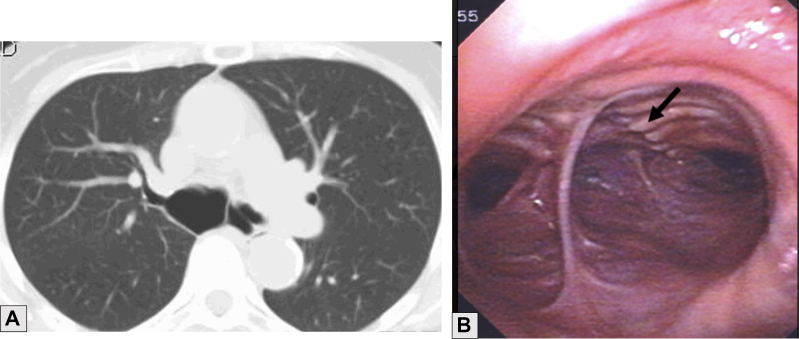
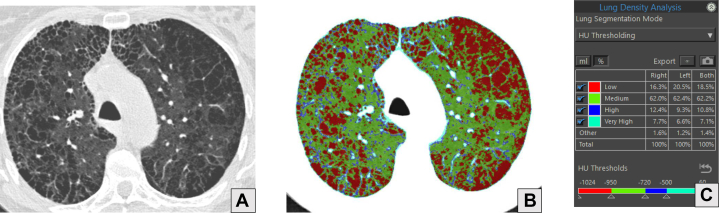
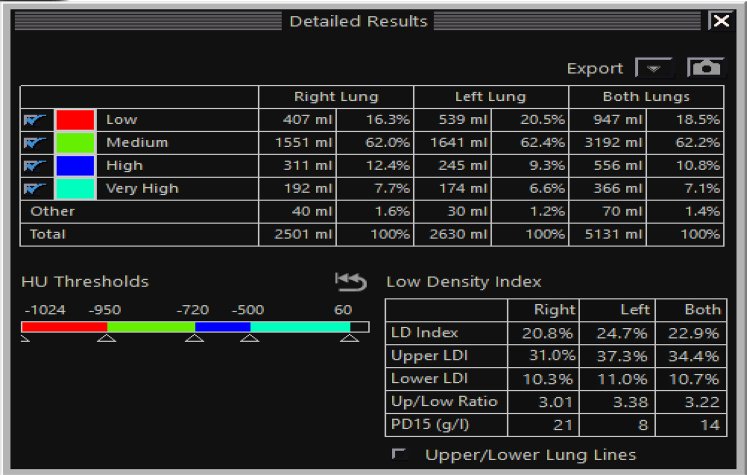
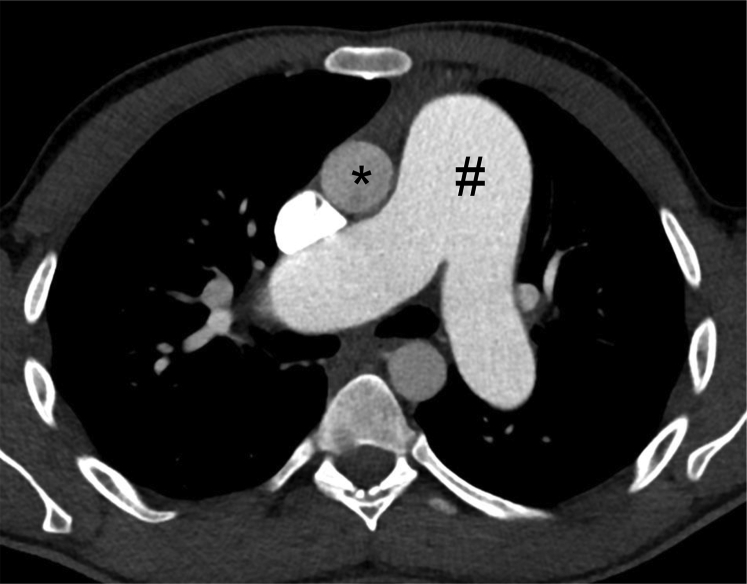
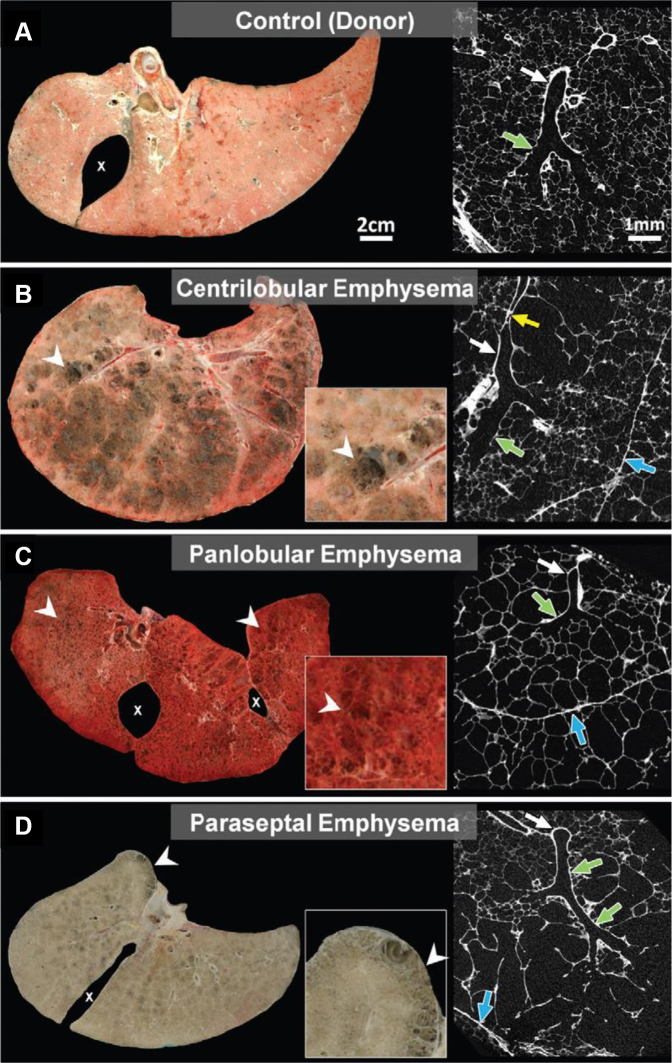
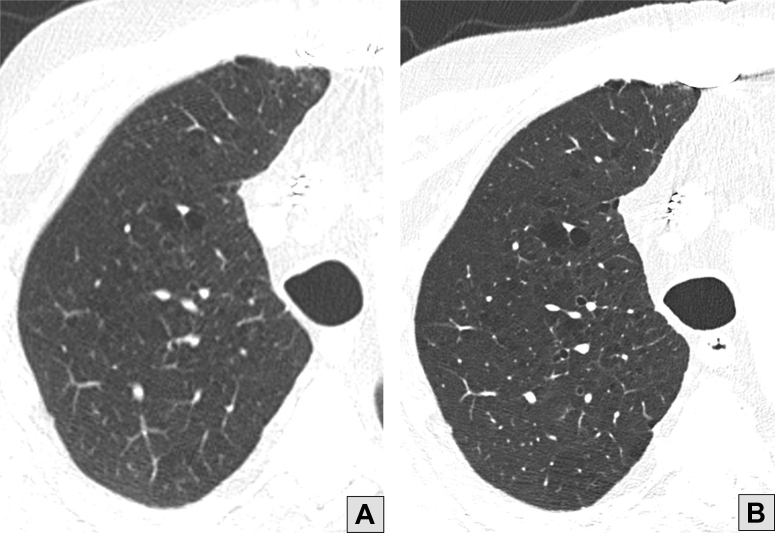
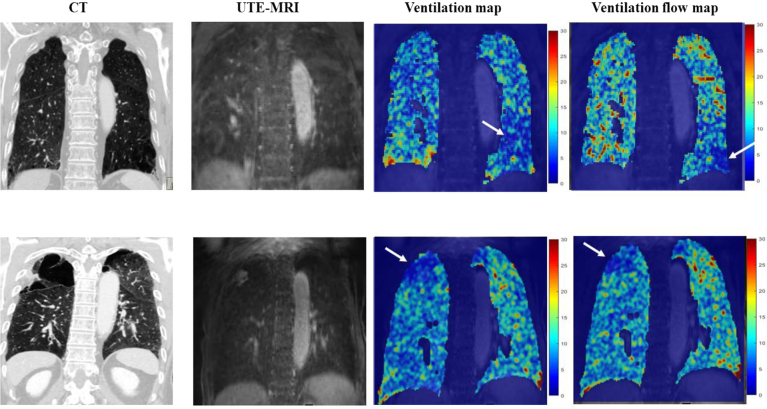
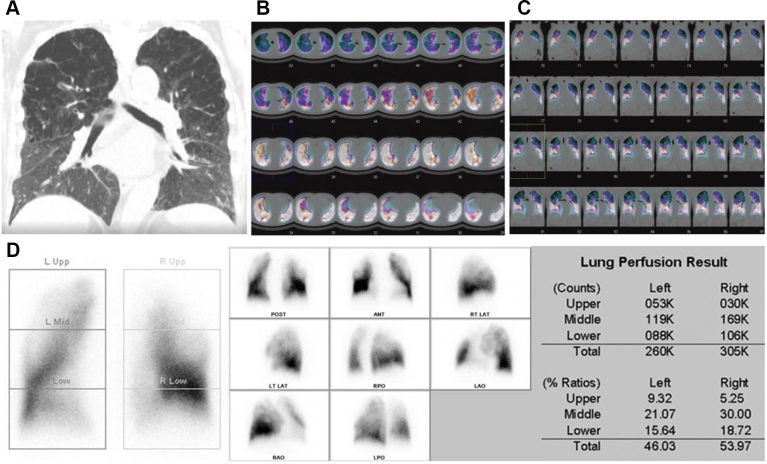
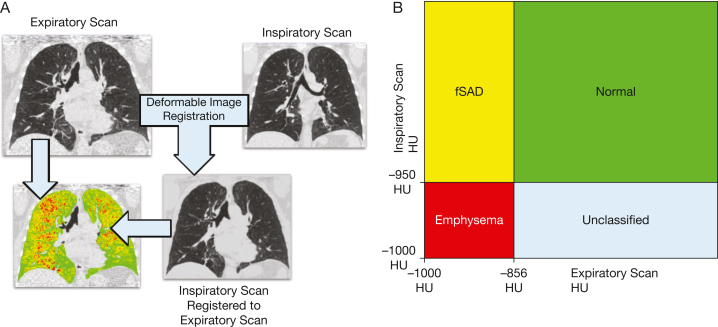
The diagnosis, prognostication, and differentiation of phenotypes of COPD can be facilitated by CT scan imaging of the chest. CT scan imaging of the chest is a prerequisite for lung volume reduction surgery and lung transplantation. Quantitative analysis can be used to evaluate extent of disease progression. Evolving imaging techniques include micro-CT scan, ultra-high-resolution and photon-counting CT scan imaging, and MRI. Potential advantages of these newer techniques include improved resolution, prediction of reversibility, and obviation of radiation exposure. This article discusses important emerging techniques in imaging patients with COPD. The clinical usefulness of these emerging techniques as they stand today are tabulated for the benefit of the practicing pulmonologist.

Keywords: COPD; CT scan of chest; biomarkers; chest CT scan; imaging; quantitative analysis.


Figures

Figure 1
Figure 1
A-C, Chest radiograph (A), axial CT scan image (B), and coronal CT image (C) in a man with bullous emphysema in the right upper lobe. Chest radiograph shows hyperlucency in the right upper and mid lung zone with compressive atelectasis of the right lower lung zone.
Figure 2
Figure 2
Sagittal CT scan showing well-visualized complete right-sided fissures (arrow).
Figure 3
Figure 3
A, Sagittal multiplanar volume reformatted image of the right lung from quantitative CT scan imaging using lung density analysis program demonstrating heterogeneous, bullous emphysema, with the emphysematous portions of the lung shaded red. The integrity of the major fissure is demonstrated (arrows). B, Quantitative data for use in the evaluation of the suitability of the patient for bronchoscopic lung volume reduction. In this example, the LDI, or proportion of the lung with < –950 HU, is higher in the upper lung (upper LDI) than in the lower lung (lower LDI), which is a favorable finding when considering suitability for bronchoscopic lung volume reduction. HU = Hounsfield units; LDI = low-density index.
Figure 4
Figure 4
A-D, Axial CT scan images with lung windows obtained at end inspiration (A) and during dynamic expiration (B) and corresponding virtual bronchoscopic images (C and D), respectively. An abnormal lunate configuration of the trachea is present at end inspiration (A and C), with excessive airway collapse during dynamic expiration (B and D). These findings are consistent with tracheobronchomalacia.
Figure 5
Figure 5
A, B, Axial CT scan images with lung windows obtained at end inhalation (A) and during dynamic exhalation (B). A, Normal-appearing trachea is seen on an end inhalation CT scan. B, In this patient, excessive dynamic airways collapse, as evidenced by an exaggerated bulging of the posterior membranous wall, can be identified only during exhalation (dynamic expiratory image).
Figure 6
Figure 6
A, B, CT scan showing marked dilatation of the proximal right main bronchus (3 × 2.5 cm) (A) and endoscopic imaging showing separation of the cartilages from the posterior wall evident in the right main bronchus (arrow) (B) in tracheobronchial smooth muscle atrophy.
Figure 7
Figure 7
A-C, Axial CT scan image with lung windows (A), axial image from lung density analysis (B), and quantitative analysis of lung density (C) of a 60-year-old male with a history of COPD who uses tobacco. A, Advanced destructive emphysema and mild paraseptal emphysema. B, Red portions of the lungs correspond to the areas of lucency caused by emphysema on CT scan and represent pixels with density measurements of < –950 HU. C, Percentages of each lung with density measurements falling into the defined ranges. In this example, 16.3% of the right lung, 20.5% of the left lung, and 18.5% of both lungs have density measurements in the range of emphysema (red). HU = Hounsfield units.
Figure 8
Figure 8
Quantitative data for the same patient as Figure 7, with additional data including PD15, as explained in text. HU = Hounsfield units; LD = low density; LDI = low density index; PD15 = lowest 15th percentile of lung histogram.
Figure 9
Figure 9
Axial contrast-enhanced CT scan image obtained through the main pulmonary artery in a patient with pulmonary hypertension demonstrating a dilated main pulmonary artery (number symbol), larger in caliber than the adjacent ascending aorta (asterisk).
Figure 10
Figure 10
A-D, Comparison of frozen lung slices and micro-CT scan images. A, Micro-CT image of normal donor lung showing a terminal bronchiole (white arrow) connecting to respiratory bronchiole (green arrow) supplying alveoli of normal size. B, Frozen lung slice showing extensive centrilobular emphysema (arrowheads) and micro-CT scan image showing dilation and destruction of proximal respiratory bronchioles (green arrow), with sparing of alveoli near lobular septa (blue arrow). Terminal bronchiole leading into centrilobular lesion is narrowed (yellow arrow) and then opens up again (white arrow). C, In contrast, frozen lung slice showing panlobular emphysema in α1-antitrypsin deficiency with uniform destruction of alveoli (arrowheads) extending right up to lobular septa (blue arrow) on the micro-CT scan image. Terminal bronchiole (white arrow) and respiratory bronchiole (green arrow) are normal. D, Frozen lung slice showing paraseptal emphysema with typical subpleural lesions (arrowheads) and micro-CT scan image showing that alveoli adjacent to lobular septa are dilated and destroyed, with sparing of center of the lobule. Terminal bronchiole (white arrow) and respiratory bronchiole (green arrow) are normal. (Reprinted with permission from Lynch et al.34)
Figure 11
Figure 11
A, Conventional high-resolution CT scan image of the right lung showing centrilobular emphysema. B, Photon-counting CT scan image obtained with a substantially lower acquisition dose and a sharper reconstruction kernel showing improved conspicuity of emphysema resulting from increased resolution and decreased image noise.
Figure 12
Figure 12
CT scan images and ultrashort echo time (UTE) MRI scans in two patients with COPD. The ventilation map and the ventilation flow map from the UTE MRI scans present two types of voxel-wise information about ventilation. A ventilation map was obtained by calculating the relative ratio of the signal difference between end-inspiration (Sins) and end expiration (Sexp) with reference to end expiration, which is written as ventilation = (Sexp – Sins) / Sexp. A ventilation flow map can be obtained from 3-D UTE images by calculating the rate of change of ventilation over time between two consecutive respiratory phases. It can provide regional information on airflow in the lung parenchyma or small airways, allowing for further evaluation of pulmonary ventilation function. Ventilation flow can be described more clearly by introducing the concept of fractional ventilation (FV), which is defined as ventilation at a specific respiratory phase relative to the end-expiratory ventilation: FV(m) = (S(mexp) – S(m)) / (S(mexp)), where a positive integer m represents the mth respiratory phase image in the breathing cycle (m = 1, 2, . . ., ms, where ms is the number of all respiratory phases considered) and mexp represents the end-expiration image. Then, assuming the interval t between two consecutive respiratory phases, ventilation flow (VF) can be defined as the change in FV over Δt: VF(n) = (ΔFV(n + 1) – ΔFV(n)) / Δt . Here, ΔFV(n) = FV(n + 1) – FV(n), where FV(n + 1) is assumed to be the same as FV(1) for n = ms. Given this definition of VF, a VF map can be obtained by calculating the voxel-wise difference between the maximum and minimum values of VF(n). Accordingly, the ventilation map indicates the amount of ventilation, whereas the VF map shows the ventilation rate. A, Blue area in the left lower lobe on the ventilation map (arrow) shows an area of decreased ventilation, but the corresponding area on the ventilation rate map (arrow) is smaller. B, In contrast, this patient has a large right upper lobe bulla (arrow), with matching decreases in ventilation and ventilation rate.
Figure 13
Figure 13
A-D, Single photon emission CT scan images from a 72-year-old male with COPD. A, High-resolution CT image showing centrilobular emphysema in upper lobes with an extent of 40% of the lung volume. B-D, Transverse (B) and frontal (C) perfusion single photon emission CT images revealing areas with reduced perfusion in all segments of the right upper lobe and apicoposterior and the anterior segments of the left upper lobes. ANT = anterior; LAO = left anterior oblique; LAT = lateral; LT = left; POST = posterior; RPO = right posterior oblique; RT = right; Upp = upper.
Figure 14
Figure 14
A, B, Parametric response mapping: deformable image registration (A) is used to match voxels on inspiratory and expiratory scans, and voxels are assigned a parametric response mapping category based on their HU values on the expiratory and corresponding registered inspiratory scan (B). For example, a voxel with a value of > –950 HU on the registered inspiratory scan and < –856 HU on the expiratory scans would be classified as fSAD. fSAD = functional small airways disease; HU = Hounsfield unit.

References

    1. Adeloye D., Song P., Zhu Y., et al. Global, regional and national prevalence of, and risk factors for, chronic obstructive lung disease (COPD) in 2019: a systemic review and modelling analysis. Lancet Respir Med. 2022;10(5):447–458. - PMC - PubMed
    1. Raoof S., Shah M., Make B., et al. Lung imaging in COPD part 1: clinical usefulness. Chest. 2023;164(1):69–84. - PMC - PubMed
    1. Stolz D., Mkorombindo T., Schumann D.M., et al. Towards the elimination of chronic obstructive pulmonary disease: a Lancet Commission. Lancet. 2022;400(10356):921–972. - PMC - PubMed
    1. Palla A., Desideri M., Rossi G., et al. Elective surgery for giant bullous emphysema: a 5-year clinical and functional follow-up. Chest. 2005;128(4):2043–2050. - PubMed
    1. Lor K.L., Chang Y.C., Yu C.J., Wang C.Y., Chen C.M., TCORE Consortium Bullous parametric response map for functional localization of COPD. J Digit Imaging. 2022;35(2):115–126. - PMC - PubMed

Publication types

MeSH terms