Randomized Controlled Trial
. 2023 May;64(5):100353.
doi: 10.1016/j.jlr.2023.100353. Epub 2023 Mar 11.

Effect of omega-3 ethyl esters on the triglyceride-rich lipoprotein response to endotoxin challenge in healthy young men

Affiliations
Randomized Controlled Trial

Effect of omega-3 ethyl esters on the triglyceride-rich lipoprotein response to endotoxin challenge in healthy young men

Rachel E Walker et al. J Lipid Res. 2023 May.

Abstract

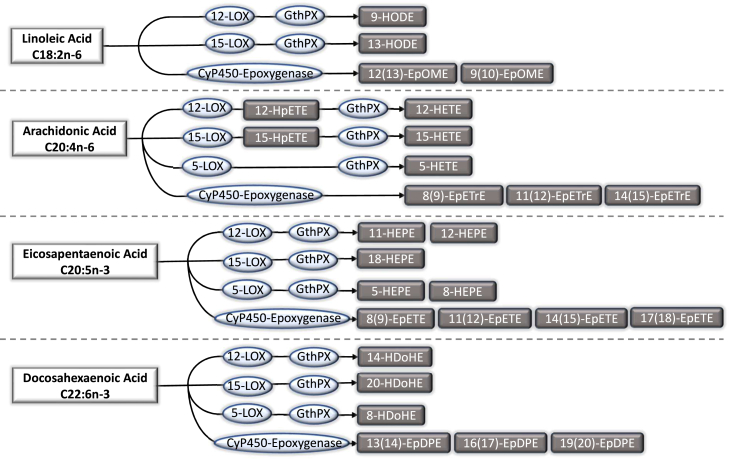
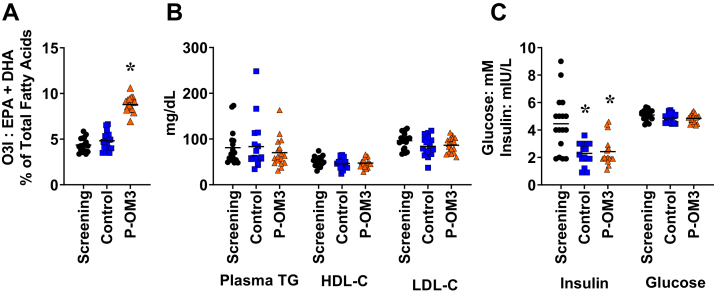
Oxylipins are produced enzymatically from polyunsaturated fatty acids, are abundant in triglyceride-rich lipoproteins (TGRLs), and mediate inflammatory processes. Inflammation elevates TGRL concentrations, but it is unknown if the fatty acid and oxylipin compositions change. In this study, we investigated the effect of prescription ω-3 acid ethyl esters (P-OM3; 3.4 g/d EPA + DHA) on the lipid response to an endotoxin challenge (lipopolysaccharide; 0.6 ng/kg body weight). Healthy young men (N = 17) were assigned 8-12 weeks of P-OM3 and olive oil control in a randomized order crossover study. Following each treatment period, subjects received endotoxin challenge, and the time-dependent TGRL composition was observed. Postchallenge, arachidonic acid was 16% [95% CI: 4%, 28%] lower than baseline at 8 h with control. P-OM3 increased TGRL ω-3 fatty acids (EPA 24% [15%, 34%]; DHA 14% [5%, 24%]). The timing of ω-6 oxylipin responses differed by class; arachidonic acid-derived alcohols peaked at 2 h, while linoleic acid-derived alcohols peaked at 4 h (pint = 0.006). P-OM3 increased EPA alcohols by 161% [68%, 305%] and DHA epoxides by 178% [47%, 427%] at 4 h compared to control. In conclusion, this study shows that TGRL fatty acid and oxylipin composition changes following endotoxin challenge. P-OM3 alters the TGRL response to endotoxin challenge by increasing availability of ω-3 oxylipins for resolution of the inflammatory response.

Keywords: VLDL; chylomicrons; fatty acids; inflammation; lipopolysaccharide; lipoprotein kinetics; omega-3 acid ethyl esters; oxylipins; polyunsaturated fatty acids; triglycerides.


Conflict of interest statement

Conflict of interest The authors declare that they have no conflicts of interest with the contents of this article.

Figures

Fig. 1
Fig. 1
Enzymatic production of oxylipins from parent polyunsaturated fatty acids. Enzymes (blue ovals) such as lipoxygenase (LOX), glutathione peroxidase (GthPX), and cytochrome P450 (CyP450) epoxygenase convert parent fatty acids (gray rectangles) into oxylipins (rounded rectangles). Oxylipins listed here are key molecules measured in this study. EpDPE, epoxydocosapentaenoate; EpETE, epoxyeicosatetraenoate; EpETrE, epoxyeicosatrienoate; EpOME, epoxyoctadecamonoenoate; HDoHE, hydroxydocosahexaenoate; HETE, hydroxyeicosatetraenoate; HEPE, hydroxyeicosapentaenoate; HODE, hydroxyoctadecadienoate; HpETE, hydroperoxyeicosatetraenoate.
Fig. 2
Fig. 2
Effect of prescription ω-3 ethyl ester treatment on blood lipids, glucose, and insulin. A: P-OM3 treatment increased ω-3 index (O3I) by 99% (95% CI: 87%, 111%), while olive oil control resulted in no change. Differences were assessed by repeated measures ANOVA with mixed models, and post hoc analysis was done by Tukey HSD post hoc test, ∗P < 0.05. B: P-OM3 and control had no significant effect on baseline plasma triglycerides (TGs), HDL-C, or LDL-C. C: Both control and P-OM3 had an unexpected effect of decreasing plasma insulin concentration, while there was no effect on plasma glucose concentration. Differences were assessed by repeated measures ANOVA with mixed models, and post hoc analysis was done by Tukey HSD post hoc test, ∗P < 0.05. P-OM3, prescription ω-3 acid ethyl ester.
Fig. 3
Fig. 3
Time-dependent triglyceride response to endotoxin challenge. Plasma triglycerides (TGs) increased after endotoxin challenge (n = 17), with a peak concentration at 4 h. Blue squares represent control treatment; orange triangles represent P-OM3 treatment. Differences from baseline were assessed by repeated measures ANOVA with mixed models. Post hoc analysis was done using the False Discovery Rate Correction term, q, with the acceptable false discovery rate of 10%, ∗P < 0.05, different from baseline adjusted for false discovery rate, q = 0.1 (39). Data is graphed as least-squares means ±95% confidence interval. P-OM3, prescription ω-3 acid ethyl ester.
Fig. 4
Fig. 4
Effect of endotoxin on TGRL fatty acid composition. A: TGRL fractional linoleic acid (LA; C18:2n6) did not change over time after endotoxin challenge in either control or P-OM3 treatment groups. B: TGRL fractional oleic acid (OA; C18:1n9) did not change significantly over time after endotoxin challenge in either control or P-OM3 treatment groups. C: TGRL fractional gamma linolenic acid (DGLA; C20:3n6) did not change significantly over time after endotoxin challenge in either control or P-OM3 treatment groups. D: Fractional arachidonic acid (AA; C20:4n6) composition was lower at 8 h in control group. E: Fractional TGRL eicosapentaenoic acid (EPA; C20:5n3) was increased at both 4 and 8 h with P-OM3 treatment. P-OM3 treatment increased overall EPA enrichment by 432% (340%, 523%; P < 0.0001) across all time points. F: Fractional TGRL docosahexaenoic acid (DHA; C22:6n3) was increased at 1 and 2 h with P-OM3 treatment. P-OM3 treatment increased overall TGRL DHA enrichment by 142% (120%, 164%; P < 0.0001) across all time points. Blue squares represent control treatment; orange triangles represent P-OM3 treatment. Differences were assessed by repeated measures ANOVA with mixed models. Post hoc analysis was done using the False Discovery Rate Correction term, q, with the acceptable false discovery rate of 10% (39). Fatty acid abundance expressed as fraction of total mass. N = 15; samples from two subjects were unavailable for fatty acid analysis. Longitudinal data is graphed as least-squares means ±95% confidence interval. ∗ P < 0.05 adjusted for false discovery rate, q = 0.1; Different from baseline time point. † P < 0.05 adjusted for false discovery rate, q = 0.1; P-OM3 different from control. P-OM3, prescription ω-3 acid ethyl ester; TGRL, triglyceride-rich lipoprotein.
Fig. 5
Fig. 5
Response of TGRL oxylipins to endotoxin challenge. Oxylipin concentrations from 0 to 8 h after endotoxin challenge of (A) total oxylipins, (B) total alcohols, and (C) total epoxides. Blue squares represent control treatment; orange triangles represent P-OM3 treatment. Differences were assessed by repeated measures ANOVA with mixed models. Post hoc analysis was done using the False Discovery Rate Correction term, q, with the acceptable false discovery rate of 10% (39). Longitudinal data is graphed as least-squares means ±95% confidence interval. ∗ P < 0.05 adjusted for false discovery rate, q = 0.1; Different from baseline time point. P-OM3, prescription ω-3 acid ethyl ester; TGRL, triglyceride-rich lipoprotein.
Fig. 6
Fig. 6
Effect of P-OM3 treatment on oxylipin response to endotoxin challenge. Least-squares means are shown from 0 to 8 h after endotoxin challenge for (A) linoleic acid (LA)–derived alcohols (HODEs), (B) arachidonic acid (AA)–derived alcohols (HETEs), (C) eicosapentaenoic acid (EPA)–derived alcohols (HEPEs), (D) docosahexaenoic acid (DHA)–derived alcohols (HDoHEs), (E) LA-derived epoxides (EpOMEs), (F) AA-derived epoxides (EpETrEs), (G) EPA-derived epoxides (EpETEs), (H) DHA-derived epoxides (EpDPEs), and (I) AA-derived hydroperoxides (HpETEs). J: The time-dependent response of HODEs differed from that of HETEs with an interaction P-value of 0.007. K: Fractional increase in HODEs and fractional decrease in HDoHEs, EpETrEs, and HETEs from 0 to 4 h occurred regardless of treatment. Fractional increase in HEPEs occurred only with P-OM3 treatment. Blue squares represent control treatment; orange triangles represent P-OM3 treatment. Differences were assessed by repeated measures ANOVA with mixed models. Post hoc analysis was done using the False Discovery Rate Correction term, q, with the acceptable false discovery rate of 10% (39). Longitudinal data is graphed as least-squares means ±95% confidence interval. ∗ P < 0.05 adjusted for false discovery rate, q = 0.1; Different from baseline time point. † P < 0.05 adjusted for false discovery rate, q = 0.1; P-OM3 different from control. ‡ P < 0.05 adjusted for false discovery rate, q = 0.1; Increased from 0 to 4 h. § P < 0.05 adjusted for false discovery rate, q = 0.1; Decreased from 0 to 4 h. || P < 0.05 adjusted for false discovery rate, q = 0.1; Increased from 0 to 4 h only with P-OM3. EpETrE, epoxyeicosatrienoic acid; EpDPE, epoxydocosapentaenoic acid; HDoHE, hydroxydocosahexaenoic acid; HEPE, hydroxyeicosapentaenoic acid; HpETE, hydroperoxyeicosatetraenoic acid; P-OM3, prescription ω-3 acid ethyl ester.
Fig. 7
Fig. 7
The time-dependent effect of LPS on individual oxylipins. Measured oxylipins include (A) linoleic acid (LA)–derived 9-HODE, (B) LA-derived 13-HODE, (C) LA-derived 12(13)-EpOME, (D) LA-derived 9(10)-EpOME, (E) arachidonic acid (AA)–derived 12-HpETE, (F) AA-derived 15-HpETE, (G) AA-derived 5-HETE, (H) AA-derived 12-HETE, (I) AA-derived 15-HETE, (J) eicosapentaenoic acid (EPA)–derived 5-HEPE, (K) EPA-derived 8-HEPE, (L) EPA-derived 11-HEPE, (M) EPA-derived 12-HEPE, (N) EPA-derived 18-HEPE, (O) docosahexaenoic acid (DHA)–derived 14-HDoHE, (P) DHA-derived 20-HDoHE, (Q) EPA-derived 14(15)-EpETE, (R) EPA-derived 17(18)-EpETE, (S) DHA-derived 13(14)-EpDPE, and (T) DHA-derived 19(20)-EpDPE. Blue squares represent control treatment; orange triangles represent P-OM3 treatment. Differences were assessed by repeated measures ANOVA with mixed models. Post hoc analysis was done using the False Discovery Rate Correction term, q, with the acceptable false discovery rate of 10% (39). Longitudinal data is graphed as least-squares means ±95% confidence interval. ∗ P < 0.05 adjusted for false discovery rate, q = 0.1; Different from baseline time point. † P < 0.05 adjusted for false discovery rate, q = 0.1; P-OM3 different from control. EpDPE, epoxydocosapentaenoic acid; HDoHE, hydroxydocosahexaenoic acid; HEPE, hydroxyeicosapentaenoic acid; HpETE, hydroperoxyeicosatetraenoic acid; LPS, lipopolysaccharide; P-OM3, prescription ω-3 acid ethyl ester.

References

    1. Varela M.L., Mogildea M., Moreno I., Lopes A. Acute Inflammation and Metabolism. Inflammation. 2018;41:1115–1127. - PubMed
    1. Wisniewski P.J., Dowden R.A., Campbell S.C. Role of dietary lipids in modulating inflammation through the gut microbiota. Nutrients. 2019;11:117. - PMC - PubMed
    1. Spector A.A., Kim H.Y. Cytochrome P epoxygenase pathway of polyunsaturated fatty acid metabolism. Biochim. Biophys. Acta. 2015;1851:356–365. [online] - PMC - PubMed
    1. Oni-orisan A., Edin M.L., Lee J.A., Wells M.A., Christensen E.S., Vendrov K.C., et al. Cytochrome P450-derived epoxyeicosatrienoic acids and coronary artery disease in humans : a targeted metabolomics study. J. Lipid Res. 2016;57:109–119. - PMC - PubMed
    1. Gabbs M., Leng S., Devassy J.G., Monirujjaman M., Aukema H.M. Advances in our understanding of oxylipins derived from dietary PUFAs. Adv. Nutr. Int. Rev. J. 2015;6:513–540. [online] - PMC - PubMed

Publication types