

Assessing Cerebral Oxygen Metabolism Changes in Patients With Preeclampsia Using Voxel-Based Morphometry of Oxygen Extraction Fraction Maps in Magnetic Resonance Imaging
- PMID: 36907593
- PMCID: PMC10067693
- DOI: 10.3348/kjr.2022.0652
Assessing Cerebral Oxygen Metabolism Changes in Patients With Preeclampsia Using Voxel-Based Morphometry of Oxygen Extraction Fraction Maps in Magnetic Resonance Imaging
Abstract
Objective: The objective of this study was to analyze the different brain oxygen metabolism statuses in preeclampsia using magnetic resonance imaging and investigate the factors that affect cerebral oxygen metabolism in preeclampsia.
Materials and methods: Forty-nine women with preeclampsia (mean age 32.4 years; range, 18-44 years), 22 pregnant healthy controls (PHCs) (mean age 30.7 years; range, 23-40 years), and 40 non-pregnant healthy controls (NPHCs) (mean age 32.5 years; range, 20-42 years) were included in this study. Brain oxygen extraction fraction (OEF) values were computed using quantitative susceptibility mapping (QSM) plus quantitative blood oxygen level-dependent magnitude-based OEF mapping (QSM + quantitative blood oxygen level-dependent imaging or QQ) obtained with a 1.5-T scanner. Voxel-based morphometry (VBM) was used to investigate the differences in OEF values in the brain regions among the groups.
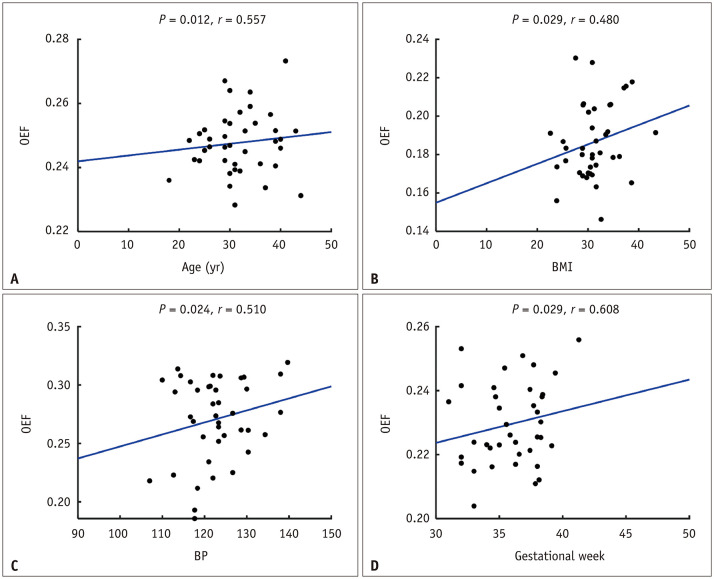
Results: Among the three groups, the average OEF values were significantly different in multiple brain areas, including the parahippocampus, multiple gyri of the frontal lobe, calcarine, cuneus, and precuneus (all P-values were less than 0.05, after correcting for multiple comparisons). The average OEF values of the preeclampsia group were higher than those of the PHC and NPHC groups. The bilateral superior frontal gyrus/bilateral medial superior frontal gyrus had the largest size of the aforementioned brain regions, and the OEF values in this area were 24.2 ± 4.6, 21.3 ± 2.4, and 20.6 ± 2.8 in the preeclampsia, PHC, and NPHC groups, respectively. In addition, the OEF values showed no significant differences between NPHC and PHC. Correlation analysis revealed that the OEF values of some brain regions (mainly involving the frontal, occipital, and temporal gyrus) were positively correlated with age, gestational week, body mass index, and mean blood pressure in the preeclampsia group (r = 0.361-0.812).
Conclusion: Using whole-brain VBM analysis, we found that patients with preeclampsia had higher OEF values than controls.
Keywords: Cerebral hypoxia; Magnetic resonance imaging; Oxygen extraction fraction; Preeclampsia; Voxel-based morphometry.
Copyright © 2023 The Korean Society of Radiology.
Conflict of interest statement
The authors have no potential conflicts of interest to disclose.
Figures


Similar articles
-
Sensitivity assessment of QSM+qBOLD (or QQ) in detecting elevated oxygen extraction fraction (OEF) in physiological change.J Cereb Blood Flow Metab. 2025 Apr;45(4):735-745. doi: 10.1177/0271678X241298584. Epub 2024 Nov 5. J Cereb Blood Flow Metab. 2025. PMID: 39501700 Free PMC article.
-
Oxygen extraction fraction (OEF) assesses cerebral oxygen metabolism of deep gray matter in patients with pre-eclampsia.Eur Radiol. 2022 Sep;32(9):6058-6069. doi: 10.1007/s00330-022-08713-7. Epub 2022 Mar 29. Eur Radiol. 2022. PMID: 35348866
-
Cluster analysis of time evolution (CAT) for quantitative susceptibility mapping (QSM) and quantitative blood oxygen level-dependent magnitude (qBOLD)-based oxygen extraction fraction (OEF) and cerebral metabolic rate of oxygen (CMRO2 ) mapping.Magn Reson Med. 2020 Mar;83(3):844-857. doi: 10.1002/mrm.27967. Epub 2019 Sep 10. Magn Reson Med. 2020. PMID: 31502723 Free PMC article.
-
Cerebral oxygen extraction fraction MRI: Techniques and applications.Magn Reson Med. 2022 Aug;88(2):575-600. doi: 10.1002/mrm.29272. Epub 2022 May 5. Magn Reson Med. 2022. PMID: 35510696 Free PMC article. Review.
-
Cerebral oxygen metabolism from MRI susceptibility.Neuroimage. 2023 Aug 1;276:120189. doi: 10.1016/j.neuroimage.2023.120189. Epub 2023 May 23. Neuroimage. 2023. PMID: 37230206 Free PMC article. Review.
Cited by
-
Sensitivity assessment of QSM+qBOLD (or QQ) in detecting elevated oxygen extraction fraction (OEF) in physiological change.J Cereb Blood Flow Metab. 2025 Apr;45(4):735-745. doi: 10.1177/0271678X241298584. Epub 2024 Nov 5. J Cereb Blood Flow Metab. 2025. PMID: 39501700 Free PMC article.
-
Hypertensive disorders of pregnancy and neuroimaging markers of dementia risk: A pilot study.Pregnancy (Hoboken). 2025 May;1(3):e70020. doi: 10.1002/pmf2.70020. Epub 2025 Apr 24. Pregnancy (Hoboken). 2025. PMID: 40881303 Free PMC article.
References
-
- Garrido-Gimenez C, Mendoza M, Cruz-Lemini M, Galian-Gay L, Sanchez-Garcia O, Granato C, et al. Angiogenic factors and long-term cardiovascular risk in women that developed preeclampsia during pregnancy. Hypertension. 2020;76:1808–1816. - PubMed
Publication types
MeSH terms
Substances
LinkOut - more resources
Full Text Sources
