. 2023 Mar 13;8(1):103.
doi: 10.1038/s41392-023-01313-x.

B cell-derived anti-beta 2 glycoprotein I antibody mediates hyperhomocysteinemia-aggravated hypertensive glomerular lesions by triggering ferroptosis

Affiliations

B cell-derived anti-beta 2 glycoprotein I antibody mediates hyperhomocysteinemia-aggravated hypertensive glomerular lesions by triggering ferroptosis

Xing Du et al. Signal Transduct Target Ther. .

Abstract

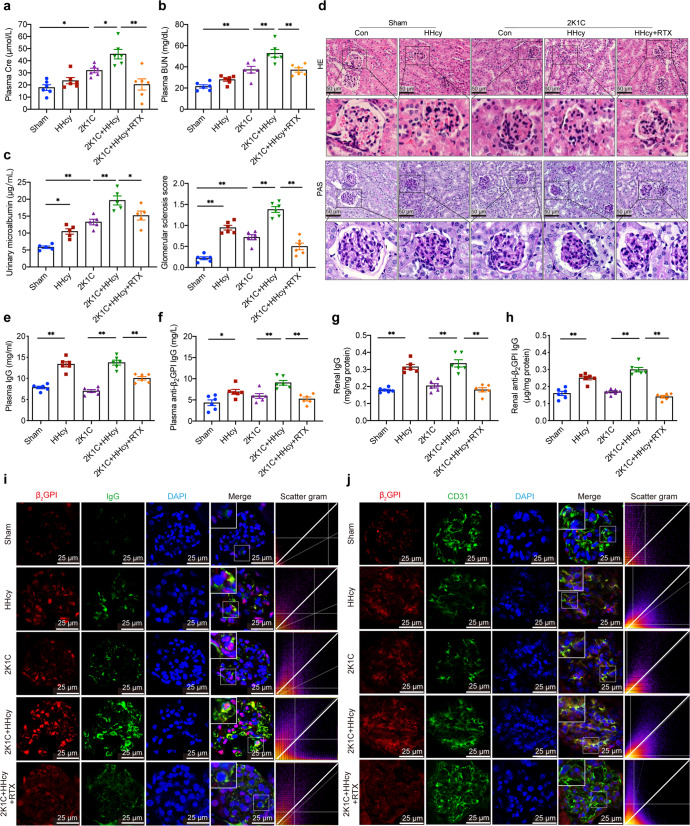
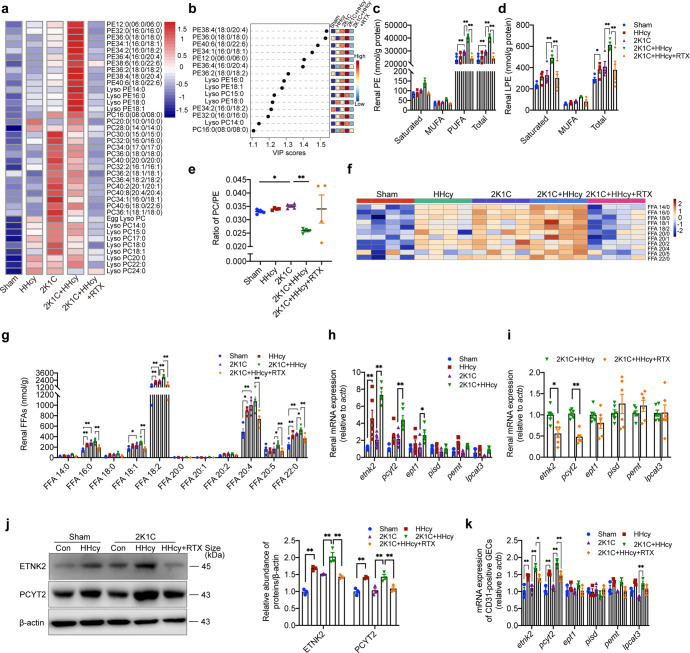
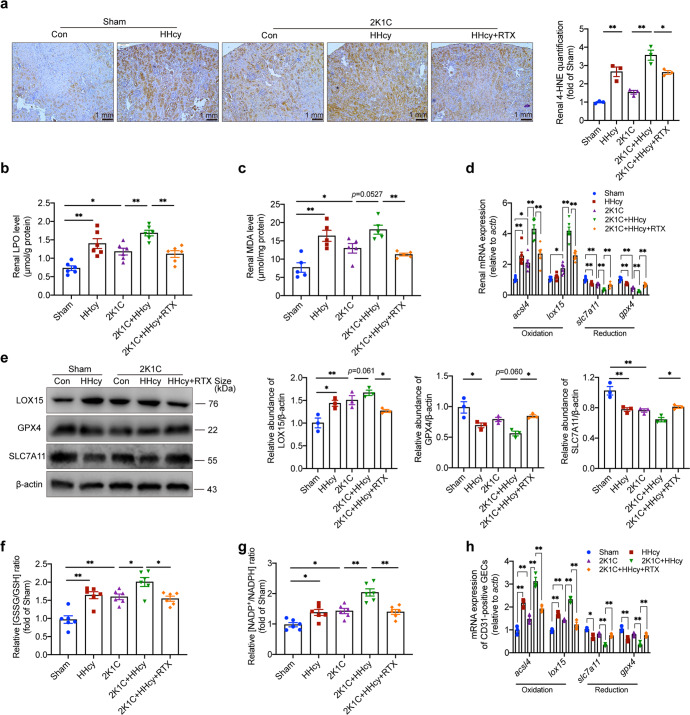
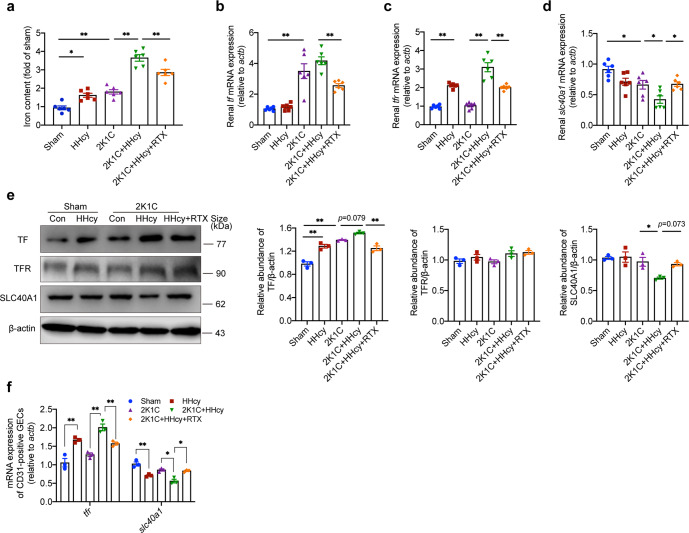
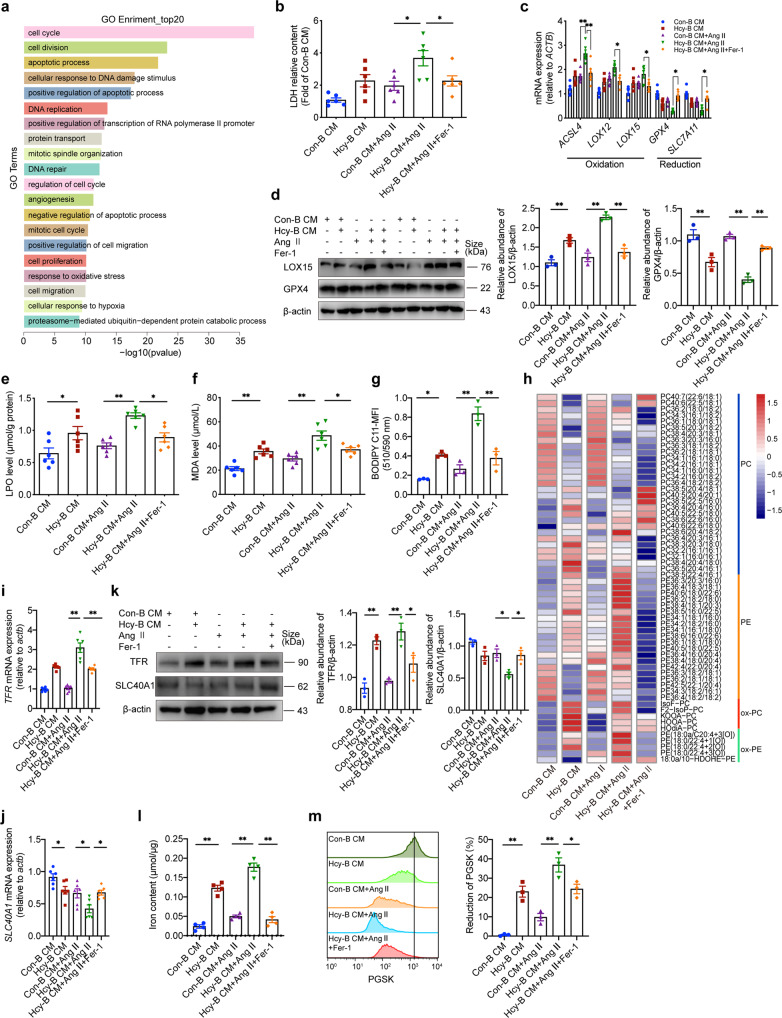
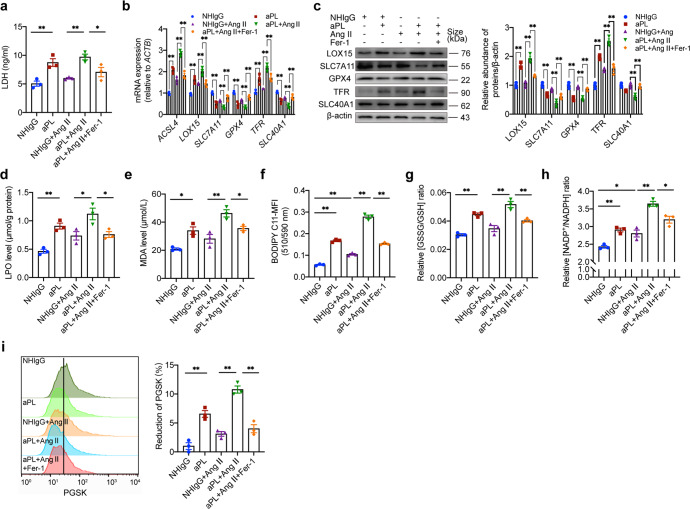
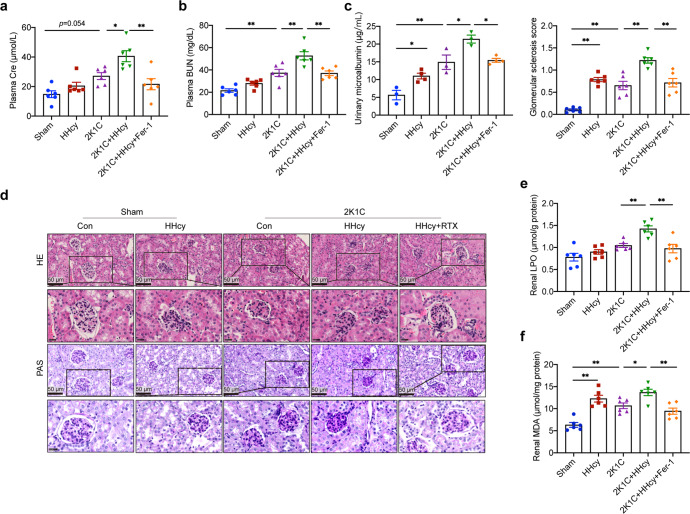
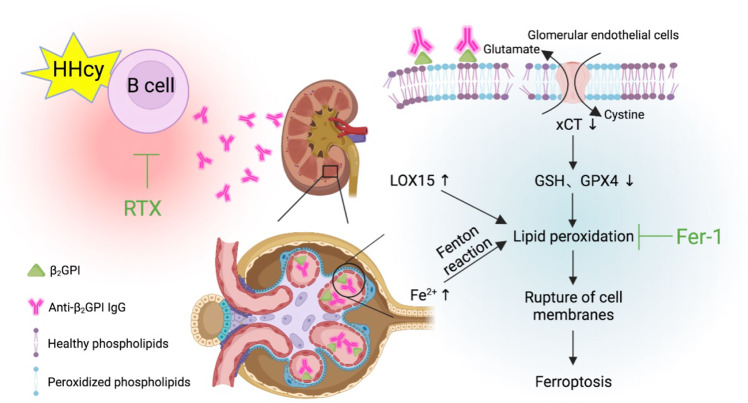
Hyperhomocysteinemia (HHcy) is a risk factor for chronic kidney diseases (CKDs) that affects about 85% CKD patients. HHcy stimulates B cells to secrete pathological antibodies, although it is unknown whether this pathway mediates kidney injury. In HHcy-treated 2-kidney, 1-clip (2K1C) hypertensive murine model, HHcy-activated B cells secreted anti-beta 2 glycoprotein I (β2GPI) antibodies that deposited in glomerular endothelial cells (GECs), exacerbating glomerulosclerosis and reducing renal function. Mechanistically, HHcy 2K1C mice increased phosphatidylethanolamine (PE) (18:0/20:4, 18:0/22:6, 16:0/20:4) in kidney tissue, as determined by lipidomics. GECs oxidative lipidomics validated the increase of oxidized phospholipids upon Hcy-activated B cells culture medium (Hcy-B CM) treatment, including PE (18:0/20:4 + 3[O], PE (18:0a/22:4 + 1[O], PE (18:0/22:4 + 2[O] and PE (18:0/22:4 + 3[O]). PE synthases ethanolamine kinase 2 (etnk2) and ethanolamine-phosphate cytidylyltransferase 2 (pcyt2) were increased in the kidney GECs of HHcy 2K1C mice and facilitated polyunsaturated PE synthesis to act as lipid peroxidation substrates. In HHcy 2K1C mice and Hcy-B CM-treated GECs, the oxidative environment induced by iron accumulation and the insufficient clearance of lipid peroxides caused by transferrin receptor (TFR) elevation and down-regulation of SLC7A11/glutathione peroxidase 4 (GPX4) contributed to GECs ferroptosis of the kidneys. In vivo, pharmacological depletion of B cells or inhibition of ferroptosis mitigated the HHcy-aggravated hypertensive renal injury. Consequently, our findings uncovered a novel mechanism by which B cell-derived pathogenic anti-β2GPI IgG generated by HHcy exacerbated hypertensive kidney damage by inducing GECs ferroptosis. Targeting B cells or ferroptosis may be viable therapeutic strategies for ameliorating lipid peroxidative renal injury in HHcy patients with hypertensive nephropathy.


Conflict of interest statement

The authors declare no competing interests.

Figures

Fig. 1
Fig. 1
HHcy aggravates hypertensive kidney damage mediated by B cell-derived anti-β2GPI IgG. C57BL/6J mice (8 weeks old) treated with sham or 2K1C surgery were given drinking water with or without Hcy (1.8 g/L) for 4 weeks. To assess the role of B cells in renal injury, Rituximab was administered to HHcy 2K1C mice at the start of modeling (i.p. 75 μg/20 g body weights every other day for 4 weeks). Plasma Cre (a), BUN (b), and urinary microalbumin (c) were assayed to evaluate renal function using ELISA. d Representative histochemical staining of kidney paraffin sections with hematoxylin and eosin (HE, top) and periodic acid-Schiff (PAS, bottom) (scale bar, 50 μm). Quantification of the glomerular matrix index was performed for each group (0 = normal glomeruli, 1 = thickening of the GBM, 1.5 = glomerular thickening plus segmental hypercellularity, 2 = mild segmental hyalinosis (<25%), 2.5 = severe segmental hyalinosis (>50%), 3 = glomerular hyalinosis (‘blobs’ of hyaline material deposition), and 4 = diffuse glomerular sclerosis with total tuft obliteration and collapse, 50 glomeruli/mice, n = 6/group). e, f Plasma samples were collected and evaluated for total IgG and anti-β2GPI IgG using ELISA. g, h Kidney tissue lysates were prepared and evaluated for total IgG and anti-β2GPI IgG using ELISA. i Representative immunofluorescent staining of β2GPI (red), IgG (green), and nuclei (blue) in frozen kidney sections. White dashed boxes indicate the colocalization of IgG and β2GPI (scale bar, 25 μm). j Representative immunofluorescent staining of β2GPI (red), CD31 (j) (green) (scale bar, 25 μm), nephrin (k) (green) (scale bar, 10 μm), PDGFRβ (l) (green) (scale bar, 25 μm) and DAPI (blue) in frozen kidney sections. HHcy hyperhomocysteinemia, 2K1C 2-kidney, 1-clip, Cre creatinine, BUN blood urea nitrogen, UCAR urinary creatinine albumin ratio, GBM glomerular basement membrane, PDGFRβ platelet-derived growth factor receptor beta. All data are expressed as the means ± SEM. n = 5–6, *P < 0.05, **P < 0.01
Fig. 2
Fig. 2
HHcy induces a remodeling of phospholipid composition and fatty acid accumulation in kidneys of hypertensive mice by B cell-derived antibodies. ag HPLC-MS/MS analysis of lipid metabolites and free fatty acids (FFAs) in kidney tissues from sham or 2K1C mice with or without HHcy (1.8 g/L) in drinking water for 4 weeks. Rituximab was administered to HHcy 2K1C mice at the start of modeling (i.p. 75 μg/20 g body weights every other day for 4 weeks). n = 4. a Heatmap illustrating the phospholipid metabolic profiles in kidney tissues. b VIP scatter plot identified by PCA showing the top 15 lipid metabolites in the different groups. c, d Phospholipids were classified according to the number of double bonds in the fatty acid acyl tails and expressed as saturated, MUFA, PUFA, and total, and different species levels of PE (c) and LPE (d) in kidney tissues were analyzed using HPLC-MS/MS. e The ratios of total PC/PE were calculated in each group. f Heatmap illustrating the free fatty acids in kidney tissues. g Different levels of free fatty acids in kidney tissues are shown in the histogram. h, i Quantitative PCR analysis of PE and PC synthesis enzymes in the kidney (PE synthesis: etnk2, pcyt2, ept1; PC synthesis: pemt, lpcat3). n = 6. j Western blot analysis of ETNK2 and PCYT2 protein expression and quantification. β-actin was used as an internal control. n = 3. k Quantitative PCR analysis of PE and PC synthesis enzymes in the renal CD31-positive GECs from frozen section by laser capture microdissection. n = 3. VIP variable importance in projection, PCA principal component analysis, MUFA monounsaturated fatty acid, PUFA polyunsaturated fatty acid, etnk2 ethanolamine kinase 2, pcyt2 phosphate cytidylyltransferase 2, ept1 ethanolaminephosphotransferase 1, pemt phosphatidylethanolamine N-methyltransferase, lpcat3 lysophosphatidylcholine acyltransferase 3. All data are expressed as the means ± SEM. *P < 0.05, **P < 0.01
Fig. 3
Fig. 3
B cell-derived antibodies mediate HHcy-aggravated kidney lipid peroxidation in hypertensive mice. a Immunohistochemical staining of 4-HNE (brown) from kidney sections in sham or 2K1C mice with or without Hcy (1.8 g/L) in drinking water for 4 weeks, indicative of lipid peroxidation. Rituximab was administered to HHcy 2K1C mice at the start of modeling (i.p. 75 μg/20 g body weights every other day for 4 weeks). The immunohistochemical staining was calculated as the percentage of brown signals over the total area. n = 3. b, c Effects of 2K1C and HHcy on lipid peroxidation in the kidney were measured using ELISA for LPO (b) and MDA (c). n = 6. d Quantitative PCR analysis of redox enzyme expression in kidney tissues, including acsl4, lox15, slc7a11 and gpx4. n = 6. e Western blot analysis of LOX15, GPX4 and SLC7A11 protein expression and quantification. β-actin was used as an internal control. n = 3. f, g The redox balance in the kidney was assayed for the ratio of GSSG/GSH and NADP+/NADPH using ELISA. n = 6. h Quantitative PCR analysis of redox enzyme expression in the renal CD31-positive GECs from frozen section by laser capture microdissection, including acsl4, lox15, slc7a11 and gpx4. n = 3. LPO lipid peroxide, MDA malondialdehyde, 4-HNE 4-hydroxynonenal, lox15 lipoxygenase 15, acsl4 acyl-CoA synthetase long chain family member 4, slc7a11 cystine/glutamate transporter, gpx4 glutathione peroxidase 4, GSH glutathione, GSSG glutathione disulfide. All data are expressed as the means ± SEM. *P < 0.05, **P < 0.01
Fig. 4
Fig. 4
Targeting B cell-derived antibodies to improve HHcy-aggravated iron accumulation in hypertensive mice. Iron content and metabolism were analyzed in mice treated with sham or 2K1C surgery and given drinking water with or without Hcy (1.8 g/L) for 4 weeks. Rituximab was administered to HHcy 2K1C mice (i.p. 75 μg/20 g body weights every other day for 4 weeks). a Iron concentrations in kidney tissues were measured using ELISA. n = 6. bd Quantitative PCR analysis of the genes associated with iron metabolism in kidney tissues, including tf (b), tfr (c) and slc40a1 (d). n = 6. e Western blot analysis of TF, TFR, and SLC40A1 protein expression and quantification in kidney tissues. β-actin was used as an internal control. n = 3. f Quantitative PCR analysis of the genes associated with iron metabolism in the renal CD31-positive GECs from frozen section by laser capture microdissection, including tfr and slc40a1. n = 3. TF transferrin, TFR transferrin protein receptor, slc40a1 solute carrier family 40 member 1, HE staining hematoxylin and eosin staining, PAS staining periodic acid-Schiff staining. All data are expressed as the means ± SEM. *P < 0.05, **P < 0.01
Fig. 5
Fig. 5
Ferroptosis mediates GECs dysfunction induced by anti-β2GPI antibody derived from Hcy-activated B cells in vitro. We evaluated the bioactive effects of Hcy-activated B cell-derived antibodies, particularly anti-β2GPI, on GECs. Ferrostatin-1 (Fer-1, 5 μM) was administered to Hcy-B CM + Ang II GECs to inhibit ferroptosis. a Cellular RNA was sequenced by RNA‐Seq, and the top 20 GO enrichment results between the differentially expressed genes in con-B CM + Ang II and Hcy-B CM + Ang II treated GECs were shown. b LDH release into GEC culture medium was measured using an ELISA kit. n = 6. c Quantitative PCR analysis of redox enzyme expression in GECs, including ACSL4, LOX12, LOX15, GPX4, and SLC7A11. n = 6. d Western blot analysis of LOX15 and GPX4 protein expression and quantification. β-actin was used as an internal control. n = 3. e, f The intracellular LPO (e) and MDA (f) levels in GECs were measured using ELISA. n = 6. g For flow cytometry analysis, GECs were treated with or without Ang II (1 μM) and with or without Hcy (100 μM)-activated B cell culture supernatant for 24 h, and 5 μM BODIPY-C11 dye was added during the last hour and resuspended in culture medium. The cells were washed twice with ice-cold PBS, stained with 7-AAD for 5 min, trypsinized and filtered into single-cell suspensions. Flow cytometry analysis was performed using a PE-Texas Red filter for reduced BODIPY-C11 and an FITC filter for oxidized BODIPY-C11. h HPLC-MS/MS analysis of phospholipids and oxidized phospholipids in GECs from each group. Heatmap illustrating the phospholipid metabolic profiles in GECs. n = 4. i, j Quantitative PCR analysis of TFR (i) and SLC40A1 (j) associated with iron metabolism in GECs. n = 6. k Western blot analysis of TFR and SLC40A1 protein expression and quantification in kidney tissues. β-actin was used as an internal control. n = 3. l, m Intracellular iron concentrations in GECs were measured using ELISA (l, n = 4) and Phen Green SK (PGSK) staining was assessed using flow cytometry (m, n = 3). Higher Fe2+ concentrations are indicated by weaker PGSK fluorescence intensity. The reductions in PGSK fluorescence intensity were calculated. NHIgG and aPL treatment of GECs. All data are expressed as the means ± SEM. *P < 0.05, **P < 0.01
Fig. 6
Fig. 6
aPL induce ferroptosis in GECs in vitro. Evaluation of purified antiphospholipid antibodies (aPL, 100 μg/ml) and control IgG (NHIgG, 100 μg/ml) on GECs. a LDH release was measured using an ELISA kit. n = 3. b, c Quantitative PCR and western blot analysis of redox and iron metabolism enzymes expression in GECs, including ACSL4, LOX15, GPX4, SLC7A11, TFR, and SLC40A1. d, e The intracellular LPO (d) and MDA (e) levels in GECs were measured using ELISA. n = 3. f Detection of lipid peroxides by BODOPY-C11. n = 3. g, h Intracellular GSSG/GSH (g) and NADP+/NADPH (h) ratios in GECs were measured using ELISA. n = 3. i Intracellular iron concentrations in GECs were measured using PGSK staining. n = 3. LDH lactate dehydrogenase. All data are expressed as the means ± SEM. *P < 0.05, **P < 0.01
Fig. 7
Fig. 7
Ferroptosis mediates HHcy-exacerbated kidney injury. Fer-1, a specific ferroptosis inhibitor, was administered to HHcy 2K1C mice at the start of modeling (1 mg/kg/day, i.p. 4 weeks) to evaluate the effect of ferroptosis on kidney damage. ac Plasma Cre (a), BUN (b), and urinary microalbumin (c) were assayed to evaluate renal function using ELISA. n = 6. d Representative HE staining (top) and PAS staining (bottom) (scale bar, 50 μm) in kidney paraffin sections. Quantification of the glomerular matrix index was performed for each group (50 glomeruli/mice, n = 6/group). e, f Kidney tissue lysates were prepared and evaluated for LPO (e) and MDA (f) using ELISA. n = 6. All data are expressed as the means ± SEM. *P < 0.05, **P < 0.01
Fig. 8
Fig. 8
Schematic diagram. HHcy aggravates hypertensive kidney damage by activating B lymphocytes to secrete pathological anti-β2GPI IgG, which promotes lipid peroxidation and ferroptosis in hypertensive glomerular endothelial cells

References

    1. Wang X, et al. Efficacy of folic acid supplementation in stroke prevention: a meta-analysis. Lancet. 2007;369:1876–1882. doi: 10.1016/S0140-6736(07)60854-X. - DOI - PubMed
    1. Huo Y, et al. Efficacy of folic acid therapy in primary prevention of stroke among adults with hypertension in China: the CSPPT randomized clinical trial. J. Am. Med. Assoc. 2015;313:1325–1335. doi: 10.1001/jama.2015.2274. - DOI - PubMed
    1. McCully KS. Homocysteine and vascular disease. Nat. Med. 1996;2:386–389. doi: 10.1038/nm0496-386. - DOI - PubMed
    1. Wu CC, et al. Role of homocysteine in end-stage renal disease. Clin. Biochem. 2012;45:1286–1294. doi: 10.1016/j.clinbiochem.2012.05.031. - DOI - PubMed
    1. Heinz J, Kropf S, Luley C, Dierkes J. Homocysteine as a risk factor for cardiovascular disease in patients treated by dialysis: a meta-analysis. Am. J. Kidney Dis. 2009;54:478–489. doi: 10.1053/j.ajkd.2009.01.266. - DOI - PubMed

Publication types