Review
. 2023 Jan 3;4(3):192-215.
doi: 10.1039/d2cb00207h. eCollection 2023 Mar 8.

Protein-protein interfaces in molecular glue-induced ternary complexes: classification, characterization, and prediction

Affiliations
Review

Protein-protein interfaces in molecular glue-induced ternary complexes: classification, characterization, and prediction

Huan Rui et al. RSC Chem Biol. .

Abstract

Molecular glues are a class of small molecules that stabilize the interactions between proteins. Naturally occurring molecular glues are present in many areas of biology where they serve as central regulators of signaling pathways. Importantly, several clinical compounds act as molecular glue degraders that stabilize interactions between E3 ubiquitin ligases and target proteins, leading to their degradation. Molecular glues hold promise as a new generation of therapeutic agents, including those molecular glue degraders that can redirect the protein degradation machinery in a precise way. However, rational discovery of molecular glues is difficult in part due to the lack of understanding of the protein-protein interactions they stabilize. In this review, we summarize the structures of known molecular glue-induced ternary complexes and the interface properties. Detailed analysis shows different mechanisms of ternary structure formation. Additionally, we also review computational approaches for predicting protein-protein interfaces and highlight the promises and challenges. This information will ultimately help inform future approaches for rational molecular glue discovery.


Conflict of interest statement

All authors are employees and stockholders for Amgen, Inc.

Figures
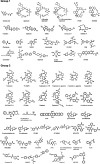
Scheme 1
Scheme 1. All molecular glues in Table 1.
Fig. 1
Fig. 1. Summary of all molecular glue-induced ternary complexes. (A) Breakdown of complexes in Table 1 into two groups based on the interaction mode. (B) Two example structures showing Group 1 (left, DCAF15-indisulam-RBM39, PDB ID: 6UD7) and Group 2 (right, TIR1-1NAA-IAA7, PDB ID: 2P1O) interaction modes. The effector proteins are shown in surface presentation and the binding partner proteins are shown in cartoon representation. The bound molecular glue molecules are shown in yellow. The graphics are generated using PyMOL. (C) Breakdown of complexes by effector proteins. The names of the effector proteins are shown in the outer perimeter of the pie chart with blue (Group 1) and orange (Group 2) indicating the mode of interactions.
Fig. 2
Fig. 2. PPI BSA of complexes in different datasets and their relationship with experimentally measured intrinsic protein–protein interaction KD. (A) Average PPI BSA in four datasets. The PPI BSA for each complex is computed by taking the difference between two solvent accessible surface areas (SASA). One of them is the sum of the SASA of the two proteins as monomers. The other is the SASA of the two proteins as a complex. The difference is the reported PPI BSA. Molecular glues are excluded when computing the PPI BSA for Group 1 and 2 complexes. Standard deviation is reported for Group1, 2, and DB5.5. A two-tailed student t-test is performed on the BSA from Group 1 and Group 2. A p-value of 0.019 is achieved, indicating the observed difference is statistically significant. DIPS dataset is randomly sampled 20 times and each time with 500 samples to produce a standard error, which is reported. All properties reported below for DIPS are sampled using this scheme. (B) Shows the scatter plots of natural log of KD against the PPI BSA for Group 1 (blue) and 2 (orange) complexes with known protein–protein binding affinities (KD).
Fig. 3
Fig. 3. Interface amino acid preference profiles. The protocol below describes how the preference profile is computed. First, an interface residue list is generated for a complex. Each residue is counted once even if there are multiple occurrences at an interface. The lists of all complexes in a dataset are added up based on residue types and normalized by the total number of complexes in the dataset. The value of the preference is between zero and one. With a zero indicating a residue that is missing from all PPI in the dataset and one indicating that this residue is ubiquitous in all PPI in the dataset at hand. Interface residues are defined as residues that are within 4.5 Å of any non-hydrogen atoms from the interacting protein. Residues with modifications like phosphorylation and protonation are counted as their original form. The 20 residues are color by their properties: negatively charged (red), positively charged (blue), polar (magenta), hydrophobic (green), and others (yellow). Phosphorylated residues (Ser, Thr, and Tyr) are represented with a darker shade of color. The residues with statistically significant difference in residue preference between Group 1 and 2 are marked with a star. These include Gln, His, Phe, and Pro with p-values at 0.0292, 0.0003, 0.0292, and 0.0008, respectively.
Fig. 4
Fig. 4. Residue pair preference profiles. The residue pair preference profile is calculated using the procedure below. All pairs of residue–residue interaction counts are recorded for an interface, resulting in a 20 by 20 matrix. The interaction matrices are then averaged over all complexes in the dataset without normalization. The higher the value, the more prevalent such pair of interaction is observed in a dataset. Interacting residue pairs are defined as those with any non-hydrogen atoms within 4.5 Å of each other and the two residues must be from two different proteins. Residues with modifications like phosphorylation and protonation are counted as their original form.
Fig. 5
Fig. 5. Ligand–protein BSA of all structures in Table 1. For those effector proteins with multiple binding partners (e.g., FKBP12 and 14-3-3), all of them are included in this plot with the same color and shape indicating the same effector protein. Ligand–protein BSA is computed in a similar fashion as the PPI BSA. In a molecular glue induced ternary complex, the ligand (i.e., molecular glue) interacts with both protein partners. The BSA of the two interfaces are calculated separately. For each of the ligand–protein interface, the SASA is computed for the two components alone and for the complex. The difference is then calculated and reported as the final ligand–protein BSA. The two ligand–protein BSA for a complex are then ranked by their magnitudes, resulting in a smaller and a larger BSA. Plotting the smaller BSA against larger BSA resulted in this plot. The complexes are colored by their effector proteins, with the shape indicating which group of interaction mode they belong to (Group 1: circle and Group 2: diamond). The size of the symbols indicates the size of the PPI BSA of the complex. The PDB IDs of these complexes can be found in Table 1.
Fig. 6
Fig. 6. (A) Binding of antagonist GW6471 (yellow) to the PPARα receptor (blue) alters the AF-2 helix (red) conformation (left; PDB ID: 1KKQ) compared to when PPARα is bound to an agonist GW409544 (magenta) (right; PDB ID: 1K7L). The conformational difference in the AF-2 helix dictates the binding partner protein whether it is the co-repressor peptide SMRT (left; orange) or a co-activator peptide (right; cyan). (B) Binding of CR8 (yellow) to CDK12 (blue) alters the conformation of its C-terminal region (red) (left; PDB ID: 6TD3) compared to when CDK12 is inactive and bound to ADP (magenta) (right; PDB ID: 4NST). The new conformation of the CDK12 C-terminus resulted from CR8 binding is well-suited to bind to DDB1 (left; orange). (C) The protein binding area (light orange) and the ligand binding pocket (light yellow) in FKBP12 (blue) shown in surface presentation (left). The protein binding area (light blue) and the ligand binding surface (light yellow) in FRAP (orange) shown in surface presentation (middle). Binding of rapamycin (yellow) changes the surface of FKBP12 (blue), making it favorable for FRAP binding (right). The structures are taken from the FKBP12-rapamycin-FRAP complex (PDB ID: 1FAP). (D) The protein binding area (light orange) and the ligand binding surface (light yellow) in GluN2B (blue) shown in surface presentation (left). The protein binding area (light blue) and the ligand binding surface (light yellow) in GluN1 (orange) shown in surface presentation. The structures are taken from the GluN2B-ifenprodil-GluN1 complex (PDB ID: 3QEL).
Fig. 7
Fig. 7. Molecular glue-induced ternary structure formation mechanism. (left) The elementary reactions leading to ternary complexes. There are two paths for ternary structure formation. Path 1 starts from protein–protein binding while Path 2 starts from protein and molecular glue binding. Both paths meet at the final product – the formed ternary complex. (right) Three examples showing complexes with different ternary structure formation mechanisms. In the complex formed by GluN2B, ifenprodil, and GluN1, Path 1 dominates with K1D,GluN2B-GluN1 = 1 μM, K2D,GluN2B-ifenprodil = N.D., and K3D,GluN2B-ifenprodil-GluN1 = 50 nM. In the complex formed by CRBN, lenalidomide, and CK1α, no single path dominates the ternary structure formation (K1D,CRBN-CK1α = 2 μM, K2D,CRBN-lenalidomide = 180 nM, K4D,CRBN-lenalidomide-CK1α = 12 nM). In the complex formed by FKBP12-rapamycin-FRAP, Path 2 dominates with K1D,FKBP12-FRAP = N.D., K2D,FKBP12-rapamycin = 0.2 nM, K4D,FKBP12-rapamycin-FRAP = 12 nM. The color schemes of the components follow those in the graph on the left. These components include P1, P1–P2, P1-MG-P2, and P1-MG starting from the left, going clockwise. The edges connecting the symbols represent the reaction fluxes between different states. The thickness is a rough indication of the amount of flux with thicker lines representing higher flux and route dominance.
None
Huan Rui
None
Kate S. Ashton
None
Jaeki Min
None
Connie Wang
None
Patrick Ryan Potts

References

    1. Ito T. Ando H. Suzuki T. Ogura T. Hotta K. Imamura Y. Yamaguchi Y. Handa H. Identification of a Primary Target of Thalidomide Teratogenicity. Science. 2010;327(5971):1345–1350. doi: 10.1126/science.1177319. - DOI - PubMed
    1. Matyskiela M. E. Couto S. Zheng X. Lu G. Hui J. Stamp K. Drew C. Ren Y. Wang M. Carpenter A. Lee C.-W. Clayton T. Fang W. Lu C.-C. Riley M. Abdubek P. Blease K. Hartke J. Kumar G. Vessey R. Rolfe M. Hamann L. G. Chamberlain P. P. SALL4 mediates teratogenicity as a thalidomide-dependent cereblon substrate. Nat. Chem. Biol. 2018;14(10):981–987. doi: 10.1038/s41589-018-0129-x. - DOI - PubMed
    1. Chamberlain P. P. Lopez-Girona A. Miller K. Carmel G. Pagarigan B. Chie-Leon B. Rychak E. Corral L. G. Ren Y. J. Wang M. Riley M. Delker S. L. Ito T. Ando H. Mori T. Hirano Y. Handa H. Hakoshima T. Daniel T. O. Cathers B. E. Structure of the human Cereblon–DDB1–lenalidomide complex reveals basis for responsiveness to thalidomide analogs. Nat. Struct. Mol. Biol. 2014;21(9):803–809. doi: 10.1038/nsmb.2874. - DOI - PubMed
    1. Krönke J. Udeshi N. D. Narla A. Grauman P. Hurst S. N. McConkey M. Svinkina T. Heckl D. Comer E. Li X. Ciarlo C. Hartman E. Munshi N. Schenone M. Schreiber S. L. Carr S. A. Ebert B. L. Lenalidomide Causes Selective Degradation of IKZF1 and IKZF3 in Multiple Myeloma Cells. Science. 2014;343(6168):301–305. doi: 10.1126/science.1244851. - DOI - PMC - PubMed
    1. Lu G. Middleton R. E. Sun H. Naniong M. Ott C. J. Mitsiades C. S. Wong K.-K. Bradner J. E. Kaelin W. G. The Myeloma Drug Lenalidomide Promotes the Cereblon-Dependent Destruction of Ikaros Proteins. Science. 2014;343(6168):305–309. doi: 10.1126/science.1244917. - DOI - PMC - PubMed