. 2023;17(3):231-235.
doi: 10.1038/s41566-022-01139-z. Epub 2023 Jan 16.

Laser-guided lightning

Affiliations

Laser-guided lightning

Aurélien Houard et al. Nat Photonics. 2023.

Abstract

Lightning discharges between charged clouds and the Earth's surface are responsible for considerable damages and casualties. It is therefore important to develop better protection methods in addition to the traditional Franklin rod. Here we present the first demonstration that laser-induced filaments-formed in the sky by short and intense laser pulses-can guide lightning discharges over considerable distances. We believe that this experimental breakthrough will lead to progress in lightning protection and lightning physics. An experimental campaign was conducted on the Säntis mountain in north-eastern Switzerland during the summer of 2021 with a high-repetition-rate terawatt laser. The guiding of an upward negative lightning leader over a distance of 50 m was recorded by two separate high-speed cameras. The guiding of negative lightning leaders by laser filaments was corroborated in three other instances by very-high-frequency interferometric measurements, and the number of X-ray bursts detected during guided lightning events greatly increased. Although this research field has been very active for more than 20 years, this is the first field-result that experimentally demonstrates lightning guided by lasers. This work paves the way for new atmospheric applications of ultrashort lasers and represents an important step forward in the development of a laser based lightning protection for airports, launchpads or large infrastructures.

Keywords: Nonlinear optics; Plasma physics; Ultrafast photonics.


Conflict of interest statement

Competing interestsThe authors declare no competing interests.

Figures
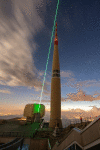
Fig. 1
Fig. 1. Image of the 124-m-high telecommunication tower of Säntis (Switzerland).
Also shown is the path of the laser recorded with its second harmonic at 515 nm.
Fig. 2
Fig. 2. Snapshots of the lightning event of 24 July 2021 (L2) recorded in the presence of the laser.
a,b, Snapshot recorded by the two high-speed cameras located at Schwaegalp (a) and Kronberg (b). The trajectory of the laser path taken subsequently in clear sky through second harmonic generation is also overlaid.
Fig. 3
Fig. 3. High-speed camera images of upward leaders.
a, Images of the lightning path in the presence of the laser recorded on 24 July 2021 (L2) at 250, 375, 915 and 2,750 µs after initiation of the discharge. b, Images of the lightning path recorded on 2 July 2019 in the absence of a laser 200, 400, 900 and 3,000 µs after initiation of the discharge.
Fig. 4
Fig. 4. Measurements with VHF interferometer.
a,b, Two-dimensional maps of the VHF sources emitted during the lightning event L1 with the laser on (a) and event N6 without the laser (b). The telecommunication tower is in black whereas the laser path is in red (continuous red line when the laser is present, and dashed red line when the laser is off). Each point corresponds to a VHF emission. The colour scale bars displayed on the right correspond to the timescale. The violet section shows the region in which laser filamentation is expected.
Fig. 5
Fig. 5. Electric signals measured for the three positive upward flashes.
ac, Electric signals measured for the three positive upward flashes L1 (a), L3 (b) and N6 (c). Top: the electric field scale is given on the left y-axis and the current on the right y-axis. Bottom: X-ray signals detected by the scintillator, where each peak corresponds to the integrated X-rays energy collected during the 50 ns sampling. Events L1 and L3 correspond to events with a laser, whereas N6 corresponds to an event without a laser.
Extended Data Fig. 1
Extended Data Fig. 1. Experimental set-up.
a, Layout of the experimental setup on top of the Säntis Mountain. b, Photography of the experiment with the second harmonic of the laser beam used to visualize the laser path.
Extended Data Fig. 2
Extended Data Fig. 2. Locations of the different measuring equipments.
The Säntis lightning measurement system consists of two fast electric field sensors, a field mill, three full HD cameras, two high speed cameras and two X-rays sensors. Data from the weather radar covering the Säntis Tower area are also made available by MeteoSwiss. Lightning currents of strikes to the tower were measured by a set of Rogowski coils and B-dot sensors located at two different heights along the tower (see refs. , for more information on the Säntis Tower instrumentation). The lightning activity was detected, located in azimuth and elevation, and GPS-time-stamped by a radiofrequency interferometer in the 1–160 MHz band whose upper cutoff was limited to 84 MHz to avoid interference from FM radio transmitters in the area. We checked that, without electric activity in the atmosphere, the interferometer is fully insensitive to the laser system and to the laser induced filaments. An X-ray detector located in the radome measured the X-rays emitted in the range 20 keV-1 MeV. Electric field measurements were performed 20 m and 15 km away from the tower. Finally, two high-speed cameras were installed from two viewing angles to provide direct imaging of the lightning strikes in case of clear weather under elevated thunderclouds. Located in Schwägalp and Kronberg, they operated, respectively, at 10,000 and 24,000 frames per second.
Extended Data Fig. 3
Extended Data Fig. 3. Analysis of high-speed camera measurements.
Projected 2D histograms based on single image, comparing a, event L2 with N08 viewed from Säntis, and b, L2 with N05 viewed from Kronberg.
Extended Data Fig. 4
Extended Data Fig. 4. VHF sources position.
Still images could be obtained in only one lightning strike while the laser was flashing, due to the exceptional visibility conditions required. In contrast, the RF interferometer also displays guiding for the 3 recorded events with laser (L1, L3, L4), in the form of a high density of VHF sources close to the laser beam. Typical results with laser (events L1, L3, L4) are presented respectively in panels ac. Events without laser (N02, N06, N07) in panels df. Each panel displays 2D (vertical and horizontal distances from the top of the tower) maps of the sources constituting lightning strikes on the tower. The colour code displayed on the right corresponds to the timescale. The Säntis Tower is represented on each plot in black, the laser path in red, and the part of the laser path over which filaments are expected in violet. The dashed red line in the lower panels represents the path that the absent laser beam would have followed.
Extended Data Fig. 5
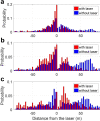
Extended Data Fig. 5. Histograms of VHF source distance to the laser beam.
Comparison of the cumulated histograms of distance to the laser beam per height slice of 30 m for all events with and without laser. a, b and c correspond respectively, to the height slices 0–30 m, 30–60 m, and 60–90 m. When the laser is on, the distribution is centred closer to the laser beam, and narrower, as compared to when the laser is off.
Extended Data Fig. 6
Extended Data Fig. 6. Geometry considered for the simulation.
The laser filament is assumed to be located vertically and directly above the tower tip. Left panel: conditions associated with a positive flash. Right panel: conditions associated with a negative flash.
Extended Data Fig. 7
Extended Data Fig. 7. Simulation of the effect of laser filamentation on the lightning flashes initiation.
Magnitude of the background electric fields necessary to initiate laser assisted positive lightning flashes (red curves marked ‘a’) and laser-assisted negative lightning flashes (blue curves marked ‘b’), as a function of the gap length between the lower tip of the laser filament and the tower tip. The curves marked ‘c’ depict the magnitude of the background electric field necessary for the tower to initiate a negative lightning flash without the assistance of the laser filament. The lengths of the laser filament used in the calculation are given in each diagram. Note that the polarity of the background electric field necessary to initiate a positive lightning flash is opposite to the background electric field necessary to initiate a negative lightning flash. The field presented is not the total field but the background electric field. The absolute electric field at the tower tip is enhanced due to the presence of the tower by a factor of 50 to 100.

References

    1. Turman BN, Edgar BC. Global lightning distributions at dawn and dusk. J. Geophys. Res. 1982;87:1191–1206. doi: 10.1029/JC087iC02p01191. - DOI
    1. Holle, R. L. The number of documented global lightning fatalities. In 24th International Lightning Detection Conference (ILDC, 2016).
    1. Holle, R. L. Some aspects of global lightning impacts. In 2014 International Conference on Lightning Protection (ICLP) 1390–1395 (IEEE, 2014).
    1. Newman, N. M. in Problems of Atmospheric and Space Electricity 482–490 (Elsevier, 1965).
    1. Gary, C. La Foudre 2nd edn (Masson, 1999).