[Preprint]. 2023 Feb 28:rs.3.rs-2609859.
doi: 10.21203/rs.3.rs-2609859/v1.

Stabl: sparse and reliable biomarker discovery in predictive modeling of high-dimensional omic data

Affiliations

Stabl: sparse and reliable biomarker discovery in predictive modeling of high-dimensional omic data

Julien Hédou et al. Res Sq. .

Update in

  • Discovery of sparse, reliable omic biomarkers with Stabl.
    Hédou J, Marić I, Bellan G, Einhaus J, Gaudillière DK, Ladant FX, Verdonk F, Stelzer IA, Feyaerts D, Tsai AS, Ganio EA, Sabayev M, Gillard J, Amar J, Cambriel A, Oskotsky TT, Roldan A, Golob JL, Sirota M, Bonham TA, Sato M, Diop M, Durand X, Angst MS, Stevenson DK, Aghaeepour N, Montanari A, Gaudillière B. Hédou J, et al. Nat Biotechnol. 2024 Oct;42(10):1581-1593. doi: 10.1038/s41587-023-02033-x. Epub 2024 Jan 2. Nat Biotechnol. 2024. PMID: 38168992 Free PMC article.

Abstract

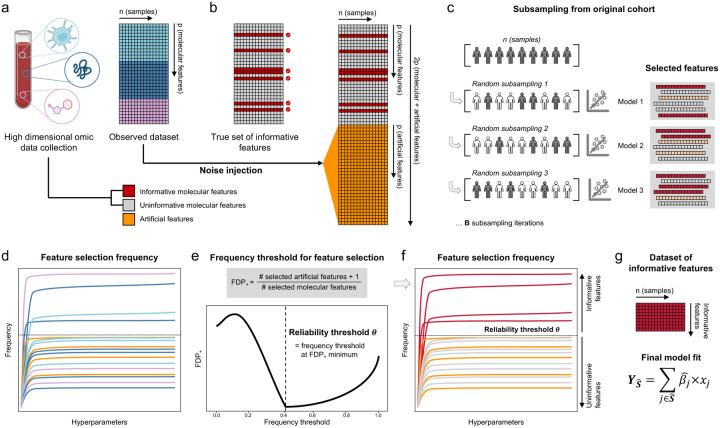
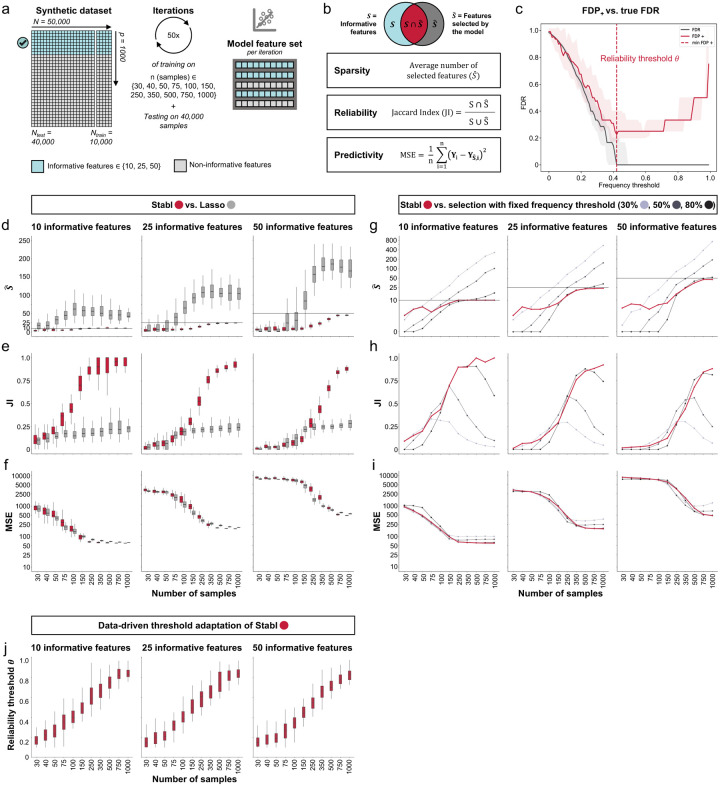
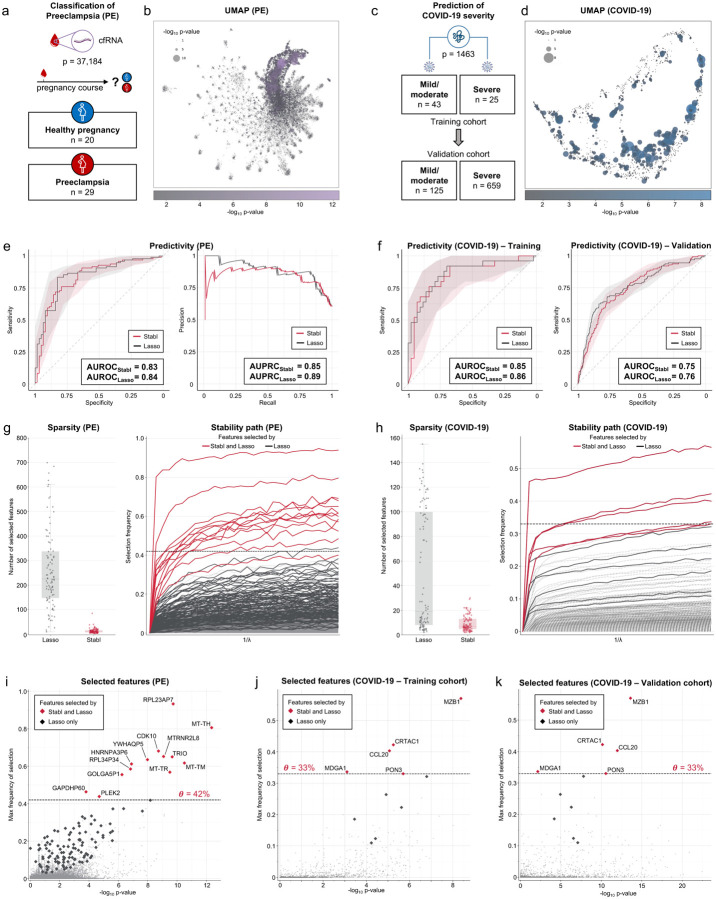
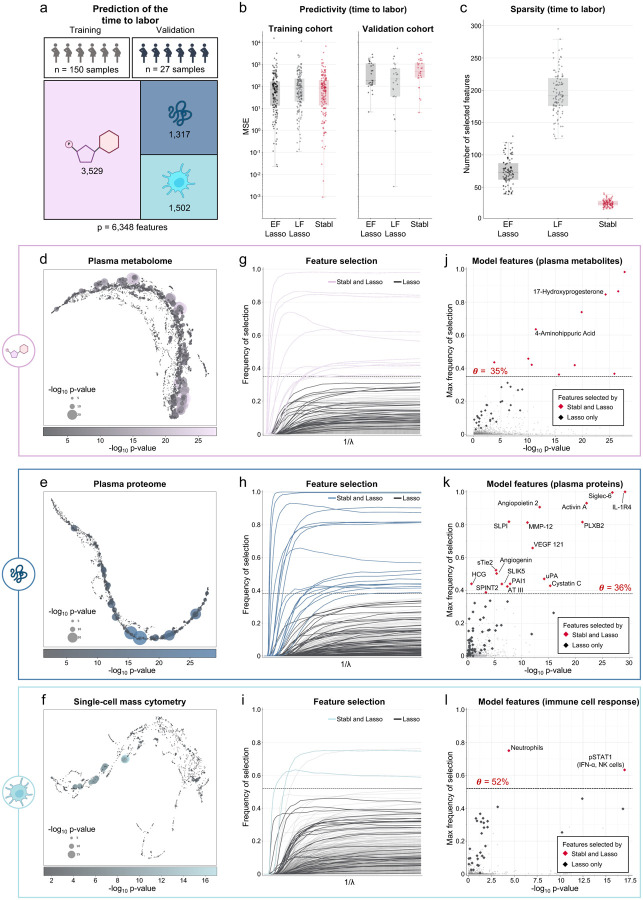
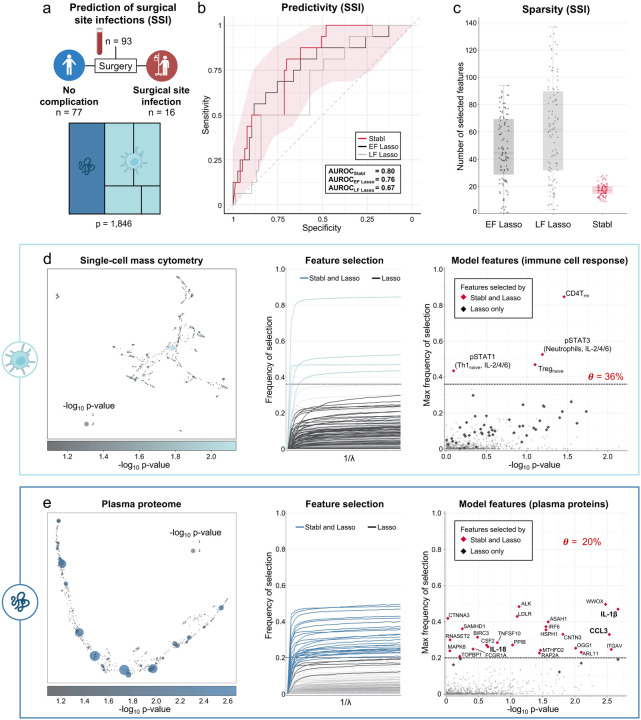
High-content omic technologies coupled with sparsity-promoting regularization methods (SRM) have transformed the biomarker discovery process. However, the translation of computational results into a clinical use-case scenario remains challenging. A rate-limiting step is the rigorous selection of reliable biomarker candidates among a host of biological features included in multivariate models. We propose Stabl, a machine learning framework that unifies the biomarker discovery process with multivariate predictive modeling of clinical outcomes by selecting a sparse and reliable set of biomarkers. Evaluation of Stabl on synthetic datasets and four independent clinical studies demonstrates improved biomarker sparsity and reliability compared to commonly used SRMs at similar predictive performance. Stabl readily extends to double- and triple-omics integration tasks and identifies a sparser and more reliable set of biomarkers than those selected by state-of-the-art early- and late-fusion SRMs, thereby facilitating the biological interpretation and clinical translation of complex multi-omic predictive models. The complete package for Stabl is available online at https://github.com/gregbellan/Stabl.


Figures

Fig. 1 |
Fig. 1 |. Overview of the Stabl algorithm.
a. An original dataset of size n × p is obtained from measurement of p molecular features in each one of n samples. b. Among the observed features, some are informative (related to the outcome, red), and others are uninformative (unrelated to the outcome, grey). p artificial features (orange), all uninformative by construction, are injected into the original dataset to obtain a new dataset of size n × 2p. c. B sub-sample iterations are performed from the original cohort of size n. At each iteration k, Lasso models varying in their regularization parameter λ are fitted on the subsample, which results in a different set of selected features for each iteration. d. In total, for a given λ, B sets or selected features are generated. The proportion of sets in which feature i is present defines the feature selection frequency f!(λ). Plottingf!(λ) against 1/λ yields a stability path graph. Features whose maximum frequency is above a frequency threshold (t) are selected in the final model. e. Stabl uses the reliability threshold (θ), obtained by computing the minimum to the false discovery proportion surrogate (FDP+, see methods). f,g. The set of features with a selection frequency larger than θ (i.e, reliable features) is included in a final predictive model.
Fig. 2 |
Fig. 2 |. Synthetic dataset benchmarking.
a. A synthetic dataset consisting of N = 50,000 samples × p = 1,000 features was generated. Some features are correlated with the outcome (informative features, light blue), while the others are not (uninformative features, grey). Forty thousand samples are held out for validation. Out of the remaining 10,000, 50 sets ranging of sample sizes n ranging from 30 to 1,000 are drawn randomly. c. Three metrics are used to evaluate performance: sparsity (average number of selected features compared to the number of informative features), reliability (Jaccard Index, JI, comparing the true set of informative features to the selected feature set), and predictivity (mean squared error, MSE). c. The surrogate for the false discovery proportion (FDP+, red line) and the experimental false discovery rate (FDR, dotted line) are shown as a function of the frequency threshold. An example is shown for n = 150 samples and 25 informative features (all other conditions are shown in Fig. S1). The FDP+ estimate approaches the experimental FDR around the reliability threshold, θ. d-f. Sparsity (d), reliability (JI, e), and predictivity performances (MSE, f) of Stabl (red box plots) and least absolute shrinkage and selection operator (Lasso, grey box plots) as a function of the number of samples (n, x-axis) for 10 (left panels), 25 (middle panels), or 50 (right panels) informative features. g-i. Sparsity (g), reliability (h), and predictivity (i) performances of models built using a data-driven reliability threshold θ (Stabl, red lines) or a fixed frequency threshold (i.e., SS) of 30% (light grey lines), 50% (Lasso, dark grey lines), or 80% (black lines). The feature set selected by Stabl remains closer in number (sparsity) and composition (reliability) to the true set of informative features, while achieving a superior or comparable predictive performance to models built using a fixed threshold. j. The reliability threshold chosen by Stabl is shown as a function of the sample size (n, x-axis) for 10 (left panel), 25 (middle panel), or 50 (right panel) informative features. Benchmarking of Stabl against elastic net (EN) is shown in Fig. S6.
Fig. 3 |
Fig. 3 |. Performance of Stabl compared to Lasso on transcriptomic and proteomic data.
a. Clinical case study 1: Classification of individuals with normotensive pregnancy or preeclampsia (PE) from the analysis of circulating cell-free RNA (cfRNA) sequencing data. Number of samples (n) and features (p) are indicated. b. UMAP visualization of the cfRNA transcriptomic features, node size and color are proportional to the strength of the association with the outcome calculated as the p-value in a univariate Mann-Whitney test using a −log10 scale. c. Clinical case study 2: Classification of mild vs. severe COVID-19 in two independent patient cohorts from the analysis of plasma proteomic data (Olink). d. UMAP visualization of the proteomic data. Node characteristics as in (b). e. Predictivity performances of Stabl and Lasso for the PE datasets. AUROCStabl = 0.83 [0.76, 0.90], AUROCLasso = 0.84 [0.78, 0.90] (p-value = 0.28, Bootstrap test); AUPRCStabl = 0.85 [0.77, 0.93], AUPRCLasso = 0.89 [0.83, 0.94] (p-value = 0.18) f. AUROC comparing predictive performance of Stabl and Lasso on training (left panel) and validation (right panel) cohorts for the COVID-19 dataset. Training: AUROCStabl = 0.85 [0.74, 0.94], AUROCLasso = 0.86 [0.75, 0.94] (p-value = 0.37). Validation: AUROCStabl = 0.75 [0.71, 0.79], AUROCLasso = 0.76 [0.71, 0.81] (p-value = 0.44). AUPRC are shown in Fig. S12. g-h. Left panels. Sparsity performances for the PE (g, number of features selected across cross-validation iterations, medianStabl = 11.0, IQR = [7.8,16.0], medianLasso = 225.5, IQR = [147.5,337.5], p-value < 1e-16) and COVID-19 (h, medianStabl = 7.0, IQR = [4.8,13.0], medianLasso = 19.0, IQR = [8.0,100.0], p-value = 4e-10) datasets. Right panels. Stability path graphs showing the regularization parameter against the selection frequency. The reliability threshold (θ), is indicated (dotted line) i-k. Volcano plots depicting the reliability performances of Stabl and Lasso for the PE (i), COVID-19 training (j) and COVID-19 validation (k) datasets. The maximum frequency of selection of each feature is plotted against the −log10 p-value using a univariate Mann-Whitney test. Features selected by Stabl/Lasso only are colored in red/black respectively. Features selected by Stabl are labeled. PE: meanlog10(p-value)Stabl = 8.2; meanlog10(p-value)Lasso = 3.3. COVID-19 training: meanlog10(p-value)Stabl = 5.5; meanlog10(p-value)Lasso = 5.2. COVID-19 validation: meanlog(p-value)Stabl = 9.7; meanlog10(p-value)Lasso = 7.8. Benchmarking of Stabl against elastic net (EN) is shown in Fig. S11.
Fig. 4 |
Fig. 4 |. Stabl’s performances on a triple-omic data integration task.
a. Clinical case study 3. Prediction of the time to labor from the longitudinal assessment of plasma proteomic (Olink), metabolomic (untargeted mass spectrometry), and single-cell mass cytometry datasets in two independent longitudinal cohorts of pregnant individuals. b. Predictivity performances (MSE, median, and IQR) for early-fusion (EF), late-fusion (LF) Lasso and Stabl, on the training (left panel) and validation (right panel) cohorts. c. Sparsity performances (number of features selected across cross-validation iterations, medianStabl = 25.0, IQR = [22.0,29.0], medianEF = 73.0, IQR = [61.8,87.3], p-value < 1e-16, medianLF = 191.5, IQR = [175.8,218.8], p-value < 1e-16. d-f. UMAP visualization of the metabolomic (d), plasma proteomic (e), and single-cell mass cytometry (f) datasets. Node size and color are proportional to the strength of the association with the outcome. g-i. Stability path graphs depicting the selection of metabolomic (g), plasma proteomic (h), and single-cell mass cytometry (i) features by Stabl. The data-driven reliability threshold θ is computed for individual omic datasets and indicated by a dotted line. j-l. Volcano plots depicting the reliability performances of Stabl and Lasso for each independent omic data: the metabolomics (j), plasma proteomic (k), and single-cell mass cytometry (l) datasets. The maximum frequency of selection of each feature is plotted against the −log10 p-value using a univariate Mann-Whitney test. Features selected by Stabl/Lasso only are colored in red/black respectively. Features selected by Stabl are labeled.
Fig. 5 |
Fig. 5 |. Candidate biomarker identification using Stabl for analysis of a newly generated multi-omic clinical dataset.
a. Clinical case study 4. Prediction of postoperative surgical site infections (SSI) from the combined plasma proteomic and single cell mass cytometry assessment of pre-operative blood samples in patients undergoing abdominal surgery. b. Predictivity performances (AUROC) for Stabl, early fusion (EF) and late fusion (LF) Lasso. c. Sparsity performances (number of features selected across cross-validation iterations, medianStabl = 17.0, IQR = [15.0,20.0], medianEF = 44.5, IQR = [29.0,69.3], p-value < 1e-16, medianLF = 62.0, IQR = [32.0,89.5], p-value < 1e-16. d-e. UMAP (left panel), stability paths (middle panel), and volcano plots (right panels) visualization of the single-cell mass cytometry (d) and plasma proteomics (e) datasets. The data-driven reliability threshold θ is computed for individual omic datasets and indicated by a dotted line on the volcano plots.

References

    1. Subramanian I., Verma S., Kumar S., Jere A. & Anamika K. Multi-omics Data Integration, Interpretation, and Its Application. Bioinforma. Biol. Insights 14, 1177932219899051 (2020). - PMC - PubMed
    1. Wafi A. & Mirnezami R. Translational –omics: Future potential and current challenges in precision medicine. Methods 151, 3–11 (2018). - PubMed
    1. Dunkler D., Sánchez-Cabo F. & Heinze G. Statistical Analysis Principles for Omics Data. in Bioinformatics for Omics Data: Methods and Protocols (ed. Mayer B.) 113–131 (Humana Press, 2011). doi:10.1007/978-1-61779-027-0_5. - DOI - PubMed
    1. Ghosh D. & Poisson L. M. “Omics” data and levels of evidence for biomarker discovery. Genomics 93, 13–16 (2009). - PubMed
    1. Tibshirani R. Regression Shrinkage and Selection Via the Lasso. J. R. Stat. Soc. Ser. B Methodol. 58, 267–288 (1996).

Publication types

LinkOut - more resources