[Preprint]. 2023 Feb 27:2023.02.26.529772.
doi: 10.1101/2023.02.26.529772.

FOXP3+ regulatory T cells use heparanase to access IL-2 bound to ECM in inflamed tissues

Affiliations

FOXP3+ regulatory T cells use heparanase to access IL-2 bound to ECM in inflamed tissues

Hunter A Martinez et al. bioRxiv. .

Update in

Abstract

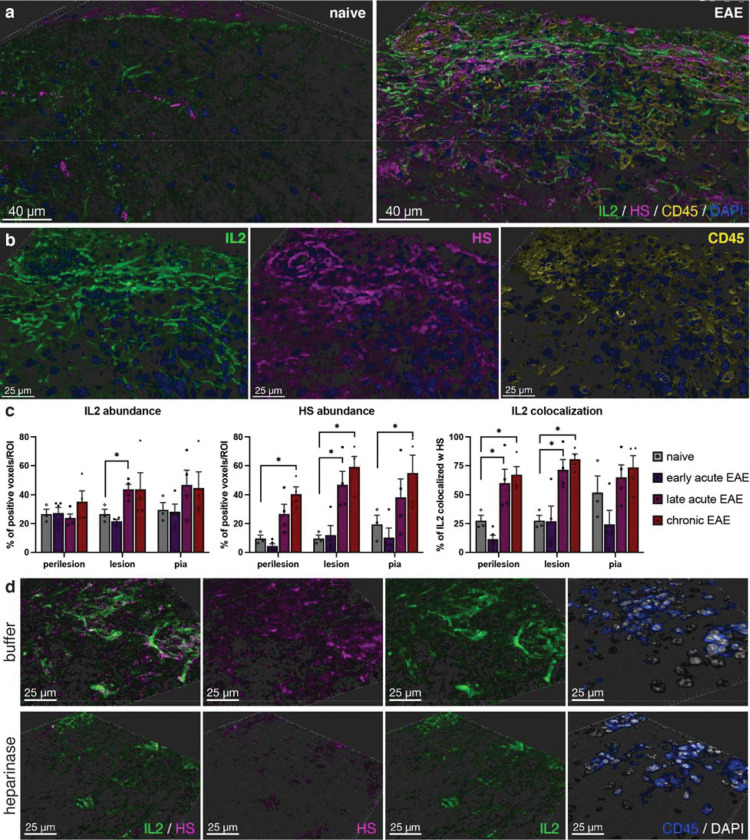
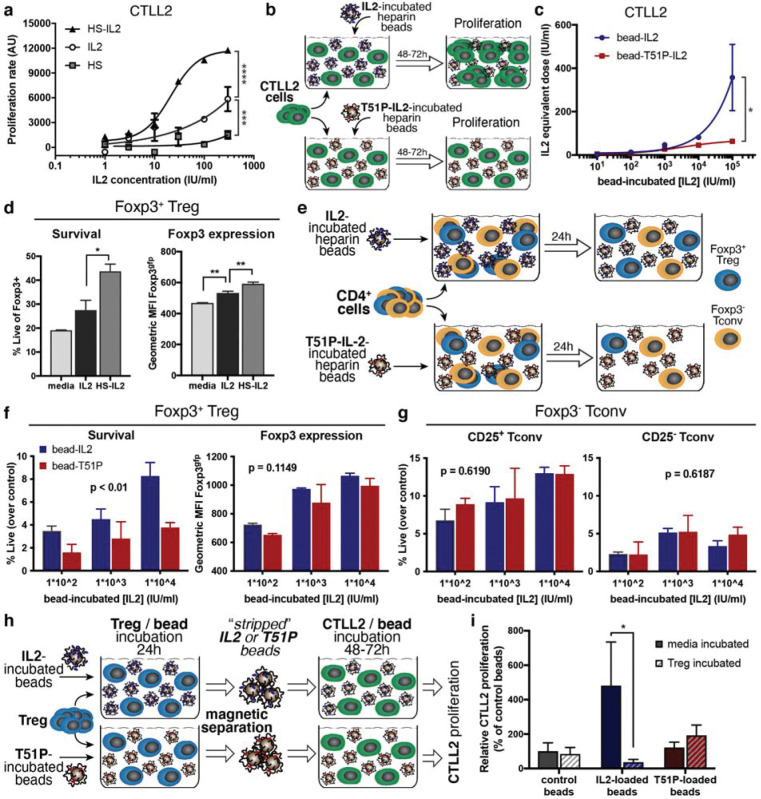
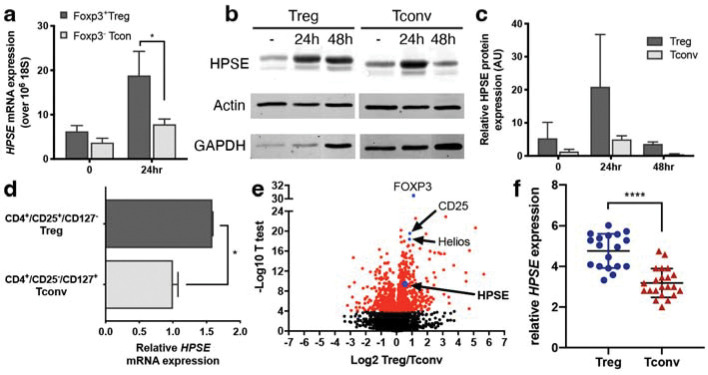
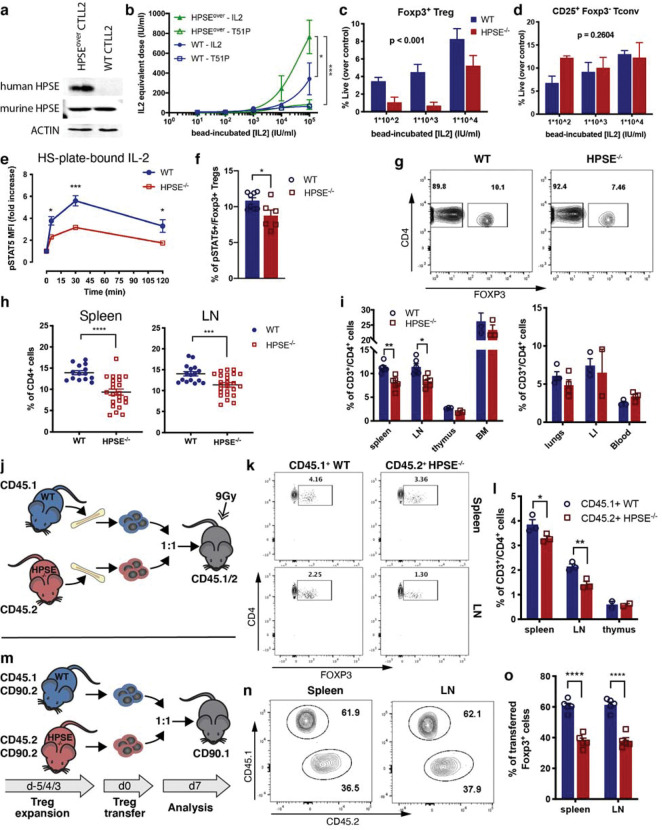
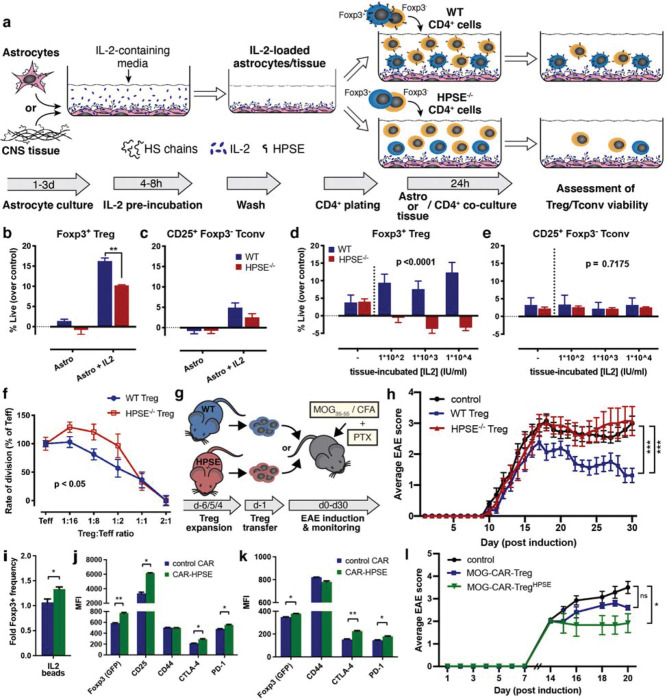
FOXP3+ regulatory T cells (Treg) depend on exogenous IL-2 for their survival and function, but circulating levels of IL-2 are low, making it unclear how Treg access this critical resource in vivo. Here, we show that Treg use heparanase (HPSE) to access IL-2 sequestered by heparan sulfate (HS) within the extracellular matrix (ECM) of inflamed central nervous system tissue. HPSE expression distinguishes human and murine Treg from conventional T cells and is regulated by the availability of IL-2. HPSE-/- Treg have impaired stability and function in vivo, including the experimental autoimmune encephalomyelitis (EAE) mouse model of multiple sclerosis. Conversely, endowing Treg with HPSE enhances their ability to access HS-sequestered IL-2 and their tolerogenic function in vivo. Together, these data identify novel roles for HPSE and the ECM in immune tolerance, providing new avenues for improving Treg-based therapy of autoimmunity.


Conflict of interest statement

Competing interests: Authors declare no competing interests.

Figures

Figure 1.
Figure 1.. IL-2 and HS colocalize at sites of autoimmune neuroinflammation.
a, Imaris surface rendering of immunofluorescent staining for IL-2 (green), HS (magenta) and CD45 (yellow) in naïve of EAE spinal cord tissue (29 days post immunization (dpi)). DAPI nuclear counterstain shown in blue. Representative of 3 separate EAE experiments. b, Detail of IL2 (green), HS (magenta) and CD45 (yellow) immunoreactivity in an EAE lesion. c, Imaris quantification of abundance of IL2 and HS immunoreactivity, and fraction of IL-2 colocalized with HS in naïve and EAE spinal cord tissue at different time points (early acute: 14 dpi, late acute: 29 dpi, chronic 40 dpi). Imaris colocalization analysis was done in areas surrounding CD45 cell infiltration (perilesion), areas with CD45 cell infiltration (lesion) and in the glia limitans underlying the meninges (pia). * P < 0.05, Mann-Whitney test, n = 3–5 separate areas analyzed per condition. d, Immunofluorescent staining for IL-2 (green) and HS (magenta) of a cerebellar EAE lesion that was treated with heparinase from Flavobacterium heparinum before immunofluorescent staining, or buffer treatment of a serial section as a control. CD45 (blue) staining is show to depict areas with immune cell infiltration. Representative of 2 separate experiments.
Figure 2.
Figure 2.. HS-bound IL-2 supports Treg homeostasis.
a, CTLL2 proliferation, measured by resazurin reduction (arbitrary fluorescence units (AU)), in response to human recombinant IL-2 alone or pre-incubated with HS at a molecular ratio of 5:1. Equivalent doses of HS were used as a control. *** p < 0.001, **** p < 0.0001, two-way ANOVA. Shown is a representative of 4 independent experiments (mean +/− SEM of duplicate samples). b, Schematic overview of CTLL2 proliferation induced by heparin-coated beads pre-incubated with IL-2 or T51P-IL-2, an IL-2 mutant that has reduced binding to HS. c, CTLL2 proliferation in response to heparin-coated beads pre-incubated with IL-2 or T51P-IL-2. The concentration of IL-2 or T51P-IL-2 at which the beads were pre-incubated is depicted on the x-axis. Proliferation rate is shown as equivalent dose of soluble IL-2 or T51P-IL-2 at which a similar proliferative response is elicited as by the respective pre-incubated beads. Shown is a representative of 3 independent experiments (mean +/− SEM of triplicate samples). * p < 0.05, two-way ANOVA. d, Viability and FOXP3gfp expression of induced FOXP3+ Treg, cultured in the presence of low-dose human recombinant IL-2 (20 IU/ml) alone, or IL-2 pre-incubated with HS, as described in Fig. 2A. Viability and FOXP3gfp expression were measured by flow cytometry 72hr after start of induction. Shown is a representative of 5 independent experiments (mean + SEM of triplicate samples), * p < 0.05, ** p < 0.01, one-way ANOVA with Tukey’s multiple comparison correction. e, Schematic overview of the assay used to assess persistence of Treg induced by heparin-coated beads pre-incubated with IL-2 or mutant T51P-IL-2. f and g, Viability and FOXP3gfp expression of FOXP3+ Treg (f) and (g) viability of CD25+ and CD25 FOXP3 Tconv, among CD4+ T cells cultured in the presence of heparin-coated beads pre-incubated with IL-2 or T51P-IL-2 (T51P). Cells were analyzed by flow cytometry 24 hr after start of culture. Percentage of viable cells among (f) FOXP3+ or (g) FOXP3 cells is depicted, corrected for baseline viability of cells cultured in media only (without IL-2). All panels show representatives of 4 independent experiments (mean + SEM of triplicate samples); p-values depict variation due to the cytokine that the beads were incubated with (IL-2 vs. T51P-IL-2), determined by two-way ANOVA. h, Schematic overview of the assay designed to assess the effectiveness of Treg-mediated stripping of IL-2 from heparin-coated beads. Heparin-coated beads previously incubated with IL-2 or mutant T51P-IL-2 (T51P) were incubated with or without Treg overnight. These beads were then magnetically separated from Treg, washed, and added to CTLL2 cells. Proliferation of CTLL2 cells in response to residual bead-bound IL-2 was subsequently measured after 72 hours. i, CTLL2 proliferation in response to IL-2 and T51P-IL-2-pre-incubated beads cultured with or without Treg. Proliferation rate is shown as percentage of proliferation in response to control beads, that were incubated in media in both pre-incubation steps. Shown is a representative of 3 independent experiments (mean + SEM of 6 wells per sample). * p < 0.05, two-way ANOVA with Sidak’s multiple comparison correction.
Figure 3.
Figure 3.. Enhanced HPSE expression after activation characterizes Treg.
a, HPSE mRNA expression in FACS sorted murine FOXP3+ Treg and FOXP3 Tconv after in vitro activation with aCD3/aCD28 (24h). Shown are mean relative expression + SEM of 3 independent experiments, compared to resting Tconv and normalized by 18S mRNA expression. * p < 0.05, two-way ANOVA. b, Western blot analysis and c, semi-quantitation of HPSE protein expression in murine Treg and Tcon after in vitro activation with aCD3/aCD28. Actin was used as a control to normalize quantitation. d, HPSE mRNA expression in FACS sorted and in vitro activated human CD4+/CD25+/CD127 Treg and CD4+/CD25/CD127+ Tconv. Shown are mean relative HPSE expression +/− SEM of technical triplicates of a representative of 2 experiments, compared to Tconv and normalized by β-actin expression. * p < 0.05, unpaired two-tailed t-test. e, Volcano plot of statistical significance against fold change of genes differentially expressed between Treg and Teff isolated from human colon tissue. f, HPSE mRNA expression in FACS sorted CD4+/CD25+/CD127 Treg and CD4+/CD25/CD127+ Tconv isolated from human colon tissue. Shown are mean relative HPSE expression +/− SD, **** p < 0.0000001, unpaired two-tailed t-test.
Figure 4.
Figure 4.. HPSE expression supports FOXP3+ Treg homeostasis in vitro and in vivo.
a, Western blot analysis of human HPSE overexpression and mouse HPSE basal expression in CTLL2 cells transfected with HPSE construct (HPSEover), compared to untransfected CTLL2 cells (WT). b, Proliferation of wt CTLL2 cells (WT, blue) and HPSE-overexpressing CTLL2 cells (HPSEover, green) in response to heparin-coated beads that were pre-incubated with IL-2 (closed symbols) or T51P-IL-2 (T51P, open symbols). The concentration of IL-2 or T51P-IL-2 at which the beads were pre-incubated is depicted on the x-axis. Proliferation rate is depicted as equivalent dose of soluble IL2 or T51P-IL-2 at which a similar proliferative response is elicited as by the beads. Shown is a representative of 3 independent experiment (mean +/− SEM of triplicate samples). * p < 0.05, *** p < 0.001, variation due to the combination of the background of cells and the cytokine beads were pre-incubated with, determined with two-way ANOVA with Tukey’s multiple comparison correction. c and d, Viability of wt and HPSE−/− FOXP3+ Treg (c) and CD25+ FOXP3 Tconv (d) among CD4+ T cells cultured in the presence of heparin-coated beads pre-incubated with IL-2. Viability was measured by flow cytometry 24 hr after start of culture. Shown are representatives of 4 independent experiments (mean + SEM of triplicate samples); p-values depict variation due to the genotype (wt vs. HPSE−/−), determined by two-way ANOVA. e, STAT5 phosphorylation in wt and HPSE−/− FOXP3+ Treg after stimulation with IL-2 that was sequestered by plate-bound HS. * p < 0.05, *** p<0.001, two-way ANOVA with Sidak’s multiple comparison correction. f, Percentage of pSTAT5+ cells among CD4+ FOXP3+ Treg isolated from naïve wt and HPSE−/− spleen tissue. g, Representative flow cytometry plots depicting FOXP3+ Treg frequencies among CD4+ T cells in spleen tissue of wt and HPSE−/− mice. h, Percentage of FOXP3+ Treg among CD4+ T cells in the spleens (lefts panel) and inguinal lymph nodes (right panel) of adult (3 to 6-month-old) wt and HPSE−/− mice. Shown are mean + SEM, *** p < 0.001, **** p<0.0001, two-tailed t-test. i, Quantification of FOXP3+ Treg frequencies among CD4+ T cells in lymphoid (left panel) and non-lymphoid (right panel) tissues of wt and HPSE−/− mice. BM, bone marrow; LI, large intestine. j, Schematic overview of competitive bone marrow transplantation of wt and HPSE−/− donors. k, Representative flow cytometry plots depicting FOXP3+ Treg frequencies among transferred CD4+ T cells recovered from spleen and LN tissue of mice engrafted with bone marrow from wt and HPSE−/− mice. l, Frequencies of FOXP3+ cells among wt and HPSE−/− bone marrow-derived CD4+ T cells in lymphoid tissues of irradiated recipient mice. m, Schematic overview of competitive Treg transfer of wt and HPSE−/− donors. n, Representative flow cytometry plots depicting CD45.1+ and CD45.2+ cell frequencies among transferred Treg recovered from spleen and LN tissue of recipient mice. o, Frequencies of CD45.1+ wt and CD45.2+ HPSE−/− among Treg in lymphoid tissues of recipient mice. g, i, l and o, Shown are mean + SEM; * p < 0.05, ** p<0.01, two-tailed t-test with Holm-Sidak multiple comparison correction.
Figure 5.
Figure 5.. HPSE expression supports FOXP3+ Treg function in vitro and in vivo.
a, Schematic overview of experiments designed to assess the ability of Treg to utilize IL-2 bound to U87-MG astrocytes or whole spinal cord (CNS) tissue in an HPSE-dependent manner. Astrocyte monolayers or spinal cord tissue (either freshly isolated and irradiated or snap frozen) from a wt mouse were pre-incubated with human recombinant IL-2 for 4–8 hr. After this cells/tissue were washed, removing any unbound IL-2, and subsequently co-incubated for 24 hours with CD4+ T cells isolated from wt or HPSE−/− mice, after which viability of FOXP3+ Treg and FOXP3 Tconv was assessed by flow cytometry. b and c, Viability of wt and HPSE−/− (b) FOXP3+ Treg and (c) CD25+ FOXP3 Tconv among CD4+ T cells co-cultured with U87-MG cells that were pre-incubated with IL-2 or media alone as a control. d and e, Viability of wt and HPSE−/− (d) FOXP3+ Treg and (e) CD25+ FOXP3 Tconv among CD4+ T cells co-cultured with mouse spinal cord tissue that was pre-incubated with IL-2 or media alone as a control. (b-e) Percent of viable cells among FOXP3+ or FOXP3 cells is depicted, corrected for baseline viability of cell cultured in media alone. All panels show mean + SEM of triplicate samples of a representative of 4 (b and C) or 3 (d and e) independent experiments. (b and c) * p < 0.05, ** p<0.01, two-tailed t-test with Holm-Sidak multiple comparison correction. (d and e) p-values depict variation due to genotype (wt vs. HPSE−/−), determined by two-way ANOVA. f, In vitro suppression of wt effector (FOXP3) T cells (Teff) by wt and HPSE−/− FOXP3+ Treg. The rate of division of Teff is plotted as percentage of unsuppressed Teff. Shown are mean +/− SEM of triplicate wells of a representative of 2 independent experiments. P-value shown: two-way ANOVA between wt and HPSE−/− Treg. g, Schematic overview of transfer of in vivo expanded, CD4+/CD25+ sorted, Treg into wt recipients and subsequent EAE induction. h, In vivo suppression of EAE by wt and HPSE−/− FOXP3+ Treg that were transferred 1 day prior to induction of EAE. Shown is average disease severity +/− SEM of all animals, ** p < 0.01, **** p<0.0001, Friedman test. Shown is a representative of 2 independent experiments. i, Frequency and (j) expression levels of Treg functional markers of FOXP3+ cells among total CD4+ cells transfected with HPSE-CAR after 72h culture with IL-2-incubated heparin beads. Shown are mean + SEM (triplicate samples) of the fold change of percentage FOXP3+ cells, relative to control CAR cultured without IL-2, and of geometric MFI of each marker. k, Expression levels of Treg functional markers on FOXP3+ cells recovered 3 days after adoptive transfer into CD45.2 recipients (n = 3–4 animals per group). i, * p < 0.05, two-tailed t-test (j and k) ** p<0.01, **** p<0.0001, two-way ANOVA with Sidak’s multiple comparison correction. l, In vivo suppression of EAE by control and HPSE-overexpressing MOG-CAR Treg that were transferred on day X after induction of EAE (n = 5–6 animals per group). Shown is average disease severity +/− SEM of all animals, * p < 0.05, Friedman test.

References

    1. Sakaguchi S., Miyara M., Costantino C. M. & Hafler D. A. FOXP3+ regulatory T cells in the human immune system. Nat. Rev. Immunol. 10, 490–500 (2010). - PubMed
    1. Dominguez-Villar M., Baecher-Allan C. M. & Hafler D. A. Identification of T helper type 1–like, Foxp3+ regulatory T cells in human autoimmune disease. Nat. Med. 17, 673–675 (2011). - PMC - PubMed
    1. Haas J. et al. Reduced suppressive effect of CD4+CD25high regulatory T cells on the T cell immune response against myelin oligodendrocyte glycoprotein in patients with multiple sclerosis. Eur. J. Immunol. 35, 3343–52 (2005). - PubMed
    1. Venken K. et al. Compromised CD4+ CD25(high) regulatory T-cell function in patients with relapsing-remitting multiple sclerosis is correlated with a reduced frequency of FOXP3-positive cells and reduced FOXP3 expression at the single-cell level. Immunology 123, 79–89 (2008). - PMC - PubMed
    1. Viglietta V., Baecher-Allan C., Weiner H. L. & Hafler D. A. Loss of functional suppression by CD4+CD25+ regulatory T cells in patients with multiple sclerosis. J. Exp. Med. 199, 971–9 (2004). - PMC - PubMed

Publication types