[Preprint]. 2023 Mar 1:2023.02.28.529447.
doi: 10.1101/2023.02.28.529447.

A scalable, GMP-compatible, autologous organotypic cell therapy for Dystrophic Epidermolysis Bullosa

Affiliations

A scalable, GMP-compatible, autologous organotypic cell therapy for Dystrophic Epidermolysis Bullosa

Gernot Neumayer et al. bioRxiv. .

Update in

  • A scalable and cGMP-compatible autologous organotypic cell therapy for Dystrophic Epidermolysis Bullosa.
    Neumayer G, Torkelson JL, Li S, McCarthy K, Zhen HH, Vangipuram M, Mader MM, Gebeyehu G, Jaouni TM, Jacków-Malinowska J, Rami A, Hansen C, Guo Z, Gaddam S, Tate KM, Pappalardo A, Li L, Chow GM, Roy KR, Nguyen TM, Tanabe K, McGrath PS, Cramer A, Bruckner A, Bilousova G, Roop D, Tang JY, Christiano A, Steinmetz LM, Wernig M, Oro AE. Neumayer G, et al. Nat Commun. 2024 Jul 11;15(1):5834. doi: 10.1038/s41467-024-49400-z. Nat Commun. 2024. PMID: 38992003 Free PMC article.

Abstract

Background: Gene editing in induced pluripotent stem (iPS) cells has been hailed to enable new cell therapies for various monogenetic diseases including dystrophic epidermolysis bullosa (DEB). However, manufacturing, efficacy and safety roadblocks have limited the development of genetically corrected, autologous iPS cell-based therapies.

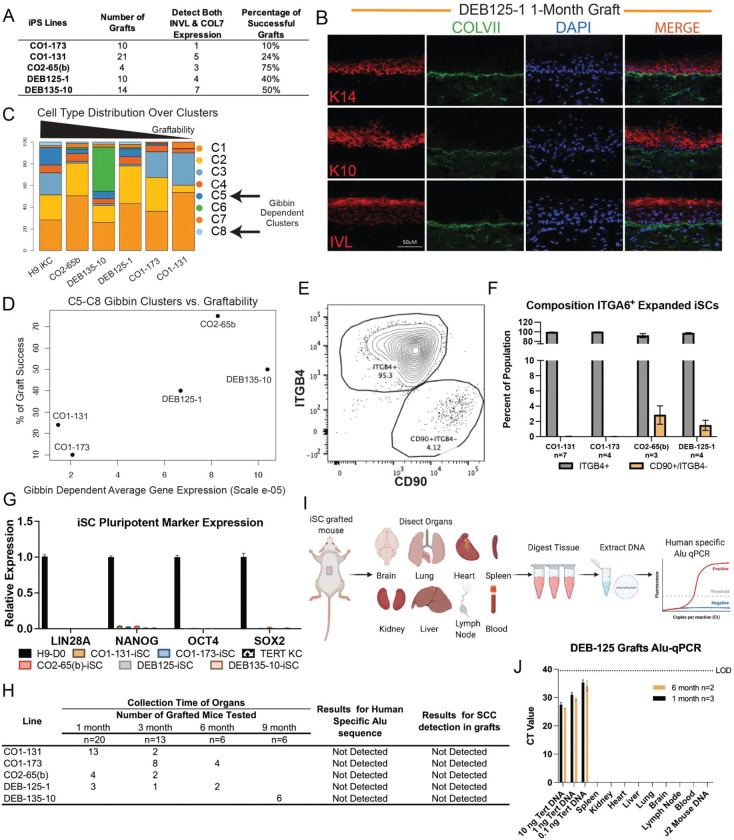
Methods: We developed Dystrophic Epidermolysis Bullosa Cell Therapy (DEBCT), a new generation GMP-compatible (cGMP), reproducible, and scalable platform to produce autologous clinical-grade iPS cell-derived organotypic induced skin composite (iSC) grafts to treat incurable wounds of patients lacking type VII collagen (C7). DEBCT uses a combined high-efficiency reprogramming and CRISPR-based genetic correction single step to generate genome scar-free, COL7A1 corrected clonal iPS cells from primary patient fibroblasts. Validated iPS cells are converted into epidermal, dermal and melanocyte progenitors with a novel 2D organoid differentiation protocol, followed by CD49f enrichment and expansion to minimize maturation heterogeneity. iSC product characterization by single cell transcriptomics was followed by mouse xenografting for disease correcting activity at 1 month and toxicology analysis at 1-6 months. Culture-acquired mutations, potential CRISPR-off targets, and cancer-driver variants were evaluated by targeted and whole genome sequencing.

Findings: iPS cell-derived iSC grafts were reproducibly generated from four recessive DEB patients with different pathogenic mutations. Organotypic iSC grafts onto immune-compromised mice developed into stable stratified skin with functional C7 restoration. Single cell transcriptomic characterization of iSCs revealed prominent holoclone stem cell signatures in keratinocytes and the recently described Gibbin-dependent signature in dermal fibroblasts. The latter correlated with enhanced graftability. Multiple orthogonal sequencing and subsequent computational approaches identified random and non-oncogenic mutations introduced by the manufacturing process. Toxicology revealed no detectable tumors after 3-6 months in DEBCT-treated mice.

Interpretation: DEBCT successfully overcomes previous roadblocks and represents a robust, scalable, and safe cGMP manufacturing platform for production of a CRISPR-corrected autologous organotypic skin graft to heal DEB patient wounds.

Keywords: CRISPR-CAS9; Epidermolysis Bullosa; Induced Pluripotent Stem Cells (iPS cells); dermal fibroblasts; epithelium; gene editing; good manufacturing practices compatibility (c-GMP); keratinocyte; skin; tissue engineering; wound healing.


Conflict of interest statement

DECLARATION OF INTERESTS The authors declare no competing or conflicting interests.

Figures

Figure 1:
Figure 1:. Optimized editing of the COL7A1 Colorado mutation (7485+5 G>A).
(A) Overview of single editing&reprogramming manufacturing step. (B) Overview of the Colorado mutation (red) and (+) or (−) strand ssODNs used for gene-editing. 6 possible PAM sites (C1–6) can be engaged via sgRNAs to mediate cutting of pathogenic alleles via CRISPR/CAS9. ssODNs encode for 4 silent mutations (blue) and the wild type sequence (green). (C) Absolute CRISPR/CAS9 cutting efficiencies of the homozygous Colorado mt in CO2 patient fibroblasts as mediated by sgRNA C1-C6 (n=2; stdev). (D) Relative CRISPR/CAS9 cutting efficiencies of the homozygous (CO2), heterozygous (DEB125) Colorado mt or the wild type locus as mediated by sgRNA C2 or C4 in indicated patient fibroblasts (n=2; stdev). (E) COL7A1 editing efficiencies measured by ddPCR in CO2 primary patient fibroblasts after transfection with ssODNs and sgRNA/CAS9-containing RNPs as indicated. A bi-allelic locus (green) is used as a reference for calculating COL7A1 editing (blue) efficiencies. Both, strandedness of the ssODN and sgRNA affect editing efficiencies. Ctrls omitted sgRNAs. (F) Agarose gels visualizing 77 E. coli colony-PCRs to detect edited Topo-cloned COL7A1 alleles from cells treated as in (E) with ssODN/sgRNA combinations as indicated (see Fig. S1 for remaining ssODN/sgRNA combinations). A primer specific for intended silent mutations (see Fig. 1B) only yields PCR products of alleles with integration of donor sequences (asterisks). (G) Summary of COL7A1 editing efficiencies achieved with different ssODN/sgRNA combinations as measured by ddPCR (Fig. 1E) and as observed by Topo-cloning of individual alleles (Fig. 1F). Mono-allelic integrations of ssODN sequences were assumed for calculations (see discussion). (H) Sanger sequence traces of unedited and edited alleles from (Fig. 1F, S1H). Asterisks indicate integration of intended silent mutations (blue) and repair of the pathogenic mutation (green).
Figure 2:
Figure 2:. Successful single manufacturing step editing/reprogramming of patients CO1, CO2 & DEB125.
(A) COL7A1 editing efficiencies as measured by ddPCR in CO1 and CO2 primary patient fibroblasts (homozygous Colorado mt) after transfection with (+)ssODN and RNPs containing sgRNA C4 and high fidelity CAS9 HiFi or SpyFi as indicated. A bi-allelic locus (green) is used as a reference for calculating COL7A1 editing (blue) efficiencies, assuming mono-allelic editing events. Ctrls omitted sgRNAs. (B) Reproducible COL7A1 editing in CO2 primary patient fibroblasts as in (Fig. 2A) with SpyFi CAS9 (error bars are sem). (C) Representative ddPCR screen of 64 single-step edited/reprogrammed iPS cell lines derived from patient CO1 fibroblasts. Ratios of signals detecting edited COL7A1 alleles (blue) and a bi-allelic reference locus (green) are used to identify mono- (0.5 +/−0.19) or bi-allelic (1.0 +/−0.19) editing events (black values; red values below/above cut off indicate potentially mixed or incorrectly edited clones). (D-E) Agarose gel visualizing PCR amplicons of a 731bp (D) and 2418bp (E) sequence surrounding the edited COL7A1 locus from single-step edited/reprogrammed iPS cell lines derived from 3 patients heterozygous (DEB125) and homozygous (CO1 and CO2) for the Colorado mt. Note that some samples yield 2 PCR products, indicative of large InDels on one of the COL7A1 alleles. InDels can be substantial (e.g. line CO2–65(B)), so that they are only included on bigger PCR products (E). See text for details. (F) Sanger sequencing of the smaller PCR product from line CO2–65(B) from (Fig. 2E) reveals a large 654bp deletion when aligned with the wt COL7A1 sequence. This deletion is not detected by smaller PCR amplicons in (Fig. 2D). (G) Summary of single-step editing/reprogramming screens conducted with sgRNA C4 and (+)ssODN from 3 patients as indicated (top). Topo-cloning and sanger sequencing of PCR products from (Fig. 2D–F) confirms correct COL7A1 editing on target alleles in 15 of 17 single-step edited/reprogrammed iPS cell lines. (H) Immuno-fluorescence microscopy images of single-step edited/reprogrammed iPS cells and parental fibroblasts stained for pluripotency markers TRA-1–81 and NANOG from 3 patients. DAPI visualized DNA. (I) Summary of flow cytometry analysis of single-step edited/reprogrammed iPS cells from 3 patients for CD90 and the pluripotency marker TRA-1-60 (see Fig. S3D for details).
Figure 3:
Figure 3:. Generation of organotypic skin grafts at clinical scale
(A) Differentiation strategy and cell enrichment with AutoMACS pro-separator for iPS cell clone comparison following a defined GMP compatible protocol to manufacture induced skin composite (iSC) grafts. (B) UMAP cluster representation of scRNA sequencing of H9 ES cell differentiation at Day 7 reveals the three lineage clusters: ectoderm (orange), mesoderm (blue) and neuroectoderm (green). (C) Violin plots depicting RPKM relative expression of representative ectoderm, mesoderm and neuroectoderm genes. (D) Immuno-fluorescence (IF) of iPS cell line DEB135-10-derived iSCs, stained for p63, K18 and K14 at day 45 of differentiation as in (Fig. 3A). (E) ITGA6 expression as per RNA-seq in H9 ES cells during iSC differentiation. Time points are indicated (D: day). NHKs were used as a positive control. (F) IF staining of AutoMACS-ITGA6 enriched, expanded iSCs. p63 (Cyan), K18 (red), and K14 (yellow). (G) Flow cytometry of day 45 unsorted H9 ES cells. Cells highly double positive for ITGA6 PE (y-axis) and K14 FITC (x-axis) are in high gate (red) and lower ITGA6/K14 expressing cells are in low gate (blue) to evaluate expression of K18 (PER-CP) in the subpopulations (right). (H) (Top left) Bright field image of FACS sorted ITGA6HI H9 ES cell-derived iSCs expanded to day 50 and used for organotypic stratification (Top right). IF shows normal polarization and stratification of the epidermis from the ITGA6HI H9 ES cell-derived iSCs (Collagen 7 (green), Involucrin (red), DAPI (blue)); (Bottom left) bright field image of unsorted H9 ES cell derived iSCs used for organotypic stratification (Bottom right). IF of corresponding unsorted H9 cells revealed disorganized layering and stratification. (I) Flow cytometry analysis of %ITGA6 positivity measured before and after AutoMACS enrichment for 5 differentiated iPS cell patient lines (independent differentiation runs for each clone n=4–10). (J) % Coupling efficiency (CE) determined by the equation %CE= live sorted iSCs/iPS cell input*100. (K) UMAP showing overlay of scRNAseq datasets from (Fig. 3L) with color scheme as indicated. 4 ectoderm (C1, C2, C4, C7), 3 mesoderm (C3, C8, C5) and 1 melanocyte / neuroectoderm-derived (C6) clusters were identified. (L) UMAP of scRNA sequencing of 5 individual patient iSCs and H9 ES cell derived iSC after ITGA6 enrichment and expansion for 2 passages in vitro, revealing 8 clusters (C) comprising the DEBCT product. Gibbin dependent clusters are outlined in dotted lines (see text for details), and arrows show lack of these clusters in products derived from iPS cell lines C01-131/173.
Figure 4:
Figure 4:. Genomic and chromosomal stability of single manufacturing step edited/reprogrammed iPS cells and iSCs.
(A) Normal karyotypes were observed in 11 of 12 single-step edited/reprogrammed iPS cell lines from 5 patients (CO1, CO2, DEB125, DEB134, and DEB135). (B) K-means clustering of all novel variants (n=111741) found by 40x whole genome sequencing (WGS) in fibroblasts and thereof derived iPS cells and iSCs from patient DEB125 (see Fig. S7 for other patients). Only a small sub-set of variants (red frame) is found to have differential allele frequencies (AFs) in iPS cells/iSCs compared to parental fibroblasts. (C) A defined cut-off (AF=0.25), combined with odds ratio filtering (see material and methods) identifies variants from 40x WGS (red: SNPs; green: InDels) specifically found in cell types from patient lines as indicated. Grouping of variants present in cell lines derived from 3 patients in Venn diagrams indicates absence of positive selection for any mutations. The majority of identified cell type specific variants is found in intergenic or intronic sequences (pie charts). No gene ontology (GO) term enrichment was found in identified variants. (D) Aligning all shared iPS cell/iSC-specific variants identified by k-means clustering (Fig. 4B, S7B) and AF-cut-off filtering (Fig. 4C) with the used seed sequence of sgRNA C4 within a 25bp search radius that must contain a NRG PAM-motif does not identify any significant homologies. The outlier (circles) with the most similarity to sgRNA C4 still exhibits 6 mismatches (see text for details). (E) TIDE analysis of sgRNA C4-mediated CAS9-cutting in CO2 patient fibroblasts at the COL7A1 on-target (top) and the most likely in silico predicted off-target, i.e. NOTCH1 (bottom). Measurements were taken 100bp-50bp upstream (i.e. internal Ctrl) and 10–60bp downstream of the predicted cut sites. (F) Plots of normalized WGS coverage 1000bp up-/downstream of the COL7A1 on-target (top) and the NOTCH1 off-target (bottom) from fibroblasts and thereof derived iPS cells as indicated. Note the sharp drop of coverage at the COL7A1 locus in iPS cells due to a heterozygous deletion of 654bp (see Fig. 2D–G). (G) Summary of (Fig. 4E–F) for all in silico predicted exonic and intronic off-targets and the COL7A1 on-target (left column). For TIDE analysis (middle column), noise-signals from internal controls were subtracted from values measured at cut sites (Fig. 4E). No InDels were found at any off-target in 4 clonal iPS cell lines from 3 patients (Fig. 4F). Heterozygous 1bp, 10bp (not shown) and 654bp big deletions were detected on COL7A1 on-target alleles of patients with homozygous mutations (i.e. CO1 and CO2). (H) Variants identified via the STAMPv2 oncopanel from fibroblasts and thereof derived iPS cells and iSCs as indicated. Germline variants (green) are found in all 3 cell types. A heterozygous mutation of the androgen receptor (red) stems from clonal expansion of a fibroblast sub-population (3%) already carrying this lesion. Blue indicates variants identified by secondary methods (see text and Fig. S7F–H) for details.
Figure 5:
Figure 5:. Patient iPS cell-derived orgonotypic skin grafts survive in mice with a favorable safety profile.
(A) Table of mouse graft success determined by IF staining of basement marker Collagen 7 (COL7) and granular marker involucrin (IVL) at 1 month. Graft attempts include at least two distinct manufacturing runs (B) Representative IF image of 1 month DEB-125-1 derived iSC graft. Keratin (K)14, K10, involucrin (red), Collagen 7 (ColVII; green), DNA (blue). (C) Quantification (%) of 8 different cell type clusters (C1–8) comprising the DEBCT product and identified via individual scRNA sequencing in. (D) Strong positive correlation between % graft success rate in (Fig. 5A) and average Gibbin-dependent gene expression as quantified by scRNA sequencing. (E) Representative flow cytometry of cell composition of H9 ES cell derived iSCs labeled for ITGB4 and the Gibbin-dependent fibroblast marker CD90/Thy1 before grafting on to mice. (F) Bar graph of flow cytometry quantifying the average expanded iSC cell composition prior to grafting. (G) qRT-PCR detection of pluripotent marker expression (LIN28A, NANOG, OCT4 and SOX2) in the iSC product. H9 ES cells and TERT keratinocytes (KC) were used as controls. (H) Table summarizing Alu-qPCR-based biodistribution and histology-based tumor detection results from mice at 1-, 3- and 6-month post iSC grafting. (I) Diagram of method for detecting evading iSCs into mouse organs using human Alu-qPCR. (J) Representative Alu-qPCR from organs of DEB-125-1 derived iSC grafted mice at indicated time points. LOD is level of detectability in tissues spiked with human DNA from TERT keratinocytes.

References

    1. Magrin E, Miccio A, Cavazzana M. Lentiviral and genome-editing strategies for the treatment of beta-hemoglobinopathies. Blood 2019;134(15):1203–1213. DOI: 10.1182/blood.2019000949. - DOI - PubMed
    1. Tucci F, Galimberti S, Naldini L, Valsecchi MG, Aiuti A. A systematic review and meta-analysis of gene therapy with hematopoietic stem and progenitor cells for monogenic disorders. Nat Commun 2022;13(1):1315. DOI: 10.1038/s41467-022-28762-2. - DOI - PMC - PubMed
    1. Lee A, Xu J, Wen Z, Jin P. Across Dimensions: Developing 2D and 3D Human iPSC-Based Models of Fragile X Syndrome. Cells 2022;11(11). DOI: 10.3390/cells11111725. - DOI - PMC - PubMed
    1. Thomas D, Choi S, Alamana C, Parker KK, Wu JC. Cellular and Engineered Organoids for Cardiovascular Models. Circ Res 2022;130(12):1780–1802. DOI: 10.1161/CIRCRESAHA.122.320305. - DOI - PMC - PubMed
    1. Trush O, Takasato M. Kidney organoid research: current status and applications. Curr Opin Genet Dev 2022;75:101944. DOI: 10.1016/j.gde.2022.101944. - DOI - PubMed

Publication types