

This is a preprint.
A live-cell platform to isolate phenotypically defined subpopulations for spatial multi-omic profiling
- PMID: 36909653
- PMCID: PMC10002729
- DOI: 10.1101/2023.02.28.530493
A live-cell platform to isolate phenotypically defined subpopulations for spatial multi-omic profiling
Update in
-
A live-cell platform to isolate phenotypically defined subpopulations for spatial multi-omic profiling.PLoS One. 2023 Oct 11;18(10):e0292554. doi: 10.1371/journal.pone.0292554. eCollection 2023. PLoS One. 2023. PMID: 37819930 Free PMC article.
Abstract
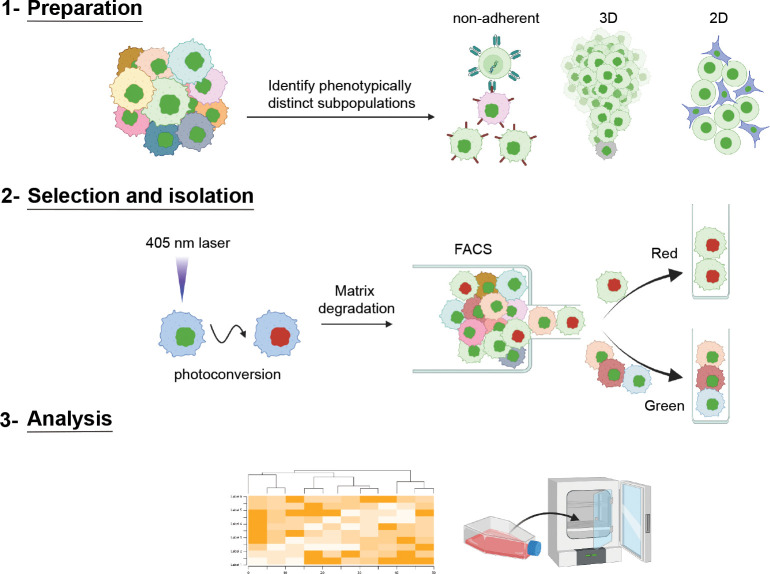
Numerous techniques have been employed to deconstruct the heterogeneity observed in normal and diseased cellular populations, including single cell RNA sequencing, in situ hybridization, and flow cytometry. While these approaches have revolutionized our understanding of heterogeneity, in isolation they cannot correlate phenotypic information within a physiologically relevant live-cell state, with molecular profiles. This inability to integrate a historical live-cell phenotype, such as invasiveness, cell:cell interactions, and changes in spatial positioning, with multi-omic data, creates a gap in understanding cellular heterogeneity. We sought to address this gap by employing lab technologies to design a detailed protocol, termed Spatiotemporal Genomics and Cellular Analysis (SaGA), for the precise imaging-based selection, isolation, and expansion of phenotypically distinct live-cells. We begin with cells stably expressing a photoconvertible fluorescent protein and employ live cell confocal microscopy to photoconvert a user-defined single cell or set of cells displaying a phenotype of interest. The total population is then extracted from its microenvironment, and the optically highlighted cells are isolated using fluorescence activated cell sorting. SaGA-isolated cells can then be subjected to multi-omics analysis or cellular propagation for in vitro or in vivo studies. This protocol can be applied to a variety of conditions, creating protocol flexibility for user-specific research interests. The SaGA technique can be accomplished in one workday by non-specialists and results in a phenotypically defined cellular subpopulation for integration with multi-omics techniques. We envision this approach providing multi-dimensional datasets exploring the relationship between live-cell phenotype and multi-omic heterogeneity within normal and diseased cellular populations.
Figures
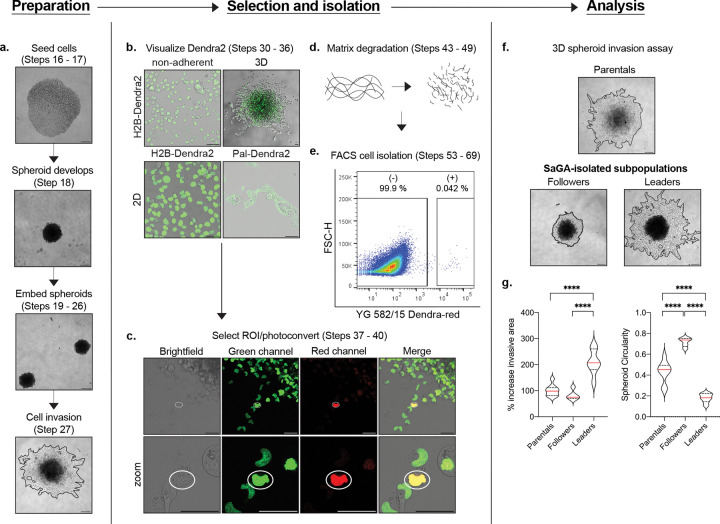
 ) for cell selection and photoconversion. Scale bar, 50 μm. d. Matrix degradation in 3D conditions utilizing collagenase/dispase cocktail. e. FACS plot showing non-photoconverted (−) and photoconverted (+) cells. f. 3D spheroid invasion assay with H1299 parental population and SaGA-isolated leader and follower subpopulations. Scale bar, 250 μm. g. Invasive area and spheroid circularity quantification. *p < 0.05 by one-way ANOVA with Tukey’s multiple comparisons test.
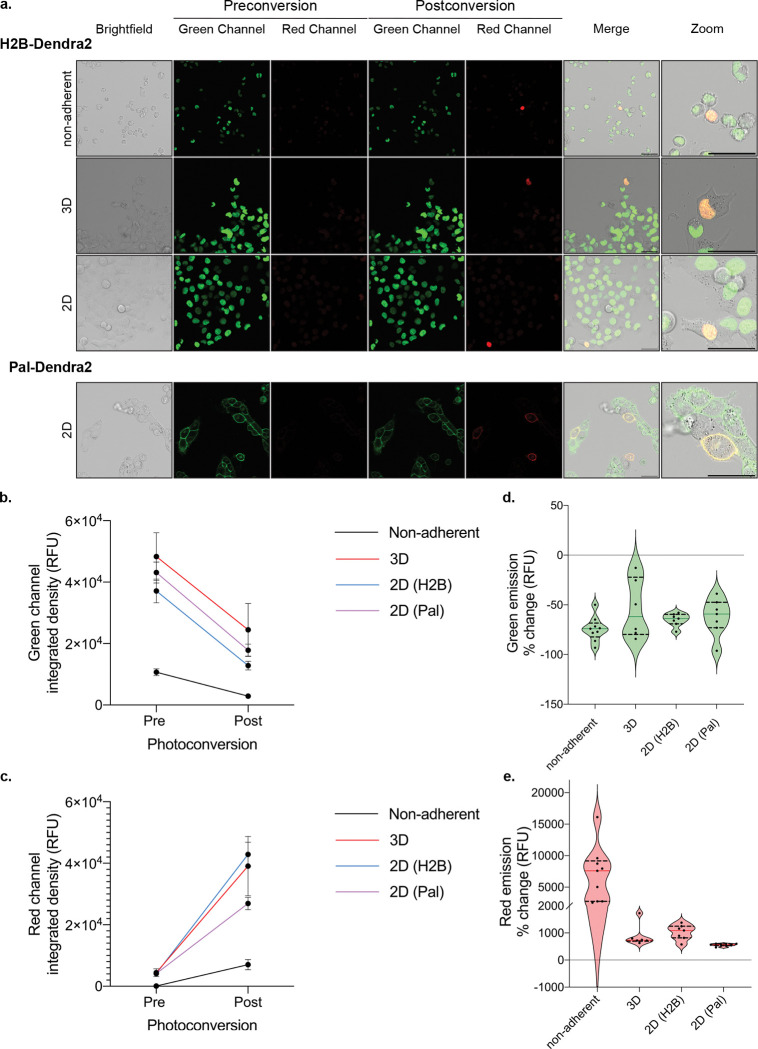
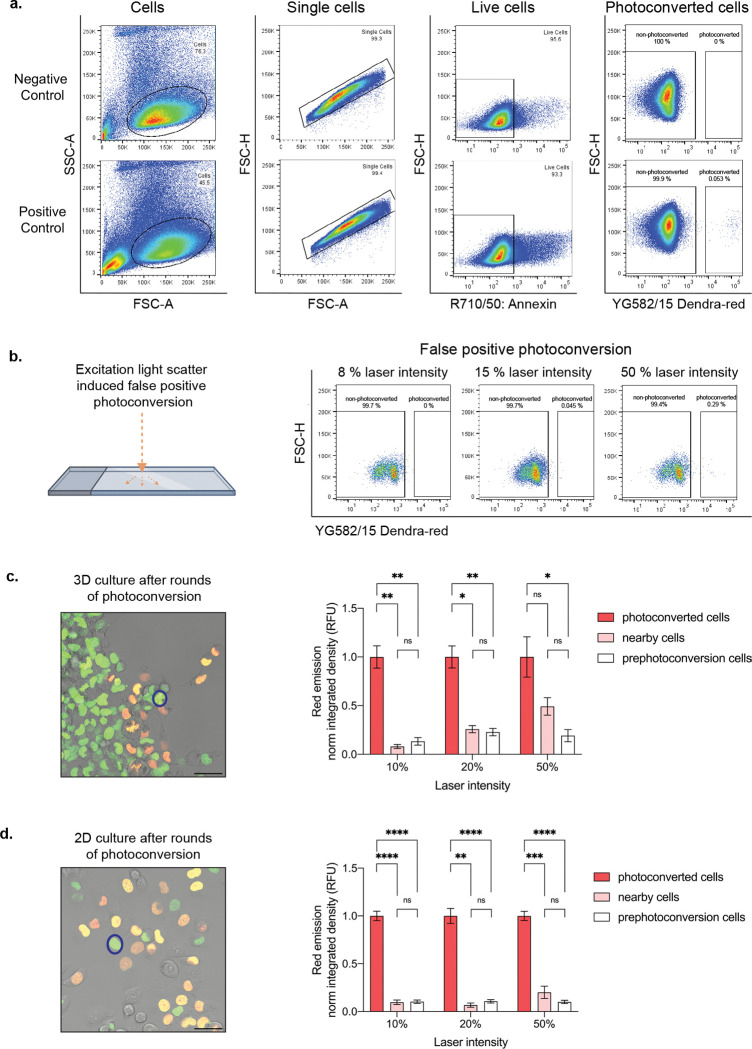
 ). Quantification showing fold change of normalized red emission after rounds of photoconversion are complete. d. Representative merged image showing photoconversion in multiple cells (orange and yellow cells) in 2D, where intensity change is measured in a neighboring, non-photoconverted cell (representative nearby cell,
  ). Quantification showing fold change of normalized red emission after rounds of photoconversion are complete. *p < 0.05 by one-way ANOVA with Tukey’s multiple comparisons test. Scale bar, 50 μm.
References
Publication types
Grants and funding
LinkOut - more resources
Full Text Sources
Miscellaneous