Review
. 2023 Jan 19;15(1):43-70.
doi: 10.1007/s12551-022-01041-6. eCollection 2023 Feb.

Second harmonic generation microscopy: a powerful tool for bio-imaging

Affiliations
Review

Second harmonic generation microscopy: a powerful tool for bio-imaging

Arash Aghigh et al. Biophys Rev. .

Abstract

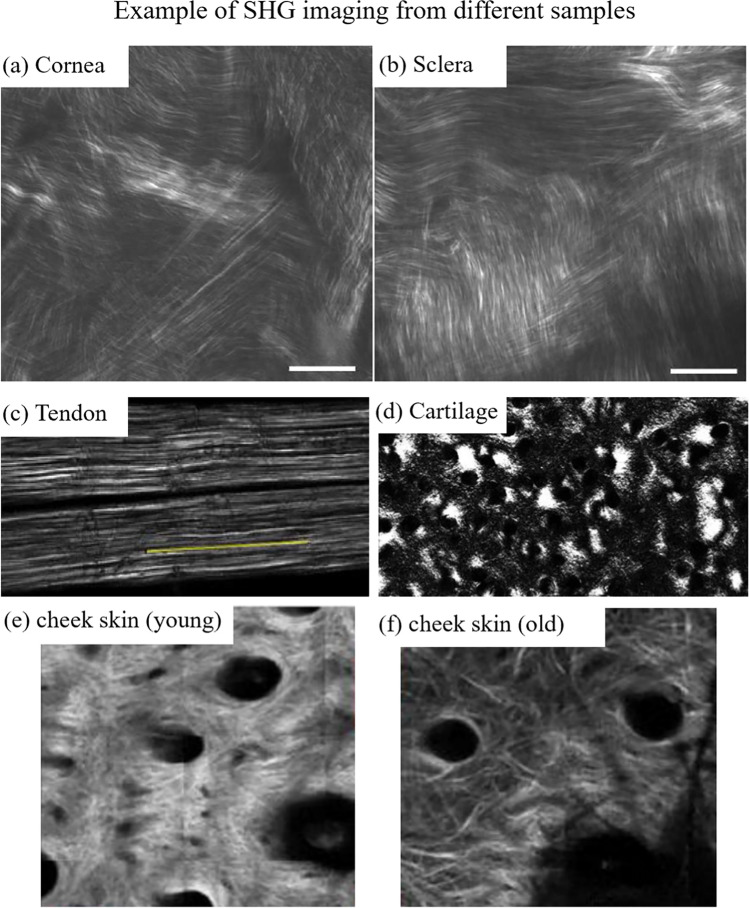
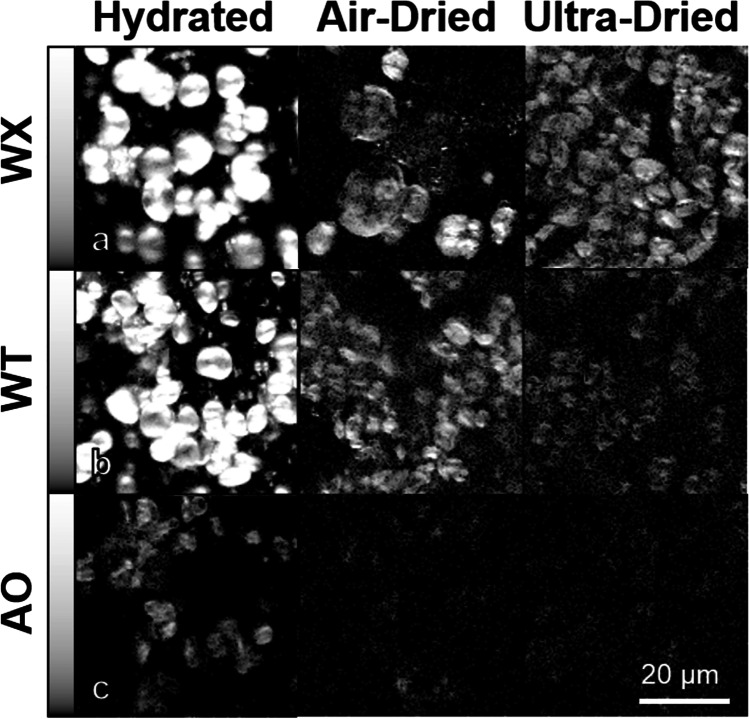
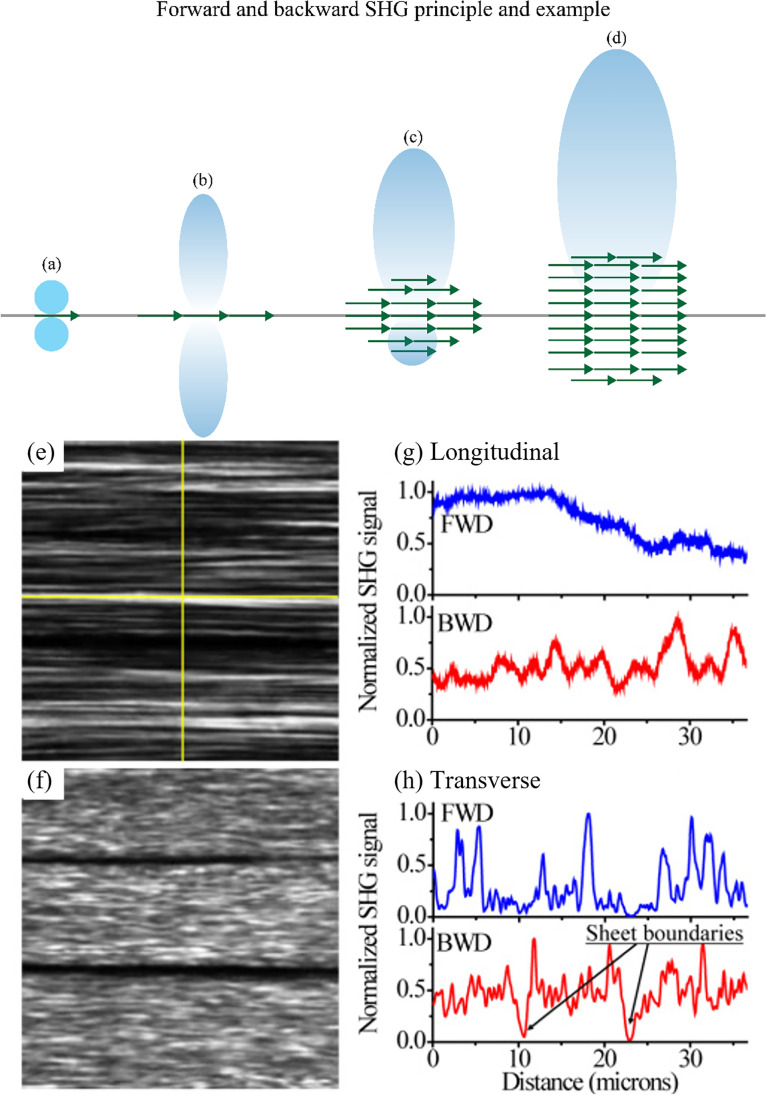
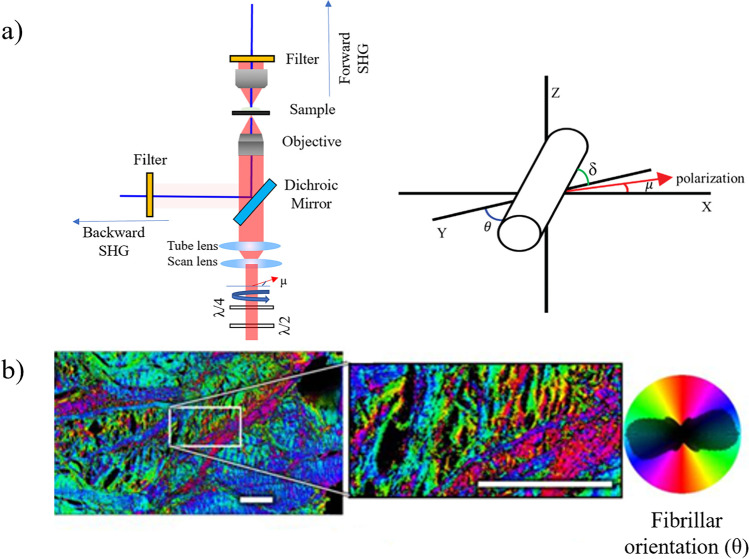
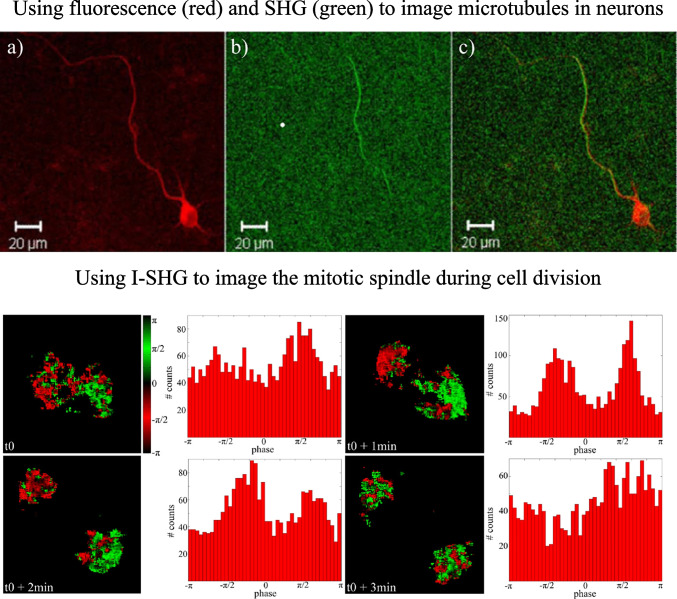
Second harmonic generation (SHG) microscopy is an important optical imaging technique in a variety of applications. This article describes the history and physical principles of SHG microscopy and its more advanced variants, as well as their strengths and weaknesses in biomedical applications. It also provides an overview of SHG and advanced SHG imaging in neuroscience and microtubule imaging and how these methods can aid in understanding microtubule formation, structuration, and involvement in neuronal function. Finally, we offer a perspective on the future of these methods and how technological advancements can help make SHG microscopy a more widely adopted imaging technique.

Keywords: Interferometry; Neuroimaging; Non-linear microscopy; Polarimetry; SHG.


Conflict of interest statement

Conflict of interestThe authors declare no competing interests.

Figures

Fig. 1
Fig. 1
Typical SHG microscopy setup, with source, power control unit, scanning system, objective lens, and detectors. Detectors are connected to a PC that controls the microscope and synchronizes laser scanning with signal acquisition using a detector which is typically a photo multiplier tube (PMT)
Fig. 2
Fig. 2
Top: energy level diagram of SHG. Two incident photons interact with the molecules (harmonophores) through virtual states, leading to the generation of a photon at 2ɷ, exactly twice the input frequency (ɷ). SHG is a parametric process, and no energy transfer occurs. Reproduced under CC BY 4.0 from Borile et al. (2021). Bottom: Absorption spectrum of the human skin, indicating 3 possible transparency windows. Adapted with permission from Hemmer et al. (2013)
Fig. 3
Fig. 3
Comparison of the SHG signal from a single dipole (upper row) to the SHG from two parallel (central row) and anti-parallel dipoles (bottom row). Adapted from Bancelin (2014)
Fig. 4
Fig. 4
Top: Hierarchical structure of collagen. modified under CC BY-SA 3.0 from Laboratoires Servier (2019). Bottom: Collagen organization in different biological entities (Morishige et al. ; Rivard et al. ; Mostaço-Guidolin et al. 2017)
Fig. 5
Fig. 5
Examples of SHG images for various biological samples. SHG images from (a) cornea and (b) sclera, the scale bar is 20 μm. Extracted from Han et al. (2005). (c) Tendon (500 × 150 µm), extracted with permission from Rivard et al. (2014). (d) Cartilage (350 × 200 µm), extracted with permission from Couture et al. (2015). SHG image of skin in young (e) vs. old age (f) (1.6 × 1.6 mm), extracted with permission from Ogura et al. (2019)
Fig. 6
Fig. 6
SHG imaging of three types of barley starch granules in different hydration states. a WX (waxy barley with only amylopectin) exhibits a very high SHG intensity even in ultra-dry conditions. b WT (wild-type barley with ~ 30% amylose content) SHG signal is dimmer than in panel a but still detectable. c AO (amylose only barley) has the lowest SHG signal intensity among the three, which is barely detectable in ultra-dried condition. Extracted from Cisek et al. (2015)
Fig. 7
Fig. 7
Radiation pattern for different dipole configurations in the focal volume. (a) A single dipole, indicated by the green arrow, creates equal F-SHG and B-SHG (F/B = 1). (b) Several dipoles in the same plane also create the same amount of SHG signal in the forward and backward direction (F/B = 1). (c) The coherent contribution of many induced dipoles packed in the optical direction will generate a strong forward SHG signal and a weak backward SHG signal (F/B > 1). (d) For a bulk material, only a strong forward SHG signal is present with a negligible amount of backward SHG. Adapted under CC BY-SA 4.0 from BP-Aegirsson. Forward (e) and backward (f) SHG images of fascia. Panels (g) and (h) respectively represent longitudinal and transverse intensity profiles (with respect to the fibrillar axis (horizontal axis)), as depicted by the yellow crosshair in (e), taken in forward (blue) and backward (red) direction. In the backward direction, the sheet boundaries are easier to spot than in the forward SHG image. Extracted from Rivard et al. (2010)
Fig. 8
Fig. 8
a) Schematic of a typical P-SHG microscope with sample in focus. A half-wave plate (λ/2) and a quarter-wave plate (λ/4) are used to control the pump polarization state. Adapted from Teulon et al. (2015). b) Collagen fibril orientation in adult horse specimens measured by P-SHG. In this study, the maturation of meniscal collagen was studied in young and adult horses using P-SHG. Extracted under CC BY 4.0 from Pinsard et al. (2019b)
Fig. 9
Fig. 9
Example of CD-SHG applied in the transverse imaging of a human cornea. (a) Schematics and SHG intensity image of the cornea. Panels (b) and (c) show the CD-SHG imaging of the same region of the sample in two different configurations. As it is evident, the CD-SHG sign in both configurations is the same for almost 80% of the imaged pixels. Lastly, in panel (d), the SHG intensity profile (in green) and the CD-SHG absolute value (in magenta) are plotted along the yellow arrow shown in panels (a) and (b). Modified from Schmeltz et al. (2020)
Fig. 10
Fig. 10
Example of a four-channel-Stokes polarimeter SHG microscopy setup. After the SHG from the sample, the signal passes through a polarization state generator consisting of a polarizer, a half-wave plate, and a quarter-wave plate before passing through a polarization state analyzer comprised of a beam splitter, a Fresnel rhomb, and two Wollaston prisms. It is detected simultaneously by a time-correlated single-photon-counting (TCSPC) system consisting of four detectors. Reproduced under CC BY 4.0 from Mazumder et al. (2012)
Fig. 11
Fig. 11
Stokes vector–based SHG microscopy of collagen fibers. Panel a) Represents the 2D Stokes vector images of the collagen fibers with vertical and horizontal input polarization. Panel b) shows the DOP, DOLP, DOCP, and anisotropy parameter of the collagen fibers. Modified under CC BY 4.0 from Mazumder and Kao (2021)
Fig. 12
Fig. 12
DMSP SHG images of the wall muscle of Drosophila melanogaster larva. a) Measured Stokes matrix elements. b) Maps of DOP, DOLP, and DOCP. c) Double Mueller matrix elements normalized to the value obtained for χZXX(2) from imaging. The scale bar is 10 µm. Modified from Kontenis et al. (2016)
Fig. 13
Fig. 13
I-SHG principle. (a) Example of an I-SHG inverted microscope. The λ/2 (half-wave plate) and polarizer are used for power control and afterwards the non-linear crystal plate generates the reference SHG signal. After that, a delay compensator is used to match the optical length of the pump arm and the reference SHG arm superposed along a common path in the interferometer. The polarizations are made parallel after the phase shifter and introduced to the microscope setup for interference between the reference SHG and the sample SHG. (b, c, d, e) Schematic diagram of the algorithm for calculating the relative I-SHG phase. The 2 N raw images (b) are subtracted 2 by 2 to give N contrast images (c). In every pixel, the intensity follows a cosine law with respect to the phase shift of the interferogram (d), which can be interpolated to find the optical phase and interferometric contrast image (e). Extracted from Pinsard (2020)
Fig. 14
Fig. 14
I-SHG imaging in muscle sarcomere adapted from Rivard et al. (2013a). a) F-SHG image in the absence of a reference SHG beam. b), c), d) raw I-SHG images acquired with a reference phase of 105°, 285°, and 465° respectively. Panels e) and f) images resulting from the subtractions of (c)—(b) and (d)—(c). Panel g) depicts the relative SHG phase in the muscle and (h) the histogram of the relative SHG phase for all pixels in (g)
Fig. 15
Fig. 15
Standard a) and fast b) methods for phase shift in I-SHG. Extracted from Pinsard (2020)
Fig. 16
Fig. 16
SHG phase-map of an adult horse meniscus with fast I-SHG and normal I-SHG. The scale bar is 50 µm. Panels (a), (b), (c) show fast I-SHG with different phase scan durations and panel (d) shows the normal I-SHG at work. (a) 20 μs phase scan is acquired in ~ 0.5 min, (b) 200 μs phase scan is acquired ~ 2 min, (c) 2000 μs phase scan is acquired in ~ 8 min, and (d) using the normal I-SHG method, acquisition takes ~ 32 min. Note that reducing the phase scan duration increases the speed of acquisition, but it also increases the phase errors. Nevertheless, even the longest phase scan duration of fast I-SHG (i.e., 2000 μs) cuts the acquisition time by 25% compared to normal I-SHG which is a huge improvement overall. Adapted from Pinsard et al. (2019a)
Fig. 17
Fig. 17
Typical wide-field SHG microscopy setup. The laser light source is in the range of 700–1100 nm. A half-wave plate and a polarizer are used for power control. An achromat doublet lens (AD) is used to focus the incoming laser beam and the sample is placed slightly above the focus to capture a larger FOV. The SHG signal is collected using an objective and a tube lens, spectrally filtered, and detected on a camera. Zhao et al. (2019) Adapted from
Fig. 18
Fig. 18
Wide-field SHG images of fixed larval muscle (a) 425 µm2 and (b) 213 µm.2 area with a frame integration time of 100 ms. Panels (c) and (d) represent the SHG intensity profiles of (a) and (b) respectively from the designated regions of interests in the images. This method provides single shot imaging of large areas and is used to acquire live larvae contractions. Extracted from Zhao et al. (2019)
Fig. 19
Fig. 19
(a) Anatomy of a neuron from soma to the synapse. Extracted from Neuron description (2019). (b) Neuron polarity diagram. Adapted with permission from Baas and Lin (2011)
Fig. 20
Fig. 20
Single neuron and neuron population using FM-4–64 dye and SHG imaging. Scale bars: 20 µm. Panel (a) shows a single pyramidal neuron from a mouse visual cortex that has been injected with the dye and imaged using SHG microscopy. Panel (b) shows a multitude of pyramidal neurons bathed and labeled by a SHG chromophore and imaged using SHG microscopy. Extracted with permission from Jiang and Yuste (2008)
Fig. 21
Fig. 21
Microtubule imaging in neuron (top) and mitotic spindle (bottom). Complementation of neuron imaging using fluorescence and SHG (top). In panel a), only TauRFP (tau red fluorescent protein) dye is visible in the image of the neuron. In panel b), we only see the SHG image of the neuron. Finally, c) is a combination of the fluorescence and the SHG images to benefit from both imaging techniques (Stoothoff et al. 2008). Image and histogram of SHG phase in the mitotic spindles (bottom). The red and green pixels are π-phase shifted signals. At the beginning of the metaphase (t0), the two poles are starting to have opposite polarities. At the end of the metaphase (t0 + 1 min) and the beginning of the anaphase (t0 + 2 min), a more uniform polarity can be seen where one pole is red and the other pole is green. At the end of the anaphase (t0 + 3 min), a mix of red and green pixels can be seen in both poles which means that the two poles have a random polarity. Reproduced under CC BY 4.0 from Bancelin et al. (2017)

References

    1. Akhmanova A, Hoogenraad CC. Microtubule plus-end-tracking proteins: mechanisms and functions. Curr Opin Cell Biol. 2005;17:47–54. doi: 10.1016/j.ceb.2004.11.001. - DOI - PubMed
    1. Alata M, Piazza V, Jaramillo-Restrepo C, et al. H-ABC tubulinopathy revealed by label-free second harmonic generation microscopy. Sci Rep. 2022;12:14417. doi: 10.1038/s41598-022-18370-x. - DOI - PMC - PubMed
    1. Alushin GM, Lander GC, Kellogg EH, et al. High-resolution microtubule structures reveal the structural transitions in αβ-tubulin upon GTP hydrolysis. Cell. 2014;157:1117–1129. doi: 10.1016/j.cell.2014.03.053. - DOI - PMC - PubMed
    1. Baas PW, Lin S. Hooks and comets: The story of microtubule polarity orientation in the neuron. Dev Neurobiol. 2011;71:403–418. doi: 10.1002/dneu.20818. - DOI - PMC - PubMed
    1. Baas PW, Deitch JS, Black MM, Banker GA. Polarity orientation of microtubules in hippocampal neurons: uniformity in the axon and nonuniformity in the dendrite. Proc Natl Acad Sci U S A. 1988;85:8335–8339. doi: 10.1073/pnas.85.21.8335. - DOI - PMC - PubMed

LinkOut - more resources