. 2023 Feb 22:10:1037217.
doi: 10.3389/fcvm.2023.1037217. eCollection 2023.

The protective role of EP300 in monocrotaline-induced pulmonary hypertension

Affiliations

The protective role of EP300 in monocrotaline-induced pulmonary hypertension

Lei Yang et al. Front Cardiovasc Med. .

Abstract

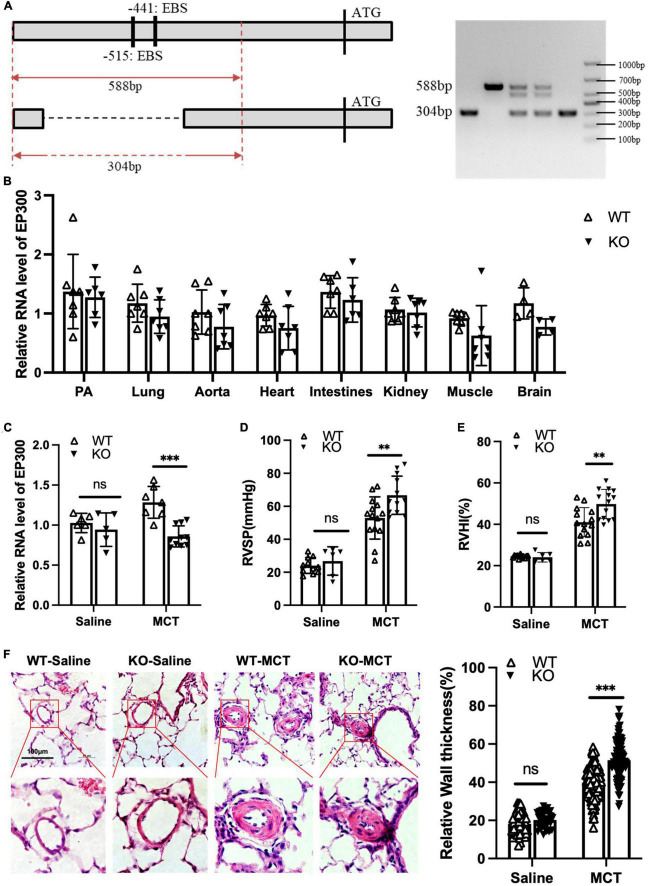
Background: Pulmonary hypertension (PH) is a lethal disease characterized by pulmonary vascular remodeling, which is mediated by the abnormal proliferation/migration of pulmonary arterial smooth muscle cells (PASMCs). Recent reports suggest the involvement of histone acetylation in PAH development and that histone deacetylase (HDAC) inhibitors have therapeutic potential for the treatment of PAH. EP300 is an acetyltransferase that plays diverse roles in cell proliferation, differentiation, and apoptosis. However, the functions of EP3000 in PH are rarely studied.

Results: In this work, we found that the expression of EP300 was increased in the pulmonary arteries of monocrotaline (MCT)-induced PH rats. Knockdown of EP300 by AAV-mediated shRNA exacerbated the PH, with a higher right ventricular systolic pressure (RVSP), right ventricular hypertrophy index (RVHI), and wall thickness in the pulmonary artery of MCT-induced PH rat. On the cellular level, the proliferation of PASMCs was promoted by EP300 knockdown. In addition, the expression of EP300 was increased in PASMCs by the overexpression of EGR1, while the deletion of EGR1 binding sites in the EP300 promoter region decreased the activity of EP300 promoter. Moreover, deleting the EP300 promoter region containing EGR1 binding sites using CRISPR/Cas9 abolished the upregulation of EP300 in MCT-induced rats and exacerbated MCT-induced PH. To summarize, our data indicate that EP300 upregulation mediated by EGR1 has a protective effect on MCT-induced PH.

Conclusion: These findings showed EP300 expression was increased in the MCT-induced PH model in rats, which could be mediated by EGR1; the EP300 also displayed the potential to provide protection from PH.

Keywords: EGR1; EP300; cell proliferation; pulmonary arterial smooth muscle cell; pulmonary hypertension.


Conflict of interest statement

The authors declare that the research was conducted in the absence of any commercial or financial relationships that could be construed as a potential conflict of interest.

Figures

FIGURE 1
FIGURE 1
EP300 expression is upregulated in pulmonary arteries of MCT-induced PH rat. Rats (8-wk old, male, WT, 6 rats per group) were injected with saline or monocrotaline (MCT, 50 mg/kg) for 3 weeks. (A) The right ventricular systolic pressure (RVSP). (B) The right cardiac hypertrophy index [RVHI, RV/(LV + S)]. (C) The expression level of EP300 in pulmonary arteries (PAs) from saline or MCT-treated rats was assessed by qRT-PCR and western blot, and β-actin was used as endogenous control. ***p < 0.001, compared between indicated groups, student’s t-test was used for all the experiments.
FIGURE 2
FIGURE 2
EP300 knockdown in PAs aggravates MCT-induced PH. (A) The diagram of establishing MCT-induced PH rats or control rats treated with different of AAV9-shRNA. One week before injecting saline or MCT, AAV-shCon or AAV-shEP300 was intratracheally delivered to the rats (7-wk old, male, 6 rats per group). (B) The mRNA expression level of EP300 in the pulmonary arteries from rats (treated with saline or MCT) infected with the AAV virus, assessed by qRT-PCR, and β-actin was used as endogenous control. (C) RVSP of the rats in each group. (D) RVHI of the rats in each group. (E) Left panel: representative pulmonary artery images (H&E staining) in the lung sections of experimental rats (scale bars: 100 μm); right panel: quantification of the relative wall thickness of pulmonary artery in each group [PAs wall thickness = (total perimeter–lumen perimeter)/total perimeter]. *p < 0.05, **p < 0.01, ***p < 0.001, compared between indicated groups, student’s t-test was used for all the experiments.
FIGURE 3
FIGURE 3
EP300 knockdown promotes the proliferation and inhibits the apoptosis in PASMCs. (A) The evaluation of EP300 siRNAs (siEP300-1 and siEP300-2) knockdown efficiency in rat PASMCs (RPASMCs) on the transcriptional level. The RPASMCs were transfected with siRNAs against EP300 (siEP300) or scramble negative control (siCon), and qRT-PCR was performed 48 h later to analyze the expression level of EP300. The β-actin was used as endogenous control. The siEP300-1 and siEP300-2 were different sequences targeting EP300. (B) The effect of EP300 knockdown on RPASMCs proliferation. Left panel: EdU assay of RPASMCs transfected with siCon or siEP300 for 48 h. The cells were incubated with EdU solution for 4 h, followed by formalin fixation and staining with Apollo dye (red) and DAPI (blue). Right panel: bar graph of relative EdU incorporation rate in each group. (C) The effect of EP300 knockdown on RPASMCs apoptosis. Left panel: flow cytometric analysis of apoptosis; right panel: bar graph of relative apoptosis rate in each group. (D) The silencing efficiency of EP300 in human PASMCs (HPASMCs). The cells were transfected with siEP300 or siCon for 48 h, and qRT-PCR was performed to analyze the expression level of EP300. The β-actin was used as endogenous control. (E) The effect of EP300 knockdown on HPASMCs proliferation. Left panel: EdU assay of HPASMCs transfected with siCon or siEP300 for 48 h (performed as described above); right panel: bar graph of relative EdU incorporation rate in each group. N = 3, bar graphs are mean ± SD. *Represents the significance between the two groups of siCon and siEP300. **p < 0.01, ***p < 0.001, compared between siEP300 and siCon, student’s t-test was used for all the experiments.
FIGURE 4
FIGURE 4
EP300 is regulated by EGR1. (A) The relative expression of EGR1 and EP300 in PAs of rats treated with Saline or MCT by qRT-PCR. The β-actin was used as endogenous control. (B) The relative expression levels of EGR1 and EP300 determined by qRT-PCR in RPASMCs transfected with siRNA against EGR1 (siEGR1) or scramble control (siCon) for 48 h. The β-actin was used as endogenous control. (C) The protein level of EGR1 and p300 in RPASMCs infected with lentivirus overexpressing EGR1 or control without insert for 96 h. Left panel: western blotting picture; right panel: bar graph of relative protein level. The β-tubulin was used as endogenous control. (D) Chip-PCR was performed to analyze the binding relationship between EGR1 and EP300 promoter. (E) Construction of luciferase reporter vectors containing WT human EP300 promoter (pGL3-EP300) or EP300 promoter lacking two EBS (pGL3-NBS). (F) The luciferase assays of pGL3-EP300 or pGL3-NBS vector in transfected 293A cells. EP300 promoter activity was measured by dual luciferase assay. (G) The dual luciferase assays of pGL3-EP300 or pGL3-NBS vector co-transfected with the EGR1 overexpression vector (or control vector) 48 h after transfection. N = 3, bar graphs are mean ± SD. *Represents the significance between the two groups of siCon and siEP300. **p < 0.01, ***p < 0.001, compared between indicated groups, student’s t-test was used for all the experiments.
FIGURE 5
FIGURE 5
Loss of EBS in EP300 promoter aggravates MCT-induced PH. (A) The sketch map of deletion of two EBS in the EP300 promoter region by CRISPR/Cas9 system. Specific primers were designed to confirm the genotype. (B) The expression level of EP300 in different tissues of EBS-KO or WT rats analyzed by qRT-PCR and β-actin was used as endogenous control (6 rats per group). (C) The expression level of EP300 in pulmonary arteries from EBS-KO or WT rats (treated with saline or MCT) assessed by qRT-PCR and β-actin was used as endogenous control. (D) RVSP of EBS-KO or WT rats. (E) RVHI EBS-KO or WT rats. (F) Left panel: representative pulmonary artery images (H&E staining) in the lung sections of experimental rats (scale bars: 100 μm); right panel: quantification of the relative wall thickness of pulmonary artery of rats in each group. **p < 0.01, ***p < 0.001 compared between indicated groups, and “ns” indicates non-significant. Student’s t-test was used for all the experiments.

References

    1. Condon DF, Nickel NP, Anderson R, Mirza S, de Jesus Perez VA. The 6th world symposium on pulmonary hypertension: what’s old is new. F1000Res. (2019) 8:F1000FacultyRev–888. 10.12688/f1000research.18811.1 - DOI - PMC - PubMed
    1. Tuder RM. Pulmonary vascular remodeling in pulmonary hypertension. Cell Tissue Res. (2017) 367:643–9. - PMC - PubMed
    1. Chelladurai P, Boucherat O, Stenmark K, Kracht M, Seeger W, Bauer UM, et al. Targeting histone acetylation in pulmonary hypertension and right ventricular hypertrophy. Br J Pharmacol. (2019) 178:54–71. - PubMed
    1. Xiao Y, Chen PP, Zhou RL, Zhang Y, Tian Z, Zhang SY. Pathological mechanisms and potential therapeutic targets of pulmonary arterial hypertension: a review. Aging Dis. (2020) 11:1623–39. - PMC - PubMed
    1. Eberharter A, Becker PB. Histone acetylation: a switch between repressive and permissive chromatin. Second in review series on chromatin dynamics. EMBO Rep. (2002) 3:224–9. 10.1093/embo-reports/kvf053 - DOI - PMC - PubMed