. 2022 Jul;2(7):635-643.
doi: 10.1038/s43587-022-00243-7. Epub 2022 Jul 18.

Longitudinal phenotypic aging metrics in the Baltimore Longitudinal Study of Aging

Affiliations

Longitudinal phenotypic aging metrics in the Baltimore Longitudinal Study of Aging

Pei-Lun Kuo et al. Nat Aging. 2022 Jul.

Abstract

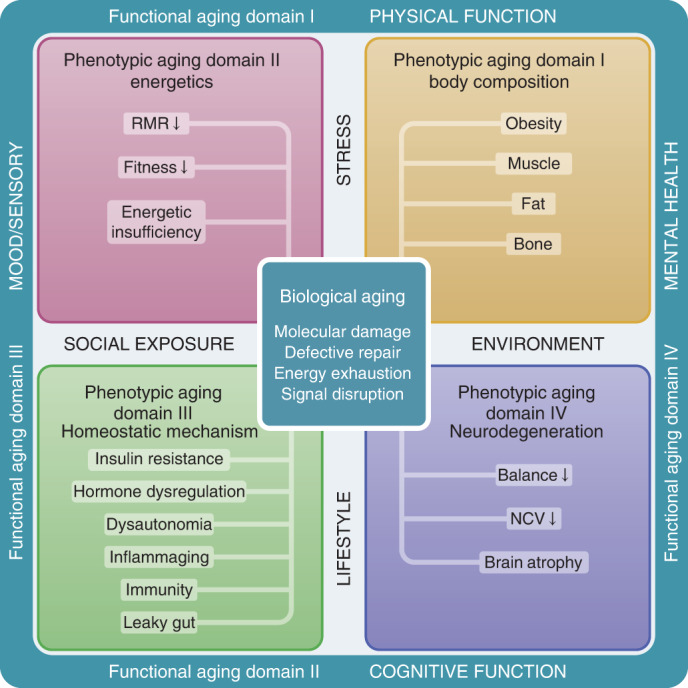
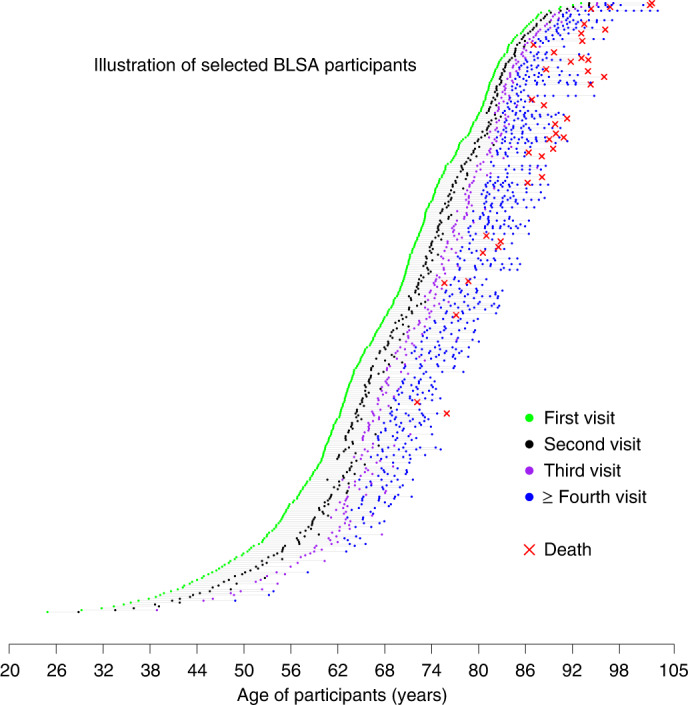
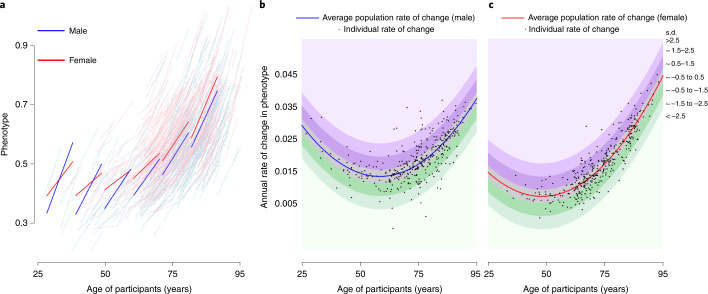
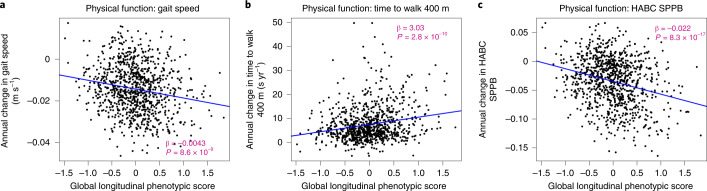
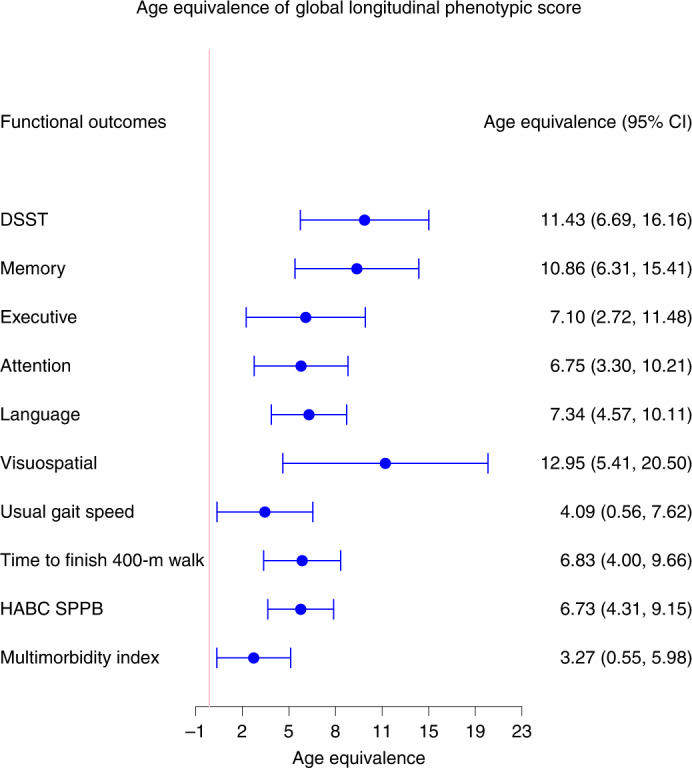
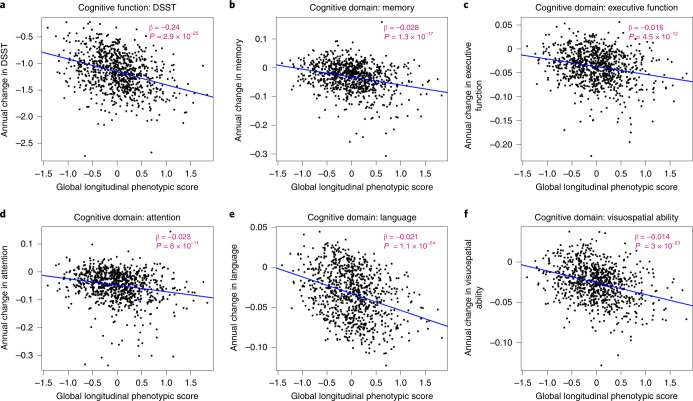
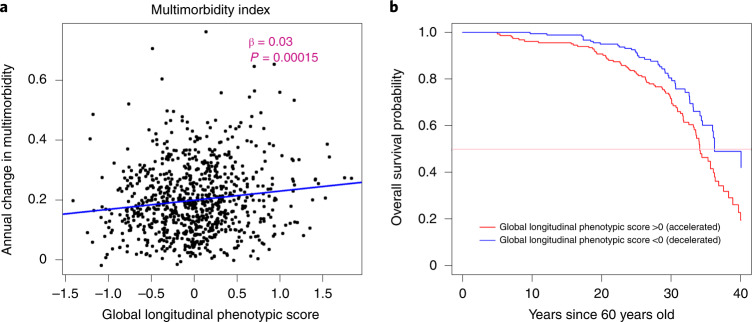
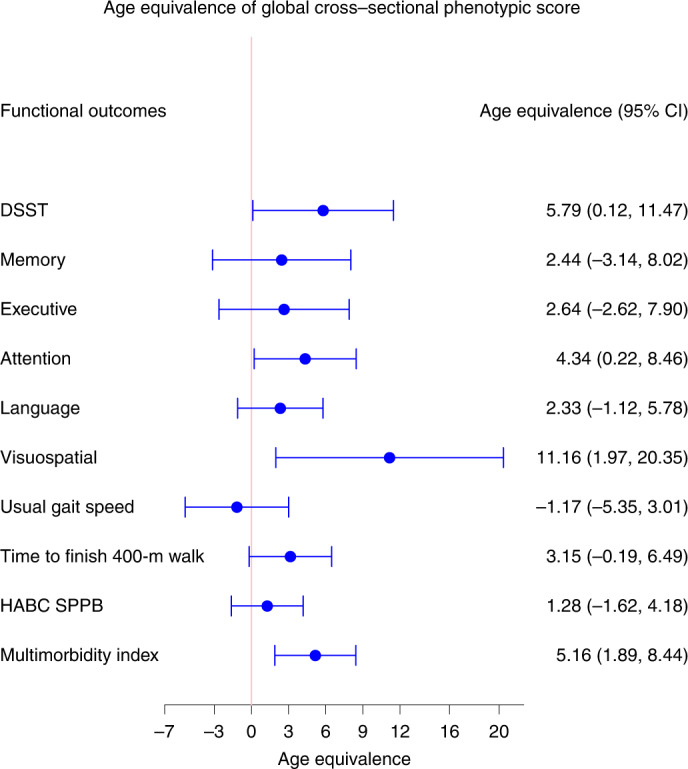
To define metrics of phenotypic aging, it is essential to identify biological and environmental factors that influence the pace of aging. Previous attempts to develop aging metrics were hampered by cross-sectional designs and/or focused on younger populations. In the Baltimore Longitudinal Study of Aging (BLSA), we collected longitudinally across the adult age range a comprehensive list of phenotypes within four domains (body composition, energetics, homeostatic mechanisms and neurodegeneration/neuroplasticity) and functional outcomes. We integrated individual deviations from population trajectories into a global longitudinal phenotypic metric of aging and demonstrate that accelerated longitudinal phenotypic aging is associated with faster physical and cognitive decline, faster accumulation of multimorbidity and shorter survival. These associations are more robust compared with the use of phenotypic and epigenetic measurements at a single time point. Estimation of these metrics required repeated measures of multiple phenotypes over time but may uniquely facilitate the identification of mechanisms driving phenotypic aging and subsequent age-related functional decline.


Conflict of interest statement

Competing interests M.E.L. holds licenses for epigenetic clocks that she has developed. All other authors declare no conflict of interest.

Figures

Fig. 1
Fig. 1. Conceptual framework underpinning the study design.
Conceptual framework of three hierarchical and temporal metrics of aging—biological, phenotypic and functional. We hypothesize that biological mechanisms (center square) drive changes in aging phenotypes, which eventually lead to deterioration at functional levels (outer rim). Four phenotypic domains are proposed for measurement of aging phenotypes—body composition, energetics, homeostatic mechanisms and neuroplasticity/neurodegeneration. Examples of aging phenotypes are listed in the colored boxes. RMR, resting metabolic rate; NCV, nerve conduction velocity.
Fig. 2
Fig. 2. The BLSA analytic cohort.
Random sample of the BLSA cohort used for our analyses. Participants had a wide age range at the time of enrollment, and follow-up duration. Scheduled follow-up intervals were age dependent, ranging from 4 years for those <60 years, 2 years for those aged 60–79 years to 1 year for those aged ≥80 years.
Fig. 3
Fig. 3. Relationship between average rate of change in the population of a specific phenotype and rate of change of the same phenotype in individual BLSA participants.
ac, The example reported in this figure uses the cost/capacity ratio, one of the phenotypes in the energetics domain, operationalized as the ratio between the energy cost of slow walking (ml kg–1 min–1) and energy capacity measured by peak oxygen consumption during a 400-m walk (ml kg–1 min–1) (detailed description in Supplementary Methods I). Number of participants, 755 (male 378, female 377). a, Spaghetti plot of longitudinal changes in cost-to-capacity ratio in men and women at the population level (thick blue and red lines, respectively) and for individual participants (thin lines), estimated from mixed-effect models (Methods and Supplementary Methods III). b,c, Estimated rates of change in cost/capacity ratio are depicted for individual participants (black dots; b, males; c, females) at their age of study entry. Bands of different color indicate how far the individual rates of change diverge from the population rate of change, expressed as s.d. Of note, because the rate of reference varies at different ages, a specific rate of change conveys information on accelerated or decelerated aging only when the specific age of the participant is considered.
Fig. 4
Fig. 4. Relationship between global longitudinal phenotypic score and change in physical functions for three mobility tests.
ac, Higher global longitudinal phenotypic scores indicate accelerated phenotypic aging trajectories. Higher annual decrease in gait speed (a) and HABC SPPB scores (c), along with higher annual increase in the time to walk 400 m (b), indicate faster decline of physical function. Two-sided tests were used, and the displayed P values were not adjusted for multiple comparisons. Participants with at least two visits, n = 951; usual gait speed, n = 904; time to finish 400-m walk, n = 950 (HABC SPPB); also see Supplementary Table 1b for more details. Source data
Fig. 5
Fig. 5. Age equivalence of a one-point difference in global longitudinal phenotypic score for different functional outcomes.
Estimated age equivalence of a one-point difference in global longitudinal phenotypic score for different functional outcomes, including cognitive function, physical function and multimorbidity. Age equivalence presented here is a scaled regression coefficient (point estimates and 95% CIs) relating longitudinal phenotypic score and rate of change in functions and illustrates how many years older in functional age are individuals with one point higher in longitudinal phenotypic score. Participants: DSST, n = 921; memory, n = 922; executive function, n = 929; attention, n = 929; language, n = 929; visuospatial ability, n = 919; usual gait speed, n = 968; time to finish 400-m walk, n = 943; HABC SPPB, n = 968; multimorbidity index, n = 828); also see Supplementary Table 1b for more details.
Fig. 6
Fig. 6. Relationship between global longitudinal phenotypic score and changes in cognitive function.
ac, Higher global longitudinal phenotypic score indicates accelerated phenotypic aging trajectories. Higher annual decreases in DSST (a), memory (b), executive function (c), attention (d), language (e) and visuospatial ability (f) indicate faster decline of cognitive function. Memory score is constructed by the average of standardized immediate recall and long-delay-free recall from the CVL test. Language score is constructed as the average of standardized letter fluency and standardized category fluency. Attention score is constructed as the average standardized log-transformed trail-making tests part A and digit span forward. Executive function is constructed by the average of standardized log-transformed trail-making tests part B and digit span backward. Visuospatial ability is calculated by standardized cart rotations test. Two-sided tests were used, and the displayed P values were not adjusted for multiple comparisons. Participants with at least two visits: DSST, n = 867; memory, n = 877; executive function, n = 894; attention, n = 894; language, n = 892; visuospatial ability, n = 878; also, see Supplementary Table 1b for more details. Source data
Fig. 7
Fig. 7. Relationship of global longitudinal phenotypic score with change of multimorbidity index and survival probability.
a, Higher global longitudinal phenotypic score indicates accelerated phenotypic aging trajectories. Higher annual increase in multimorbidity indicates faster accumulation of chronic diseases. b, Among 893 participants aged >60 years during follow-up, the group with global longitudinal phenotypic score >0 (red) includes participants who experienced accelerated phenotypic aging trajectories, showing higher mortality compared with those with global longitudinal phenotypic score ≤0 (black; unadjusted time ratio (95% CI) = 0.87 (0.80, 0.95), P = 0.001, by fitting of Weibull distribution.) Two-sided tests were used, and the displayed P value was not adjusted for multiple comparisons. Source data
Fig. 8
Fig. 8. Age equivalence of a one-point difference in global cross-sectional phenotypic score for different functional outcomes.
Estimated age equivalence of a one-point difference in global cross-sectional phenotypic score for different functional outcomes, including cognitive function, physical function and multimorbidity. Age equivalence is a scaled regression coefficient (point estimates and 95% CIs) relating cross-sectional phenotypic score and rate of changes in functions and illustrates how many years older in functional age are individuals with one point higher in cross-sectional phenotypic scores. Number of participants: DSST, n = 922; memory, n = 922; executive function, n = 929; attention, n = 929; language, n = 929; visuospatial ability, n = 919; usual gait speed, n = 968; time to finish 400-m walk, n = 943; HABC SPPB, n = 968; multimorbidity index, n = 828; also see Supplementary Table 1b for more details.

References

    1. Ho JY, Hendi AS. Recent trends in life expectancy across high income countries: retrospective observational study. Br. Med. J. 2018;362:k2562. doi: 10.1136/bmj.k2562. - DOI - PMC - PubMed
    1. Crimmins EM. Lifespan and healthspan: past, present, and promise. Gerontologist. 2015;55:901–911. doi: 10.1093/geront/gnv130. - DOI - PMC - PubMed
    1. Gonzalez-Freire M, et al. The road ahead for health and lifespan interventions. Ageing Res. Rev. 2020;59:101037. doi: 10.1016/j.arr.2020.101037. - DOI - PMC - PubMed
    1. Ferrucci L, et al. Measuring biological aging in humans: a quest. Aging Cell. 2020;19:e13080. doi: 10.1111/acel.13080. - DOI - PMC - PubMed
    1. Ferrucci L, Kuchel GA. Heterogeneity of aging: individual risk factors, mechanisms, patient priorities, and outcomes. J. Am. Geriatr. Soc. 2021;69:610–612. doi: 10.1111/jgs.17011. - DOI - PMC - PubMed

Publication types