

PRISMA2020: An R package and Shiny app for producing PRISMA 2020-compliant flow diagrams, with interactivity for optimised digital transparency and Open Synthesis
- PMID: 36911350
- PMCID: PMC8958186
- DOI: 10.1002/cl2.1230
PRISMA2020: An R package and Shiny app for producing PRISMA 2020-compliant flow diagrams, with interactivity for optimised digital transparency and Open Synthesis
Abstract
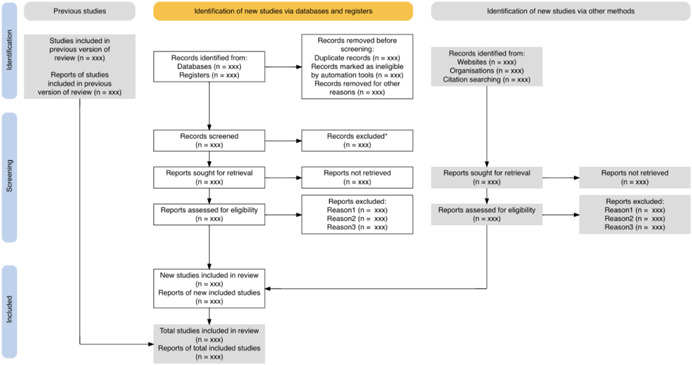
Background: Reporting standards, such as PRISMA aim to ensure that the methods and results of systematic reviews are described in sufficient detail to allow full transparency. Flow diagrams in evidence syntheses allow the reader to rapidly understand the core procedures used in a review and examine the attrition of irrelevant records throughout the review process. Recent research suggests that use of flow diagrams in systematic reviews is poor and of low quality and called for standardised templates to facilitate better reporting in flow diagrams. The increasing options for interactivity provided by the Internet gives us an opportunity to support easy-to-use evidence synthesis tools, and here we report on the development of a tool for the production of PRISMA 2020-compliant systematic review flow diagrams.
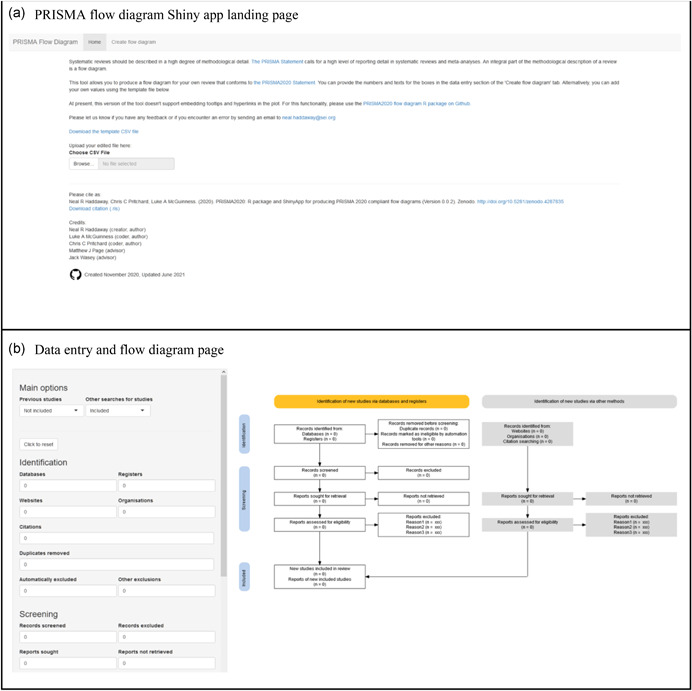
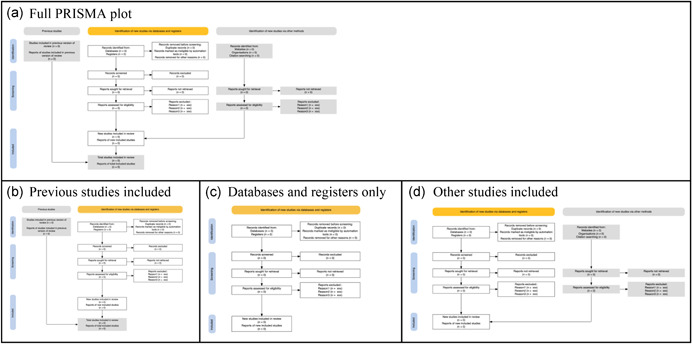
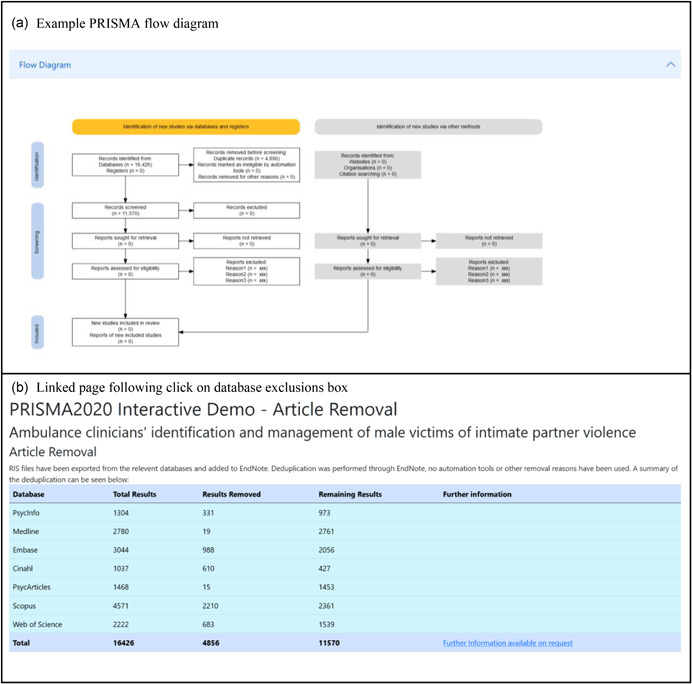
Methods and findings: We developed a free-to-use, Open Source R package and web-based Shiny app to allow users to design PRISMA flow diagrams for their own systematic reviews. Our tool allows users to produce standardised visualisations that transparently document the methods and results of a systematic review process in a variety of formats. In addition, we provide the opportunity to produce interactive, web-based flow diagrams (exported as HTML files), that allow readers to click on boxes of the diagram and navigate to further details on methods, results or data files. We provide an interactive example here; https://prisma-flowdiagram.github.io/.
Conclusions: We have developed a user-friendly tool for producing PRISMA 2020-compliant flow diagrams for users with coding experience and, importantly, for users without prior experience in coding by making use of Shiny (https://estech.shinyapps.io/prisma_flowdiagram/). This free-to-use tool will make it easier to produce clear and PRISMA 2020-compliant systematic review flow diagrams. Significantly, users can also produce interactive flow diagrams for the first time, allowing readers of their reviews to smoothly and swiftly explore and navigate to further details of the methods and results of a review. We believe this tool will increase use of PRISMA flow diagrams, improve the compliance and quality of flow diagrams, and facilitate strong science communication of the methods and results of systematic reviews by making use of interactivity. We encourage the systematic review community to make use of the tool, and provide feedback to streamline and improve their usability and efficiency.
© 2022 The Authors. Campbell Systematic Reviews published by John Wiley & Sons Ltd on behalf of The Campbell Collaboration.
Conflict of interest statement
Matthew Page co‐led the development of the PRISMA 2020 statement and Luke McGuinness is a coauthor of the PRISMA 2020 statement, but they have no commercial interest in the use of this reporting guideline.
Figures
References
-
- Beeley, C. (2013). Web application development with R using Shiny. Packt Publishing Ltd.
-
- Blank, G. , & Reisdorf, B. C. (2012). The participatory web: A user perspective on Web 2.0. Information, Communication & Society, 15(4), 537–554.
-
- Collaboration for Environmental Evidence . (2018). Guidelines and Standards for Evidence Synthesis in Environmental Management: Version 5.0. Project Report.
-
- Dyck, M. , Robie, J. , Snelson, J. , & Chamberlin, D. (2014). XML path language (XPath) 3.1. W3C Working Draft.
-
- Elliott, J. H. , Synnot, A. , Turner, T. , Simmonds, M. , Akl, E. A. , McDonald, S. , Salanti, G. , Meerpohl, J. , MacLehose, H. , Hilton, J. , Tovey, D. , Shemilt, I. , Thomas, J. , & Living Systematic Review, N. (2017). Living systematic review: 1. Introduction—The why, what, when, and how. Journal of Clinical Epidemiology, 91, 23–30. - PubMed
LinkOut - more resources
Full Text Sources