. 2023 Mar 3;15(3):evad044.
doi: 10.1093/gbe/evad044.

The Effect of Developmental Pleiotropy on the Evolution of Insect Immune Genes

Affiliations

The Effect of Developmental Pleiotropy on the Evolution of Insect Immune Genes

Alissa M Williams et al. Genome Biol Evol. .

Abstract

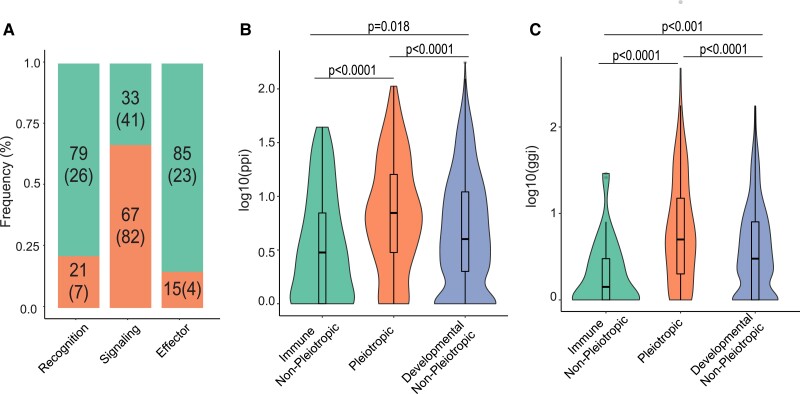
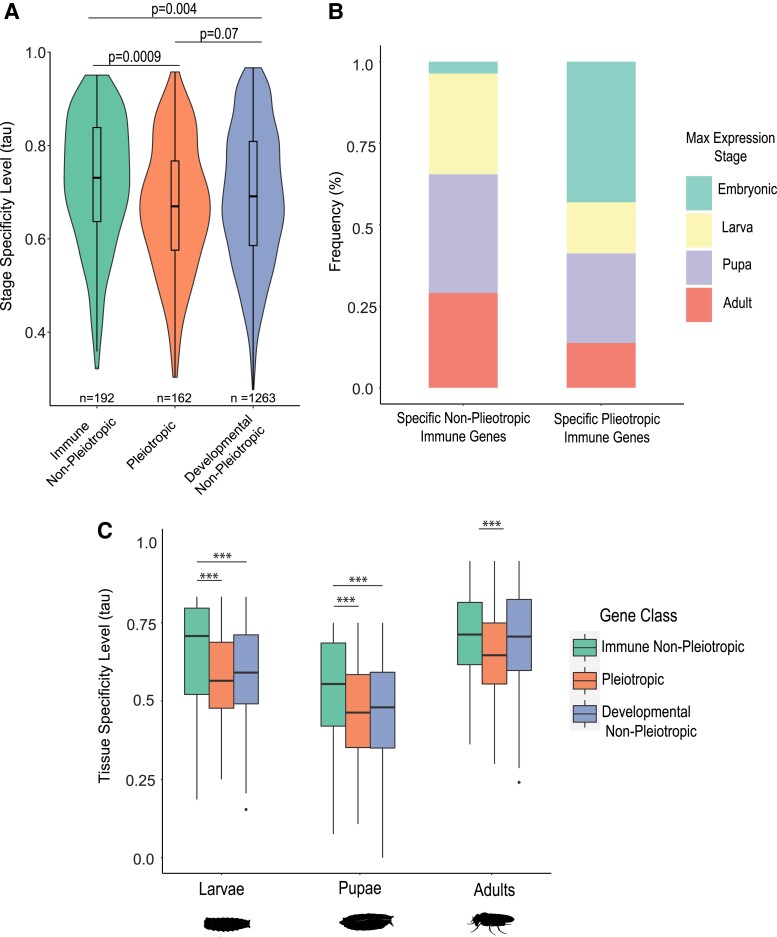
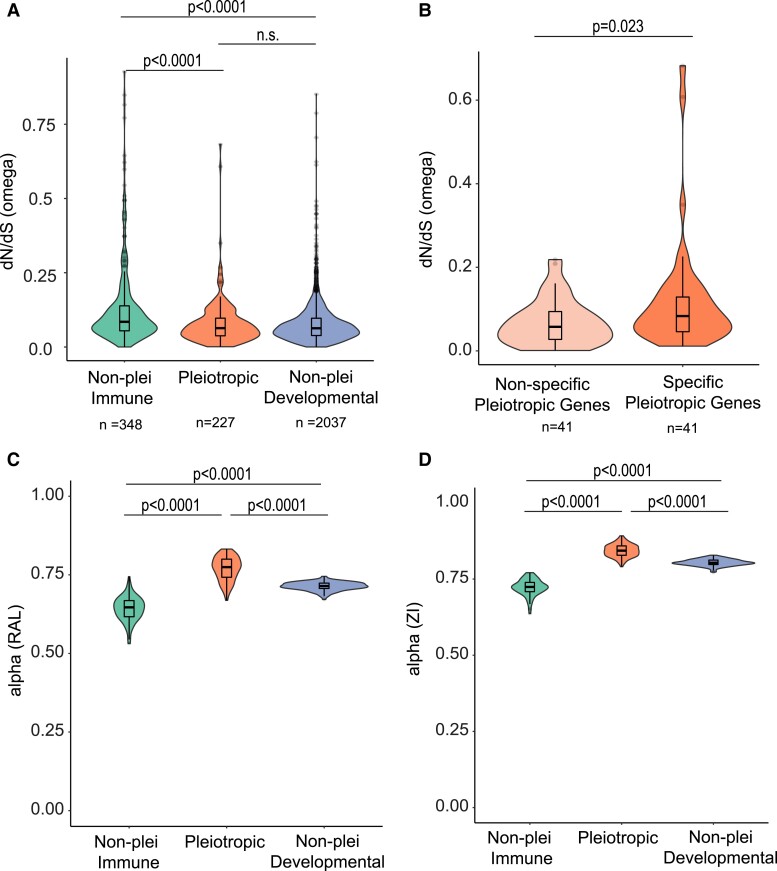
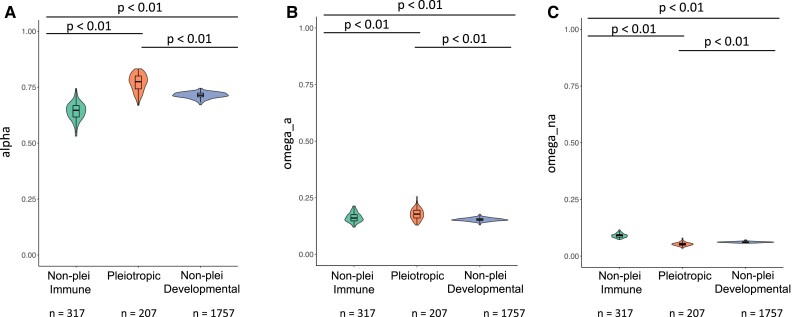
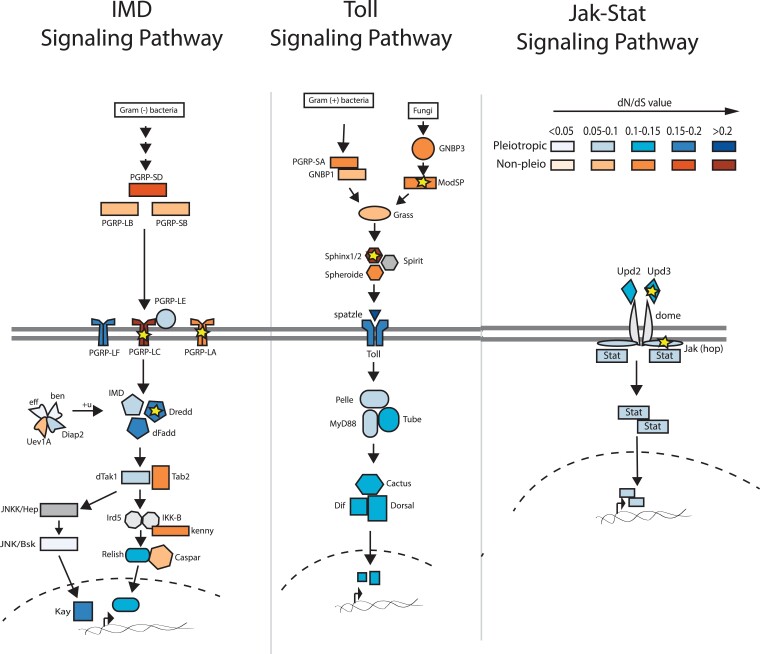
The pressure to survive ever-changing pathogen exposure explains the frequent observation that immune genes are among the fastest evolving in the genomes of many taxa, but an intriguing proportion of immune genes also appear to be under purifying selection. Though variance in evolutionary signatures of immune genes is often attributed to differences in gene-specific interactions with microbes, this explanation neglects the possibility that immune genes participate in other biological processes that could pleiotropically constrain adaptive selection. In this study, we analyzed available transcriptomic and genomic data from Drosophila melanogaster and related species to test the hypothesis that there is substantial pleiotropic overlap in the developmental and immunological functions of genes involved in immune signaling and that pleiotropy would be associated with stronger signatures of evolutionary constraint. Our results suggest that pleiotropic immune genes do evolve more slowly than those having no known developmental functions and that signatures of constraint are particularly strong for pleiotropic immune genes that are broadly expressed across life stages. These results support the general yet untested hypothesis that pleiotropy can constrain immune system evolution, raising new fundamental questions about the benefits of maintaining pleiotropy in systems that need to rapidly adapt to changing pathogen pressures.

Keywords: Toll pathway; adaptive evolution; evolutionary constraint; insect immunity; molecular evolution.


Figures

<sc>Fig.</sc> 1.
Fig. 1.
Overall characterization of pleiotropic and non-pleiotropic immune genes. Each immune gene was assigned a “gene class” (A) depending on their canonical function in an immune response. For each class, the percentage of pleiotropic (those with developmental roles; bottom bars) and non-pleiotropic genes (top bars) was determined (big number: proportion; number in parentheses: number of genes in that category). The number of known protein–protein interactions (ppi; B) and number of known gene–gene interactions (ggi; C) were also calculated for genes annotated as immune non-pleiotropic, pleiotropic for development and immunity, or developmental non-pleiotropic, represented on a log-scale and statistically analyzed using Kruskal–Wallis tests for overall significance followed by post hoc pairwise Dunn tests (Benjamini–Hochberg–adjusted P values on figure).
<sc>Fig.</sc> 2.
Fig. 2.
Comparison of relative life stage and tissue specificity of gene expression among immune, developmental, and pleiotropic genes. The stage specificity tau value, which varies from 0 (broadly expressed across all stages) to 1 (expressed in only one stage), was calculated for genes within each class (A). For the non-pleiotropic and pleiotropic immune gene group (B), the genes within the top 25th percentile of τ value were characterized as “specific genes,” and the stage with the highest expression for each gene was determined and tallied for the whole group. To compare tissue gene expression specificity between pleiotropic and non-pleiotropic genes within each life stage (C), the tau value (tissue specificity level) was calculated for each gene across tissues. Differences among groups were statistically analyzed using Kruskal–Wallis tests for overall significance followed by post hoc pairwise Dunn tests (Benjamini–Hochberg–adjusted P values on figure; *** indicates P.adj < 0.001).
<sc>Fig.</sc> 3.
Fig. 3.
Associations between genetic pleiotropy, stage specificity, and evolutionary statistics. dN/dS values (A) were compared among non-pleiotropic immune genes, genes with pleiotropic roles in development and immunity, and developmental genes with no known pleiotropic role in immunity. dN/dS values were also compared between pleiotropic genes that scored within the top and bottom quartiles of stage-specific expression (B), where non-specific pleiotropic genes are broadly expressed across life stages (tau ≤ 0.576) while the top quartile is specifically or maximally expressed in fewer stages (tau ≥ 0.767). The alpha values of genes in each category from the Raleigh (C) and Zambia (D) populations both illustrate higher proportions of adaptive substitutions within pleiotropic genes. Differences among groups were statistically analyzed using a Kruskal–Wallis test (A, C, D) followed by post hoc Dunn tests (P values BH-adjusted) or a Wilcoxon test (B). P values reproduced on the figure; n.s. = not significant (P.adj > 0.05).
<sc>Fig.</sc> 4.
Fig. 4.
Distributions in the D. melanogaster Raleigh (RAL) population of (A) α values, (B) ωa values, and (C) ωna values. α, ωa, and ωna values were calculated using MultiDFE on 100 bootstrap replicates of summed site frequency spectra (SFS) for each gene category. Distributions were compared using a Kruskal–Wallis test followed by post hoc Dunn tests in R.
<sc>Fig.</sc> 5.
Fig. 5.
Examining the pleiotropy status and dN/dS levels for genes participating in major insect immune signaling pathways. The color indicates whether it has pleiotropic roles in development and immunity (blue) or functions exclusively in immunity (orange). Each color is shaded according to the dN/dS level of each gene, with the darker shade representing a higher ω value within the gene's respective pleiotropic or non-pleiotropic group. Pathway components reflect annotated genes from KEGG. Components for which no pleiotropy status available (e.g., JNKK and Spirit) are shown in gray. Yellow stars indicate genes that have a positively selected fraction of sites (dN/dS > 1) as determined by comparison of PAML models M7 and M8 outputs (see Materials and Methods).

References

    1. Alvarez-Ponce D, Feyertag F, Chakraborty S. 2017. Position matters: network centrality considerably impacts rates of protein evolution in the human protein–protein interaction network. Genome Biol Evol. 9:1742–1756. - PMC - PubMed
    1. Anthoney N, Foldi I, Hidalgo A. 2018. Toll and Toll-like receptor signalling in development. Development 145:dev156018. - PubMed
    1. Areal H, Abrantes J, Esteves PJ. 2011. Signatures of positive selection in Toll-like receptor (TLR) genes in mammals. BMC Evol Biol. 11:368. - PMC - PubMed
    1. Artieri CG, Haerty W, Singh RS. 2009. Ontogeny and phylogeny: molecular signatures of selection, constraint, and temporal pleiotropy in the development of Drosophila. BMC Biol. 7:42. - PMC - PubMed
    1. Begun DJ, Whitley P. 2000. Adaptive evolution of relish, a Drosophila NF-κB/IκB protein. Genetics 154:1231–1238. - PMC - PubMed

Publication types

LinkOut - more resources