. 2023 Apr 4;40(4):msad057.
doi: 10.1093/molbev/msad057.

Interpreting the Evolutionary Echoes of a Protein Complex Essential for Inner-Ear Mechanosensation

Affiliations

Interpreting the Evolutionary Echoes of a Protein Complex Essential for Inner-Ear Mechanosensation

Collin R Nisler et al. Mol Biol Evol. .

Abstract

The sensory epithelium of the inner ear, found in all extant lineages of vertebrates, has been subjected to over 500 million years of evolution, resulting in the complex inner ear of modern vertebrates. Inner-ear adaptations are as diverse as the species in which they are found, and such unique anatomical variations have been well studied. However, the evolutionary details of the molecular machinery that is required for hearing are less well known. Two molecules that are essential for hearing in vertebrates are cadherin-23 and protocadherin-15, proteins whose interaction with one another acts as the focal point of force transmission when converting sound waves into electrical signals that the brain can interpret. This "tip-link" interaction exists in every lineage of vertebrates, but little is known about the structure or mechanical properties of these proteins in most non-mammalian lineages. Here, we use various techniques to characterize the evolution of this protein interaction. Results show how evolutionary sequence changes in this complex affect its biophysical properties both in simulations and experiments, with variations in interaction strength and dynamics among extant vertebrate lineages. Evolutionary simulations also characterize how the biophysical properties of the complex in turn constrain its evolution and provide a possible explanation for the increase in deafness-causing mutants observed in cadherin-23 relative to protocadherin-15. Together, these results suggest a general picture of tip-link evolution in which selection acted to modify the tip-link interface, although subsequent neutral evolution combined with varying degrees of purifying selection drove additional diversification in modern tetrapods.

Keywords: cadherins; mechanotransduction; tip link.


Figures

<sc>Fig.</sc> 1.
Fig. 1.
Inner-ear and tip-link structures and evolution. (A) A simple phylogeny of vertebrates, with ancestral species indicated in colored circles. The blue box indicates the approximate, independent development of a tympanic middle ear in the four amniote groups. At the leaves of each branch is a cartoon representation of the inner ear for each group. Shown in gray are vestibular structures and shown in pink are the auditory papillae. (B) Cartoon schematic of the human ear, showing the tympanic membrane (dark purple), middle ear bones (dark blue), vestibular system (light blue), and cochlea (pink). (C) The stereocilia are displaced in the direction of the applied force. The tip link connects two adjacent stereocilia and pulls the cell membrane of the lower stereocilium. (D) The tip link is composed of a heterotetramer of CDH23 and PCDH15, which interact through their two most N-terminal EC repeats, shown in the inset with Ca2+ in green. (E) Sequence alignments of CDH23 and PCDH15 EC1-2 for relevant vertebrate species. Pink asterisks in CDH23 indicate interactions that differ between vertebrate groups in the interface that were also relevant in simulations, and blue asterisks in PCDH15 indicate their interaction partners. (F) Crystal structures of CDH23 EC1-2 solved for the indicated species shown in cartoon representation with Ca2+ in green, Na+ in red, and with overlaid transparent molecular surfaces. Bold PDB codes indicate new structures reported in this work. (G) Crystal structure of the catfish Cdh23-Pcdh15b EC1-2 complex shown as in (F).
<sc>Fig.</sc> 2.
Fig. 2.
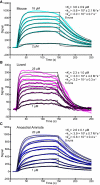
The mouse complex exhibits reduced affinity in SPR experiments. Representative curves from SPR experiments performed on the mouse (A; analyte injected at 2, 5, 8, 10, 12, 15, and 18 µM), lizard (B; analyte injected at 1, 2, 5, 8, 10, 12, 15, 18, and 25 µM), and AncAm (C; analyte injected at 1, 2, 3, 5, 8, 10, 12, 15, 18, and 20 µM) complexes. Raw data are shown in the colored curves with the fits in black. The average affinities (Kd), on rates (kon), and off rates (koff) are indicated, as well as the number of experiments performed on each complex. Values were obtained from a kinetic analysis of the raw data.
<sc>Fig.</sc> 3.
Fig. 3.
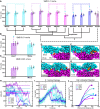
All-atom MD simulations reveal lineage-specific differences in tip-link bond dynamics and strength due to sequence changes. (A) The force extension profile for each complex for the first 0.1-nm/ns SMD simulation (Sim1b, Sim2b, Sim3b, and Sim4b). The mouse exhibited the lowest force peak, followed by the AncAm and pigeon, and the lizard exhibited the highest force. Raw data are shown in light colors with 1-ns running averages in solid lines. (B) Individual force peak values, averaged between both pull atoms, and distribution for all four species over six SMD simulations each are shown, as well as their average by the height of the box. Standard deviations are shown by the single black lines, whereas the 95% confidence intervals from estimation statistics are shown by the black lines and circles to the right of each bar, with the resampling distribution of the differences in means on the right. The lizard exhibited a higher force than the mouse. (C) The mouse and lizard complexes were pulled at 0.2 nm/ns, 0.02 nm/ns, and 0.004 nm/ns on the Anton 2 supercomputer (Sim28, Sim29, Sim30, Sim33, Sim34, and Sim35). Solid lines are 1-ns running averages. (DG) On the left is the structure at the force peak of the first 0.1-nm/ns SMD simulation for each complex. The next three panels indicate the three interactions in the interface that differ between reptiles and mammals and that contribute to differences in interface dynamics. Residues in PCDH15 are identical for all four complexes and are labeled in (D). Residues in CDH23 that differ from the mouse are indicated for the lizard in (E) and are identical for the pigeon and AncAm.
<sc>Fig.</sc> 4.
Fig. 4.
Cg MD Simulations show trends in tip-link bond properties across vertebrates that correlate with BSA and interface energy. (A) Results of CG SMD at 0.1 nm/ns (Sim5b-u, Sim8b-u, Sim11-20b-u). Data points are shown in circles, distributions are shown for each complex as in figure 3 (N = 20), and the average is indicated by the height of the box. Significant differences (determined from t-test and estimation statistics) from the mouse are indicated by a cyan star, whereas significant differences within lineages are indicated by dashed lines. (B) Results of CG SMD simulations at 0.01 nm/ns for the lizard and mouse (Sim6a-p and Sim9a-p; N = 16 for each set) are shown in (A). The lizard exhibited a significantly higher average force peak. (C) Results of CG SMD simulations at 0.001 nm/ns for the lizard and mouse (Sim7a-e and Sim10a-e; N = 5 for each set) are shown in (A). At this pulling speed, the lizard and mouse did not exhibit significantly different average force peaks. (DG) Each complex shown exhibited a significantly different average force peak from the mouse at 0.1 nm/ns, and sequence differences at the interface from the mouse are indicated in orange. (H) The BSA for the first SMD simulation of each complex indicated is shown as raw data (curves) and as the average BSA before the drop upon unbinding (solid horizontal line). (I) Force profile for the same simulations as in (H). Solid lines are 1-ns running averages. (J) The energy required to unbind each complex, calculated as a potential of mean force from umbrella sampling CG simulations. The same simulations were used to analyze the BSA and the force for each complex and to generate the initial conformations to compute the energy of unbinding.

References

    1. Abedin M, King N. 2008. The premetazoan ancestry of cadherins. Science 319:946–948. Available from:http://www.ncbi.nlm.nih.gov/pubmed/18276888. - PubMed
    1. Abraham MJ, Murtola T, Schulz R, Páll S, Smith JC, Hess B, Lindah E. 2015. Gromacs: high performance molecular simulations through multi-level parallelism from laptops to supercomputers. SoftwareX 1–2:19–25.
    1. Ahmed ZM, Goodyear R, Saima R, Lagziel A, Legan PK, Behra M, Burgess SM, Lilley KS, Wilcox ER, Sheikh R, et al. . 2006. The tip-link antigen, a protein associated with the transduction complex of sensory hair cells, is protocadherin-15. J Neurosci. 26:7022–7034. Available from:http://www.ncbi.nlm.nih.gov/pubmed/16807332. - PMC - PubMed
    1. Assad JA, Shepherd GM, Corey DP. 1991. Tip-link integrity and mechanical transduction in vertebrate hair cells. Neuron 7:985–994. Available from:http://www.ncbi.nlm.nih.gov/pubmed/1764247. - PubMed
    1. Bankoff RJ, Jerjos M, Hohman B, Lauterbur ME, Kistler L, Perry GH. 2017. Testing convergent evolution in auditory processing genes between echolocating mammals and the aye-aye, a percussive-foraging primate. Genome Biol Evol. 9:1978–1989. Available from:http://academic.oup.com/gbe/article/9/7/1978/4037174/Testing-Convergent-.... - PMC - PubMed

Publication types