. 2023 May 8;15(5):e17123.
doi: 10.15252/emmm.202217123. Epub 2023 Mar 13.

Specific associations between plasma biomarkers and postmortem amyloid plaque and tau tangle loads

Affiliations

Specific associations between plasma biomarkers and postmortem amyloid plaque and tau tangle loads

Gemma Salvadó et al. EMBO Mol Med. .

Abstract

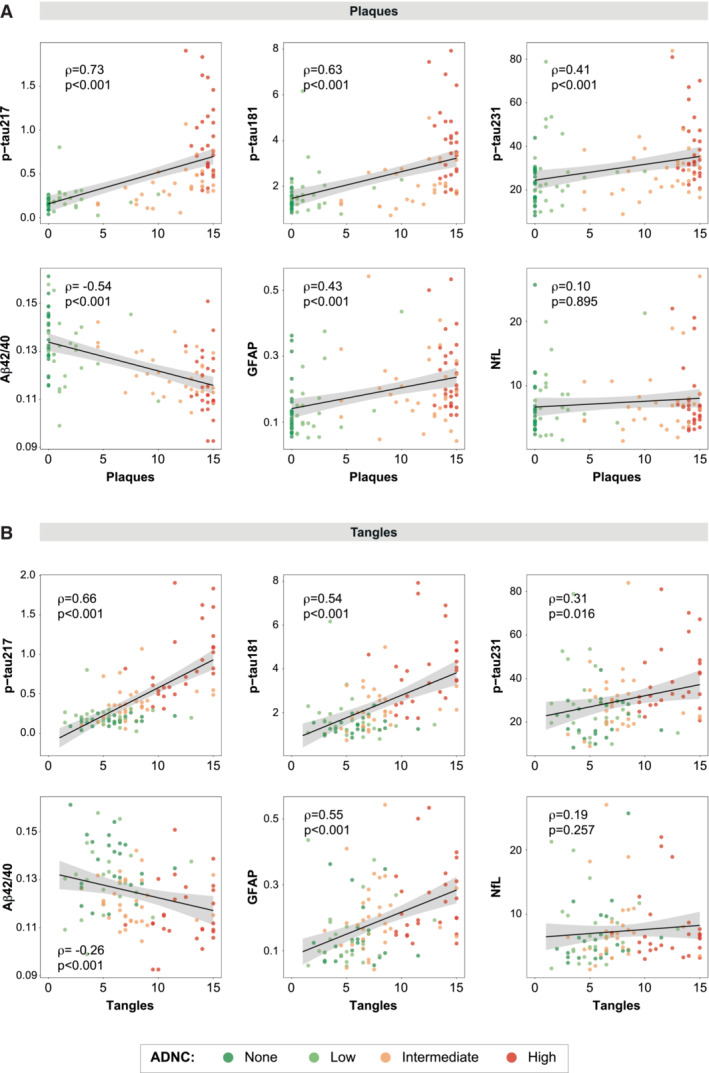
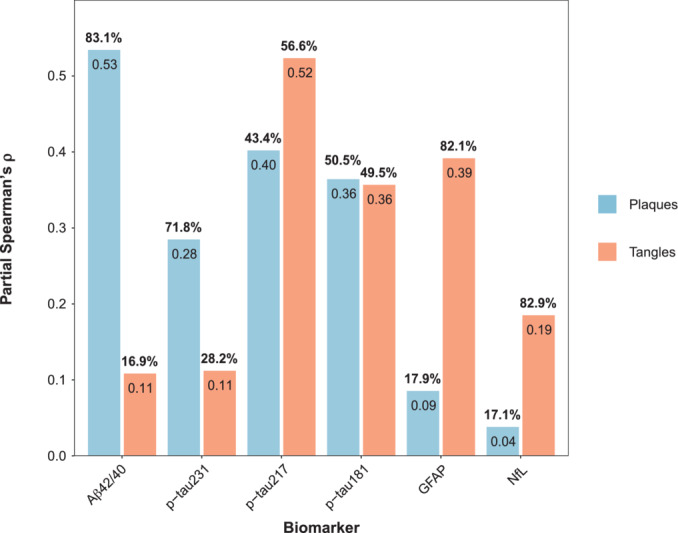
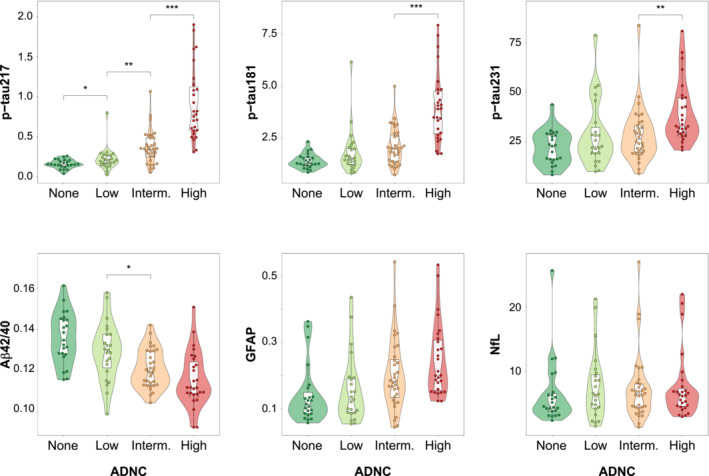
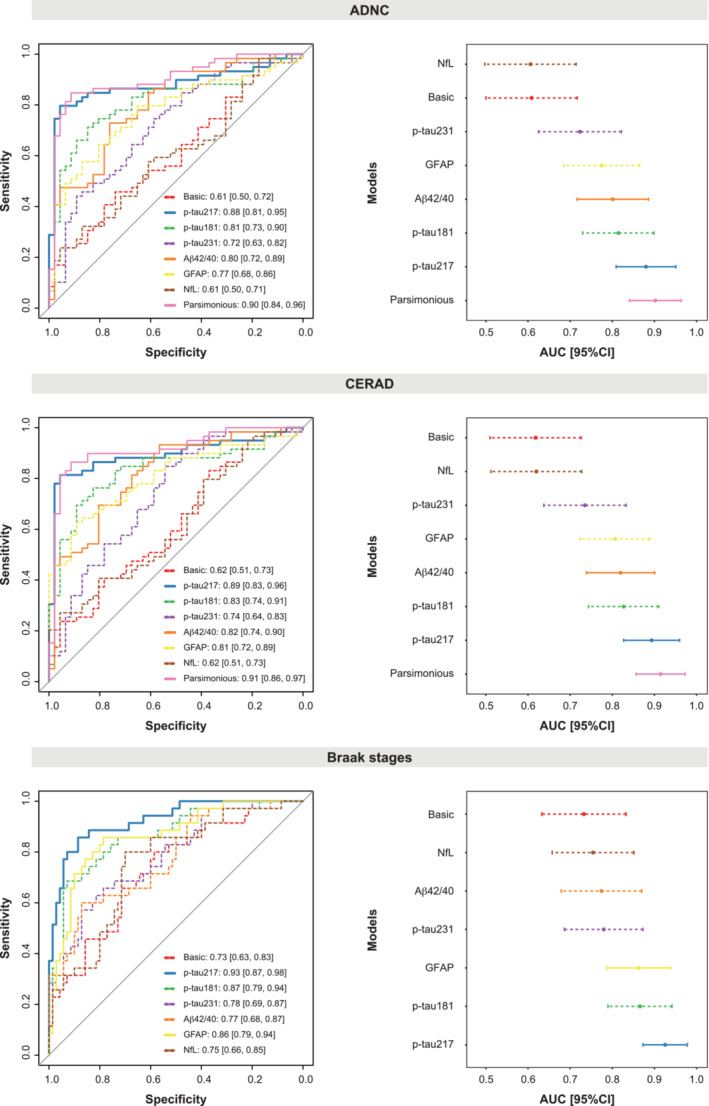
Several promising plasma biomarkers for Alzheimer's disease have been recently developed, but their neuropathological correlates have not yet been fully determined. To investigate and compare independent associations between multiple plasma biomarkers (p-tau181, p-tau217, p-tau231, Aβ42/40, GFAP, and NfL) and neuropathologic measures of amyloid and tau, we included 105 participants from the Arizona Study of Aging and Neurodegenerative Disorders (AZSAND) with antemortem plasma samples and a postmortem neuropathological exam, 48 of whom had longitudinal p-tau217 and p-tau181. When simultaneously including plaque and tangle loads, the Aβ42/40 ratio and p-tau231 were only associated with plaques (ρAβ42/40 [95%CI] = -0.53[-0.65, -0.35], ρp-tau231 [95%CI] = 0.28[0.10, 0.43]), GFAP was only associated with tangles (ρGFAP [95%CI] = 0.39[0.17, 0.57]), and p-tau217 and p-tau181 were associated with both plaques (ρp-tau217 [95%CI] = 0.40[0.21, 0.56], ρp-tau181 [95%CI] = 0.36[0.15, 0.50]) and tangles (ρp-tau217 [95%CI] = 0.52[0.34, 0.66]; ρp-tau181 [95%CI] = 0.36[0.17, 0.52]). A model combining p-tau217 and the Aβ42/40 ratio showed the highest accuracy for predicting the presence of Alzheimer's disease neuropathological change (ADNC, AUC[95%CI] = 0.89[0.82, 0.96]) and plaque load (R2 = 0.55), while p-tau217 alone was optimal for predicting tangle load (R2 = 0.45). Our results suggest that high-performing assays of plasma p-tau217 and Aβ42/40 might be an optimal combination to assess Alzheimer's-related pathology in vivo.

Keywords: Alzheimer's disease; co-pathologies; head-to-head; neuropathology; p-tau species.


Conflict of interest statement

HZ has served at scientific advisory boards and/or as a consultant for Abbvie, Alector, ALZPath, Annexon, Apellis, Artery Therapeutics, AZTherapies, CogRx, Denali, Eisai, Nervgen, Novo Nordisk, Passage Bio, Pinteon Therapeutics, Red Abbey Labs, reMYND, Roche, Samumed, Siemens Healthineers, Triplet Therapeutics, and Wave, has given lectures in symposia sponsored by Cellectricon, Fujirebio, Alzecure, Biogen, and Roche, and is a co‐founder of Brain Biomarker Solutions in Gothenburg AB (BBS), which is a part of the GU Ventures Incubator Program (outside submitted work). KB has served as a consultant, at advisory boards, or at data monitoring committees for Abcam, Axon, BioArctic, Biogen, JOMDD/Shimadzu. Julius Clinical, Lilly, MagQu, Novartis, Ono Pharma, Pharmatrophix, Prothena, Roche Diagnostics, and Siemens Healthineers, and is a co‐founder of Brain Biomarker Solutions in Gothenburg AB (BBS), which is a part of the GU Ventures Incubator Program, outside the work presented in this paper. OH has acquired research support (for the institution) from ADx, AVID Radiopharmaceuticals, Biogen, Eli Lilly, Eisai, Fujirebio, GE Healthcare, Pfizer, and Roche. In the past 2 years, he has received consultancy/speaker fees from AC Immune, Amylyx, Alzpath, BioArctic, Biogen, Cerveau, Fujirebio, Genentech, Novartis, Roche, and Siemens.

Figures

Figure 1
Figure 1. Associations between plasma biomarkers and amyloid plaque or neurofibrillary tau tangle loads
Black lines represent the association between plasma biomarkers and amyloid plaque (A) and tau tangle (B) loads after adjusting for covariates (age, sex, and time between blood sampling and death), but dots represent raw data. Shadowed area represents the 95%CI. Plaque and tangle loads were measured on a semi‐quantitative scale from 0 to 3 using the CERAD (Mirra et al, 1991) templates in five different regions that were added up to a total score ranging from 0 to 15. Datapoints are colored based on the ADNC classification. Standardized Spearman's ρ and P‐values of the association between plasma biomarkers and a load of amyloid plaques or tau tangles are shown in the plot. Aβ, amyloid‐β; ADNC, Alzheimer's disease neuropathologic change; CERAD, Consortium to Establish a Registry for Alzheimer's Disease; CI, confidence interval; GFAP, glial fibrillary acidic protein; NfL, neurofilament light; p‐tau, phosphorylated tau.
Figure 2
Figure 2. Specific associations between plasma levels and both amyloid plaque and tau tangle loads
Bars represent the partial Spearman's ρ of amyloid plaque load (blue) and tau tangle load (orange) on plasma levels after adjusting for the other pathology load. In separate models, each biomarker was used as a dependent variable and either amyloid load or tau load as independent variables adjusting for the other pathology measure. We also adjusted for age, sex, and time between blood sampling and death. Numbers inside the bars represent partial Spearman's ρ and numbers above the bars represent the percentual partial Spearman's ρ over the sum of the partial Spearman's ρ of the two pathologies' (%partial ρ = 100*partial ρ/[partial ρplaque + partial ρtangle]). Aβ, amyloid‐β; GFAP, glial fibrillary acidic protein; NfL, neurofilament light; p‐tau, phosphorylated tau.
Figure 3
Figure 3. Plasma levels by ADNC classification
Groups were compared using a pairwise Wilcoxon test as a post hoc comparison after testing tendency using a Kruskal–Wallis test. Post hoc comparisons were only performed between consecutive groups (n comp = 3). Central band of the boxplot represents the median of the group, the lower and upper hinges correspond to the first and third quartiles, and the whiskers represent the maximum/minimum value or the 1.5 IQR from the hinge, whatever is lower. ***P ≤ 0.001; **P ≤ 0.010; *P ≤ 0.050. Aβ, amyloid‐β; ADNC, Alzheimer's disease neuropathologic change; CI, confidence interval; GFAP, glial fibrillary acidic protein; IQR, interquartile range; NfL, neurofilament light; p‐tau, phosphorylated tau.
Figure 4
Figure 4. Plasma biomarkers for predicting neuropathological scales' classification
ROC curves for all models are shown in the left column and the correspondent AUC and 95% CI are shown in the right column. Models for all individual plasma biomarkers and the parsimonious (when available) model are shown. All models included: age, sex, and time between blood sampling and death as covariates. The parsimonious model for ADNC and CERAD included p‐tau217 and Aβ42/40 as predictors. The basic model includes only covariates. ADNC was dichotomized as negative (none/low) or positive (intermediate/high). CERAD was dichotomized as negative (low/sparse) or positive (moderate/frequent). Braak stages were dichotomized as negative (0–IV) or positive (V–VI). The individual biomarker with the best performance is shown as a solid bold line. Dashed lines represent individual biomarkers with significant (P < 0.05) lower AUC than the best individual biomarker (p‐tau217 in all cases). Other models with solid lines represent AUC equivalent to that of the best individual biomarker. Aβ, amyloid‐β; ADNC, Alzheimer's disease neuropathologic change; AUC, area under the curve; CERAD, Consortium to Establish a Registry for Alzheimer's Disease; CI, confidence interval; GFAP, glial fibrillary acidic protein; NfL, neurofilament light; p‐tau, phosphorylated tau; ROC, receiver‐operating characteristic.

References

    1. Arnold SJ, Dugger BN, Beach TG (2013) TDP‐43 deposition in prospectively followed, cognitively normal elderly individuals: correlation with argyrophilic grains but not other concomitant pathologies. Acta Neuropathol 126: 51–57 - PMC - PubMed
    1. Ashton NJ, Pascoal TA, Karikari TK, Benedet AL, Lantero‐Rodriguez J, Brinkmalm G, Snellman A, Schöll M, Troakes C, Hye A et al (2021) Plasma p‐tau231: a new biomarker for incipient Alzheimer's disease pathology. Acta Neuropathol 141: 709–724 - PMC - PubMed
    1. Ashton NJ, Janelidze S, Mattsson‐Carlgren N, Binette AP, Strandberg O, Brum WS, Karikari TK, González‐Ortiz F, di Molfetta G, Meda FJ et al (2022a) Differential roles of Aβ42/40, p‐tau231 and p‐tau217 for Alzheimer's trial selection and disease monitoring. Nat Med 28: 2555–2562 - PMC - PubMed
    1. Ashton NJ, Puig‐Pijoan A, Milà‐Alomà M, Fernández‐Lebrero A, García‐Escobar G, González‐Ortiz F, Kac PR, Brum WS, Benedet AL, Lantero‐Rodriguez J et al (2022b) Plasma and CSF biomarkers in a memory clinic: head‐to‐head comparison of phosphorylated tau immunoassays. Alzheimers Dement 10.1002/alz.12841 - DOI - PMC - PubMed
    1. Barthélemy NR, Li Y, Joseph‐Mathurin N, Gordon BA, Hassenstab J, Benzinger TLS, Buckles V, Fagan AM, Perrin RJ, Goate AM et al (2020) A soluble phosphorylated tau signature links tau, amyloid and the evolution of stages of dominantly inherited Alzheimer's disease. Nat Med 26: 398–407 - PMC - PubMed

Publication types