Review
. 2023 Jun;57(6):1676-1695.
doi: 10.1002/jmri.28663. Epub 2023 Mar 13.

Advanced MR Techniques for Preoperative Glioma Characterization: Part 2

Affiliations
Review

Advanced MR Techniques for Preoperative Glioma Characterization: Part 2

Gilbert Hangel et al. J Magn Reson Imaging. 2023 Jun.

Erratum in

Abstract

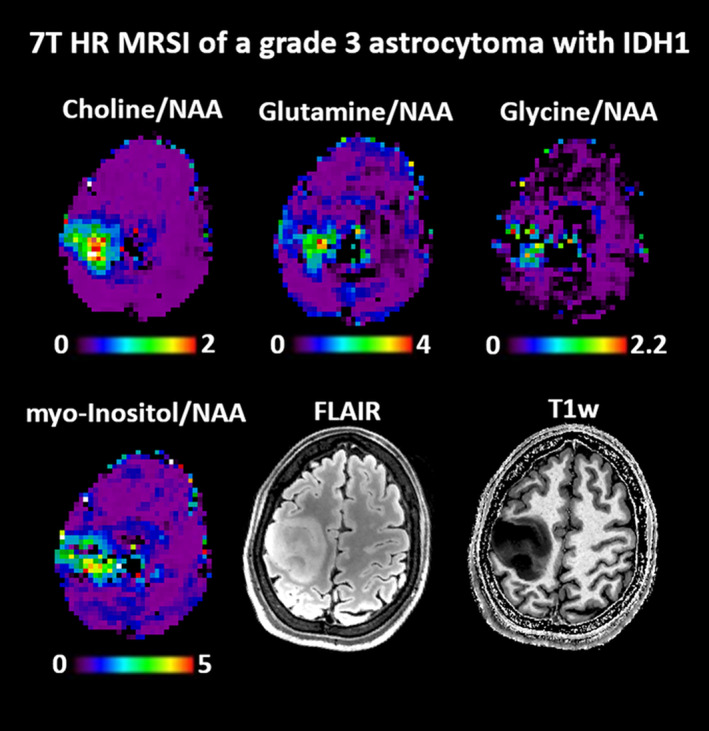
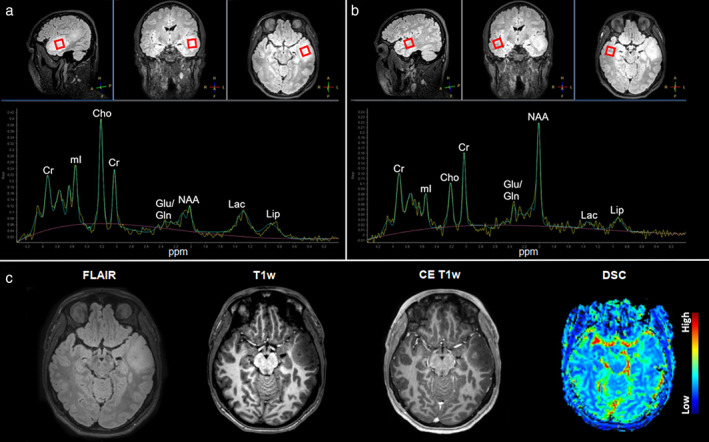
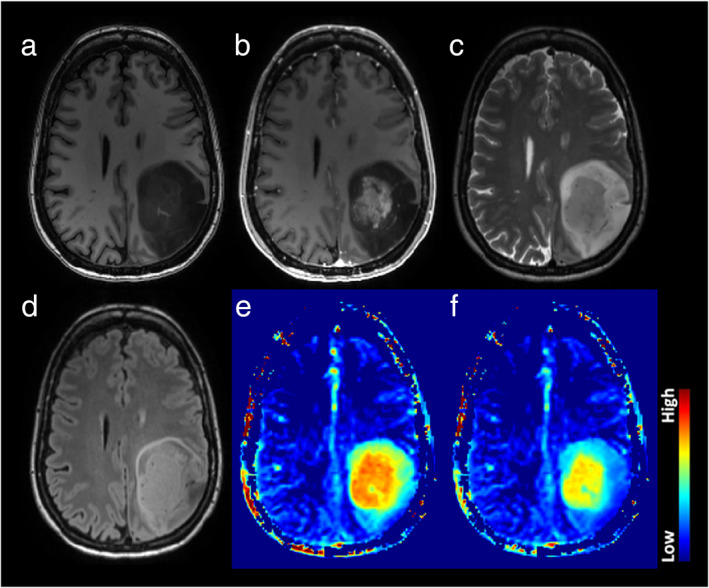
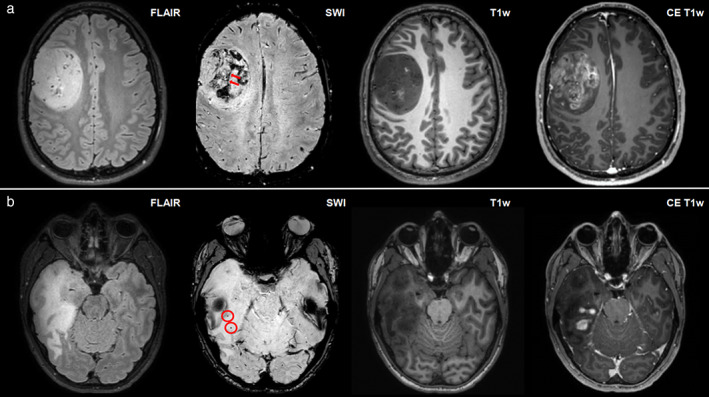
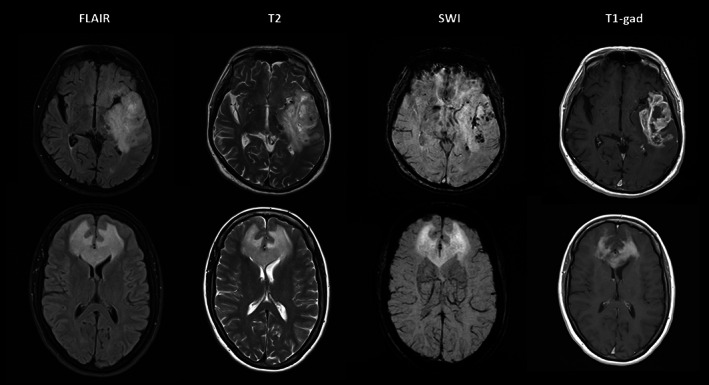
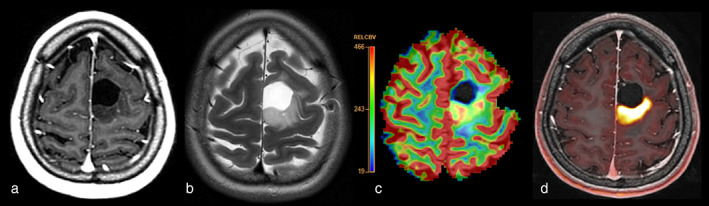
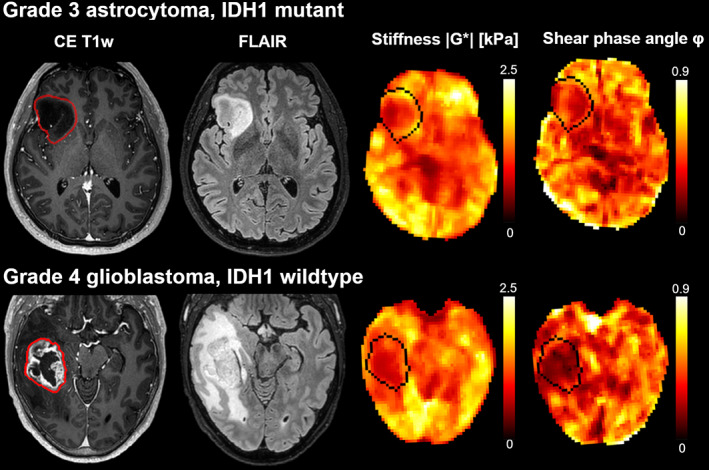
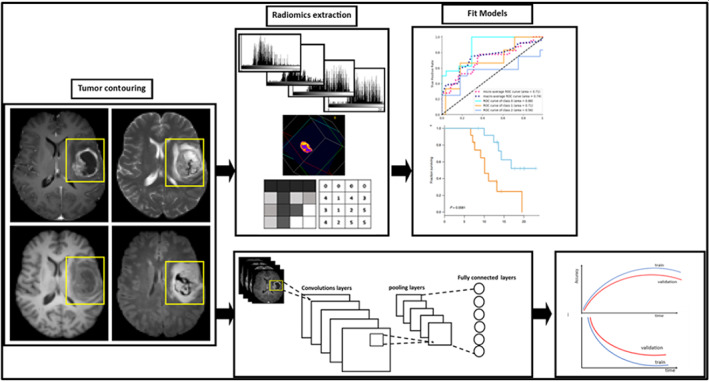
Preoperative clinical MRI protocols for gliomas, brain tumors with dismal outcomes due to their infiltrative properties, still rely on conventional structural MRI, which does not deliver information on tumor genotype and is limited in the delineation of diffuse gliomas. The GliMR COST action wants to raise awareness about the state of the art of advanced MRI techniques in gliomas and their possible clinical translation. This review describes current methods, limits, and applications of advanced MRI for the preoperative assessment of glioma, summarizing the level of clinical validation of different techniques. In this second part, we review magnetic resonance spectroscopy (MRS), chemical exchange saturation transfer (CEST), susceptibility-weighted imaging (SWI), MRI-PET, MR elastography (MRE), and MR-based radiomics applications. The first part of this review addresses dynamic susceptibility contrast (DSC) and dynamic contrast-enhanced (DCE) MRI, arterial spin labeling (ASL), diffusion-weighted MRI, vessel imaging, and magnetic resonance fingerprinting (MRF). EVIDENCE LEVEL: 3. TECHNICAL EFFICACY: Stage 2.

Keywords: GliMR 2.0; brain; contrasts; glioma; level of clinical validation; preoperative.


Figures

FIGURE 1
FIGURE 1
Metabolic ratio maps of a WHO grade 3 astrocytoma with IDH mutation (2016 WHO classification) obtained with a 7 T MRSI method that acquired 3D metabolic images with 3.4 mm nominal resolution in 15 minutes. All displayed oncometabolites to NAA are dominantly increased, but also show possible heterogeneities in the glioma metabolism.
FIGURE 2
FIGURE 2
A 3 T 1H‐MRS from a 35‐year‐old male with a left temporal lesion. (a) The voxel for measurement placed in the FLAIR‐hyperintense lesion of the left anterior temporal lobe (red box) together with the measured and fitted spectrum. (b) The voxel for measurement placed in the contralateral healthy side (red box) with the resulting measured and fitted spectrum from the same patient. The spectrum depicts major metabolites resonating at typical ppm (x‐axis). Measurements from the lesion showed elevated Cho (inversion of the Cho/Cr ratio), decreased NAA, and a modest Lac increase when compared to the contralateral measurements. (c) Corresponding axial slices from FLAIR, noncontrast T1‐, contrast‐enhanced T1‐weighted, and DSC perfusion imaging, characterizing the lesion as FLAIR‐hyperintense with discrete focal contrast enhancement and related focal hyperperfusion. The histopathological diagnosis after the biopsy was glioblastoma.
FIGURE 3
FIGURE 3
Example of an astrocytoma, IDH‐mutant, 1p/19q retained, CNS WHO grade 4. The structural images (a: T1w, b: T1w post‐Gd, c: T2w, d: FLAIR) demonstrate a heterogeneous lesion with a rather solid central and well‐enhancing part and a peripheral compartment demonstrating some T2/FLAIR mismatch without overt enhancement. The APT‐weighted maps (e: standard APT CEST, f: fluid‐suppressed APT CEST;Source: Casagranda S et al. ISMRM 29th An Meet 2021) show significantly elevated signal in the enhancing tumor, suggesting clearly high‐grade features. Notably, the rim zone of the lesion shows variable degrees of APTw signal elevation in the fluid‐suppressed images, thus suggesting that this compartment features mixed solid and cystic parts. Interestingly, the anterior rim zone, along with a halo surrounding the enhancing area, demonstrates a mildly elevated APTw signal that indicates likely high‐grade metabolic tumor characteristics. The data were acquired on a Siemens 3 T Prisma scanner. APTw protocol included DC = 91%, B1rms = 2uT, Tsat = 2 s, and WASAB1 for B0 correction. WASAB1 and APTw data were processed in Olea Sphere 3.0 software (Olea Medical, La Ciotat, France).
FIGURE 4
FIGURE 4
Panel (a) depicts a right frontal glioblastoma in a 40‐year‐old male and panel (B) depicts a right temporal anaplastic astrocytoma in a 32‐year‐old female, with high signal on fluid‐attenuated inversion recovery (FLAIR), low signal on T1‐weighted imaging, and partial contrast enhancement according to contrast‐enhanced T1‐weighted imaging. Intratumoral susceptibility signal (ITSS) abnormalities can be found according to susceptibility‐weighted imaging (SWI) in both patient cases (a: multiple dot‐like and fine linear ITSS abnormalities corresponding to ITSS grade 3, red arrowheads point at a prominent linear ITSS within the lesion; b: only few dot‐like ITSS abnormalities corresponding to ITSS grade 1, red circles enclose two exemplary dot‐like signal drops within the lesion).
FIGURE 5
FIGURE 5
Top row: 74‐year‐old man presenting with aphasia was found to have a high‐grade left temporal glioma on MRI (1.5 T). Note the intratumoral susceptibility signals (ITSS) on SWI indicative of microhemorrhage and vessel proliferation. Bottom row: 57‐year‐old woman presenting with behavioral changes due to a lymphoma. SWI does not show any ITSS despite marked homogeneous enhancement.
FIGURE 6
FIGURE 6
F18‐FET‐PET‐MRI of a 28‐year‐old female patient with resection of oligodendroglioma and a growing nonenhancing lesion posterior from the resection cavity with concordant high perfusion and high FET‐uptake consistent with (histopathologically confirmed) low‐grade recurrence. (a) Postcontrast T1w, (b) T2w, (c) rCBV map and (d) FET‐PET overlaid on postcontrast T1w.
FIGURE 7
FIGURE 7
Stiffness heterogeneity of gliomas. Contrast‐enhanced T1‐weighted images, FLAIR images, |G*| (stiffness), and φ maps (phase angle, related to viscosity) for two patients with gliomas. The images in the upper row are derived from a 40‐year‐old man with an IDH1‐mutated grade 3 astrocytoma, and the images in the lower row are derived from a 55‐year‐old man with an IDH1‐wild‐type grade 4 glioblastoma.
FIGURE 8
FIGURE 8
Schematic representation of classic machine learning (top) and deep learning (down) for imaging data from gliomas.

References

    1. Sanai N, Berger MS. Surgical oncology for gliomas: The state of the art. Nat Rev Clin Oncol 2018;15:112‐125. - PubMed
    1. Ellingson BM, Bendszus M, Boxerman J, et al. Consensus recommendations for a standardized brain tumor imaging protocol in clinical trials. Neuro Oncol 2015;17:1188‐1198. - PMC - PubMed
    1. Smits M. MRI biomarkers in neuro‐oncology. Nat Rev Neurol 2021;17:486‐500. - PubMed
    1. Clement P, Booth T, Borovečki F, et al. GliMR: Cross‐border collaborations to promote advanced MRI biomarkers for glioma. J Med Biol Eng 2021;41:115‐125. - PMC - PubMed
    1. Booth TC, Wiegers EC, Warnert EAH, et al. High‐grade glioma treatment response monitoring biomarkers: A position statement on the evidence supporting the use of advanced MRI techniques in the clinic, and the latest bench‐to‐bedside developments. Part 2: Spectroscopy, chemical exchange saturation, multiparametric imaging, and radiomics. Front Oncol 2021;11:811425. - PMC - PubMed

Publication types