. 2023 Apr 5;34(4):649-667.
doi: 10.1021/jasms.2c00341. Epub 2023 Mar 13.

Cerebrospinal Fluid and Brain Proteoforms of the Granin Neuropeptide Family in Alzheimer's Disease

Affiliations

Cerebrospinal Fluid and Brain Proteoforms of the Granin Neuropeptide Family in Alzheimer's Disease

James P Quinn et al. J Am Soc Mass Spectrom. .

Erratum in

Abstract

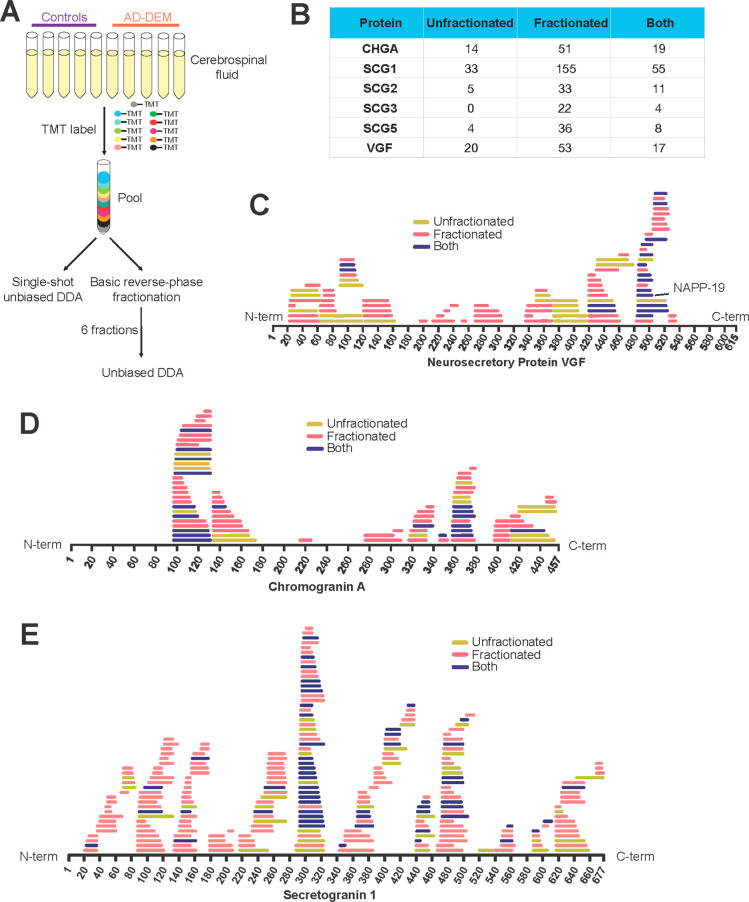
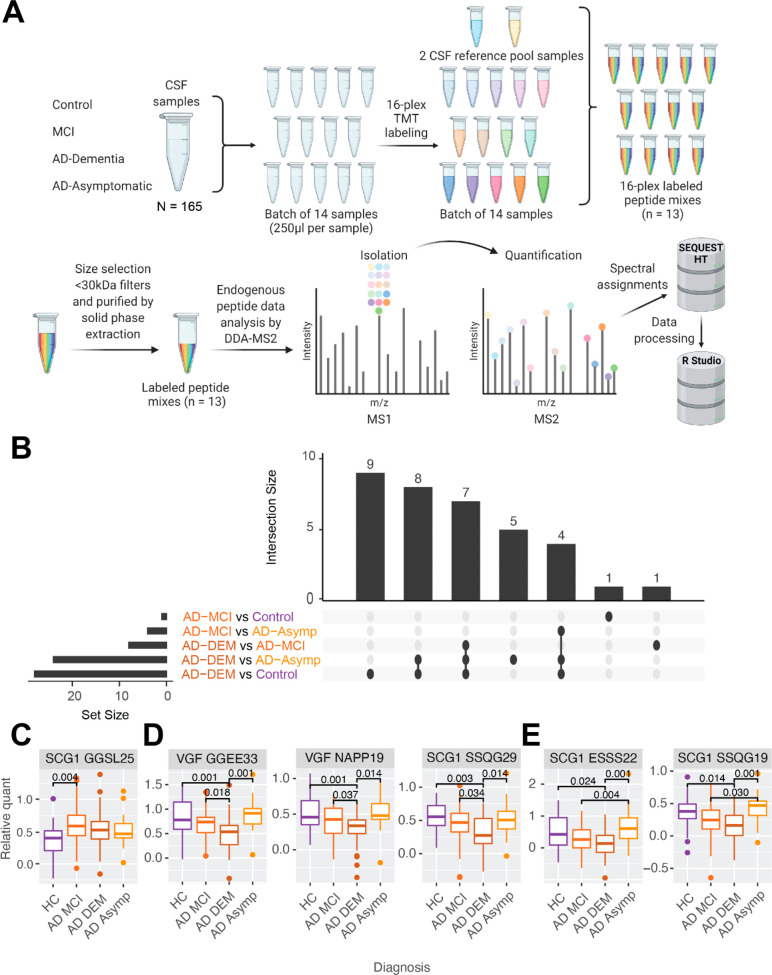
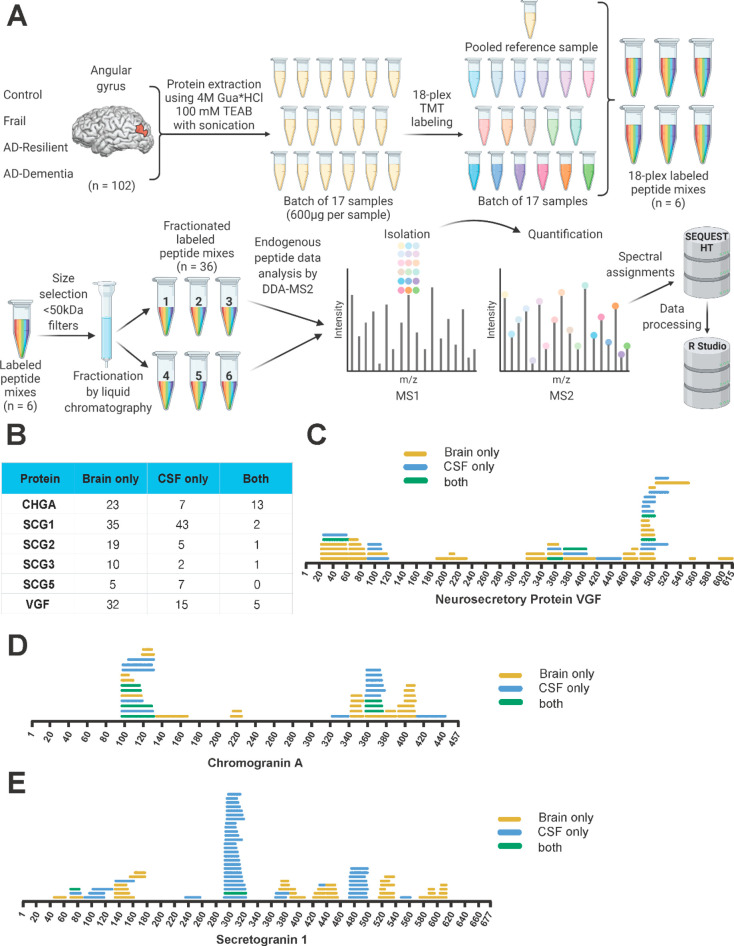
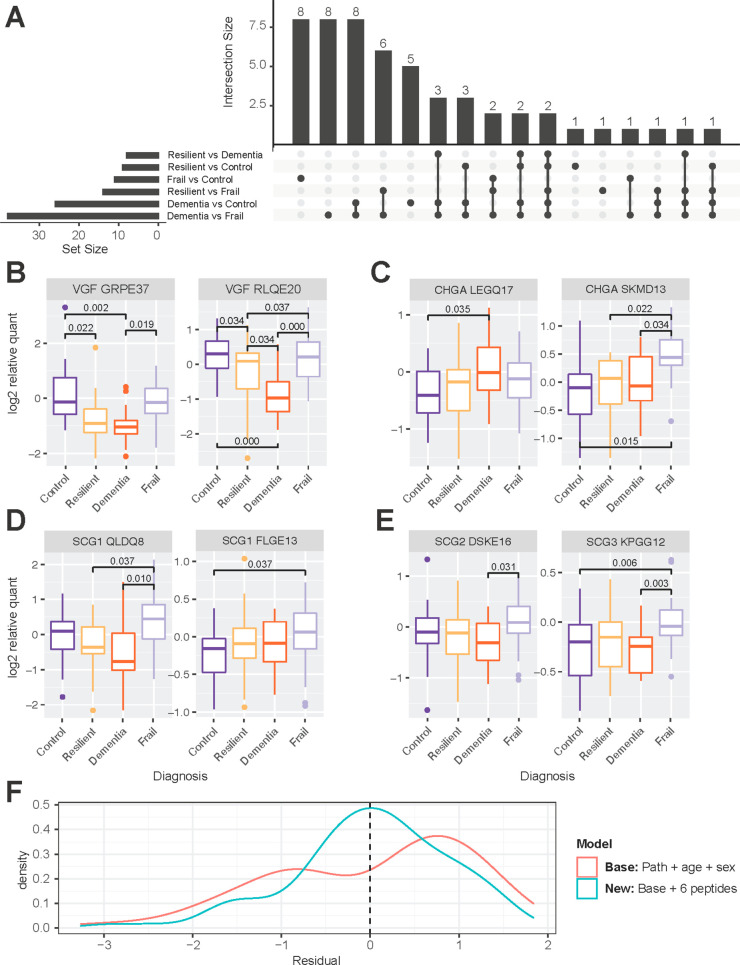
The granin neuropeptide family is composed of acidic secretory signaling molecules that act throughout the nervous system to help modulate synaptic signaling and neural activity. Granin neuropeptides have been shown to be dysregulated in different forms of dementia, including Alzheimer's disease (AD). Recent studies have suggested that the granin neuropeptides and their protease-cleaved bioactive peptides (proteoforms) may act as both powerful drivers of gene expression and as a biomarker of synaptic health in AD. The complexity of granin proteoforms in human cerebrospinal fluid (CSF) and brain tissue has not been directly addressed. We developed a reliable nontryptic mass spectrometry assay to comprehensively map and quantify endogenous neuropeptide proteoforms in the brain and CSF of individuals diagnosed with mild cognitive impairment and dementia due to AD compared to healthy controls, individuals with preserved cognition despite AD pathology ("Resilient"), and those with impaired cognition but no AD or other discernible pathology ("Frail"). We drew associations between neuropeptide proteoforms, cognitive status, and AD pathology values. Decreased levels of VGF proteoforms were observed in CSF and brain tissue from individuals with AD compared to controls, while select proteoforms from chromogranin A showed the opposite effect. To address mechanisms of neuropeptide proteoform regulation, we showed that the proteases Calpain-1 and Cathepsin S can cleave chromogranin A, secretogranin-1, and VGF into proteoforms found in both the brain and CSF. We were unable to demonstrate differences in protease abundance in protein extracts from matched brains, suggesting that regulation may occur at the level of transcription.


Conflict of interest statement

The authors declare the following competing financial interest(s): S. Arnold has received honoraria and/or travel expenses for lectures from Abbvie, Eisai, and Biogen and has served on scientifc advisory boards of Corte, has received consulting fees from Athira, Cassava, Cognito Therapeutics, EIP Pharma and Orthogonal Neuroscience, and has received research grant support from NIH, Alzheimers Association, Alzheimers Drug Discovery Foundation, Abbvie, Amylyx, EIP Pharma, Merck, Janssen/Johnson & Johnson, Novartis, and vTv.

Figures

Figure 1
Figure 1
Comparison of fractionated and unfractionated CSF analysis of neuropeptide proteoforms. (A) Schematic diagram showing experimental setup for deep mapping of CSF neuropeptide proteoforms. (B) Table showing the number of target neuropeptide proteoforms identified in only unfractionated or fractionated samples or in both sample types. (C) Map of neuropeptide proteoforms detected in VGF, (D) chromogranin A, and (E) secretogranin 1. Neuropeptide proteoforms identified only in unfractionated samples are shown in yellow and identified only in fractionated samples in pink, and proteoforms identified by both analyses are shown in dark blue.
Figure 2
Figure 2
Cerebrospinal fluid neuropeptide proteoforms linearity and robustness. (A) Experimental scheme for the CSF peptide linearity experiment. (B) The majority of peptides analyzed show excellent linearity above an R2 of 0.98 and are detectable in less than 25 μL of CSF (i.e., a limit of detection below 25 μL). The scatter plot shows that neuropeptide proteoforms that require a higher input volume to be detected also demonstrate poor linearity. (C) Experimental scheme for the peptide reproducibility experiment. (D) The majority of peptides identified are robustly quantified, with Intraplex and Interbatch CVs below 20%.
Figure 3
Figure 3
Quantification of neuropeptide proteoforms in CSF from individuals with Alzheimer’s disease. (A) Experimental scheme for neuropeptide quantification in CSF from individuals with Alzheimer’s disease and other diagnostic groups. (B) Upset plot showing the number of neuropeptide proteoforms significantly related to contrasts in experimental groups. (C) SCG1 (GGSL-25) was more abundant in AD-MCI than in healthy controls. (D) Examples of neuropeptide proteoforms significant in the cognitive contrasts including HC versus AD-DEM, AD-MCI versus AD-DEM, and AD-Asymp versus AD-DEM. (E) Examples of neuropeptide proteoforms significant in the cognitive contrasts including HC versus AD-DEM, AD-Asymp versus AD-DEM, and AD-MCI versus AD-Asymp. Significance is denoted by a Benjamini–Hochberg adjusted p value below 0.05 from a linear regression which includes age and sex as covariates. Created with BioRender.com.
Figure 4
Figure 4
Mapping of tissue neuropeptide proteoforms. (A) Experimental scheme for neuropeptide proteoform quantification in brain tissue from individuals with Alzheimer’s disease and other diagnostic groups. (B) Comparison of neuropeptide proteoforms confidently identified in quantitative experiments in brain only, CSF only, and in both matrices. (C) Mapping of VGF proteoforms, (D) CHGA proteoforms, and (E) SCG1 proteoforms in brain only (yellow), CSF only (blue), and both matrices (green). Created with BioRender.com.
Figure 5
Figure 5
Quantification of tissue neuropeptide proteoforms in individuals with Alzheimer’s disease. (A) Upset plot showing the number of neuropeptide proteoforms significantly associated with between-group contrasts. (B) VGF proteoforms from brain tend to show a similar pattern between groups, with the lowest levels in individuals with AD-DEM. (C) Significant between group associations with CHGA proteoforms show different patterns, with increased levels in AD-DEM versus Controls in LEGQ-17 while the levels were the highest in Frail individuals for SKMD-13. (D) Examples of two SCG1 proteoforms that are highest in Frail individuals. (E) Examples of a SCG2 and SCG3 proteoform that are highest in Frail individuals. Significance is denoted by a Benjamini–Hochberg adjusted p value below 0.05 from a linear regression model which includes age and sex as covariates. (F) Adding abundance values of six neuropeptide proteoforms to a linear model predicting global cognition improves the performance of the linear model. When six neuropeptide proteoforms are added to the linear model (blue), residuals are centered around 0 with a more normal distribution than in the base model (red).
Figure 6
Figure 6
Quantification of tissue full-length neuropeptide levels. (A, C) Semiquantitative densitometry of fluorescence was performed following immunoblotting using LI-COR Image Studio Lite. Data are expressed as the ratio of full-length CHGA (A) and VGF (C) to the pooled sample relative to the amido stain. Data are visualized by violin plot with all points shown, n = 84. Data were analyzed using the Kruskal–Wallis test with the Dunn’s test for multiple comparisons. (B, D) Angular Gyrus samples were harvested from the four diagnostic groups, Control (Co, n = 21), AD-DEM (AD-D, n = 20), AD-Resilient (AD-R, n = 21), Frail (Fr, n = 22), and the pooled sample (P) were separated by SDS–PAGE (20 μg total protein/lane). Nitrocellulose membranes were immunoblotted with CHGA (B), and VGF (D) specific antibodies then were stained with amido black as a loading control; representative images of the immunoblots are shown. The red band indicates the full-length CHGA and VGF analyzed. Both proteins exist as a doublet that corresponds to the full-length protein with and without the signal peptide as shown by the recombinant proteins run on a separate immunoblot but probed with the same antibody, recombinant chromogranin A was loaded at 22 ng and recombinant VGF was loaded at 15 ng per lane. Significant values are shown with a p value of less than 0.05.
Figure 7
Figure 7
Recombinant protease digestion of CHGA, SCG1, and VGF by Calpain-1 and Cathepsin S. 1 μg of recombinant human CHGA (A, B), SCG1 (C, D), and VGF (E, F) were incubated with 20 ng of recombinant human CAPN1 at 30 °C for 10 min (A, C, E) or 10 ng of recombinant human CTSS at 37 °C for 1 h (B, D, F). All digestions were performed in triplicate, reactions were stopped by freezing at −80 °C, and 1 μL of the total reaction volume was diluted in 1× loading buffer and heated at 95 °C for 5 min for immunoblot analysis. Nitrocellulose membranes were immunoblotted with CHGA (A, B), SCG1 (C, D), and VGF (E, F) specific antibodies. Amido black was not used as a loading control due to the low amount of protein that was separated.
Figure 8
Figure 8
Identification of Calpain-1 and Cathepsin S cleavage sites within CHGA, SCG1, and VGF. Recombinant protein digestions combining CHGA, SCG1, VGF, and Calpain-1 or Cathepsin S were performed as described in Figure 7. Recombinant protein digestions were subject to trypsin digestion and subsequent MS; a nontryptic search was used to identify novel Calpain-1 and Cathepsin S cleavage sites. (A) Nontryptic Calpain-1 and Cathepsin S cleavage sites identified are listed and in parentheses are those that match nontryptic cleavage sites identified in the endogenous neuropeptide proteoforms from brain (yellow), CSF (blue), or both (green). Novel Calpain-1 and Cathepsin S cleavage sites within endogenous brain, CSF, or both neuropeptide proteoforms from Chromogranin A (B), Secretogranin 1 (C), and VGF (D) are highlighted.

References

    1. Quinn J. P.; Kandigian S. E.; Trombetta B. A.; Arnold S. E.; Carlyle B. C. VGF as a Biomarker and Therapeutic Target in Neurodegenerative and Psychiatric Diseases. Brain Commun. 2021, 3 (4), 1–25. 10.1093/braincomms/fcab261. - DOI - PMC - PubMed
    1. Saito T.; Takaki Y.; Iwata N.; Trojanowski J.; Saido T. C. Alzheimer’s Disease, Neuropeptides, Neuropeptidase, and Amyloid-β Peptide Metabolism. Science of Aging Knowledge Environment 2003, 2003 (3), PE1. 10.1126/sageke.2003.3.pe1. - DOI - PubMed
    1. Husain M. M.; Nemeroff C. B. Neuropeptides and Alzheimer’s Disease. J. Am. Geriatr Soc. 1990, 38 (8), 918–925. 10.1111/j.1532-5415.1990.tb05710.x. - DOI - PubMed
    1. Mazurek M. F.; Beal M. F.; Martin J. B. Neuropeptides in Alzheimer’s Disease. Clinical Implications. Neurol Clin 1986, 4 (4), 753–768. 10.1016/S0733-8619(18)30946-0. - DOI - PubMed
    1. Rangon C.-M.; Haïk S.; Faucheux B. A.; Metz-Boutigue M.-H.; Fierville F.; Fuchs J.-P.; Hauw J.-J.; Aunis D. Different Chromogranin Immunoreactivity between Prion and A-Beta Amyloid Plaque. Neuroreport 2003, 14 (5), 755–758. 10.1097/00001756-200304150-00019. - DOI - PubMed