. 2023 Apr 1;55(4):179-193.
doi: 10.1152/physiolgenomics.00126.2022. Epub 2023 Mar 13.

Single-cell transcriptomic heterogeneity between conduit and resistance mesenteric arteries in rats

Affiliations

Single-cell transcriptomic heterogeneity between conduit and resistance mesenteric arteries in rats

Jacob R Anderson et al. Physiol Genomics. .

Abstract

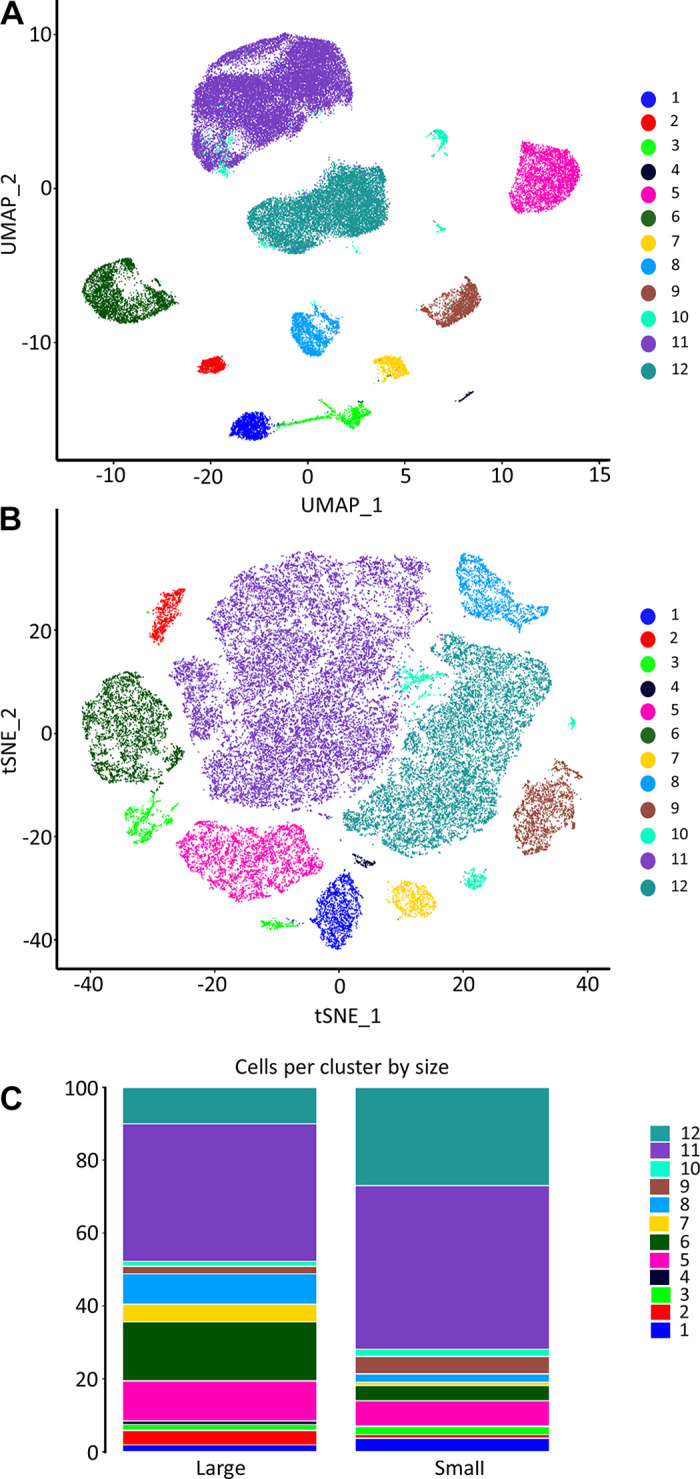
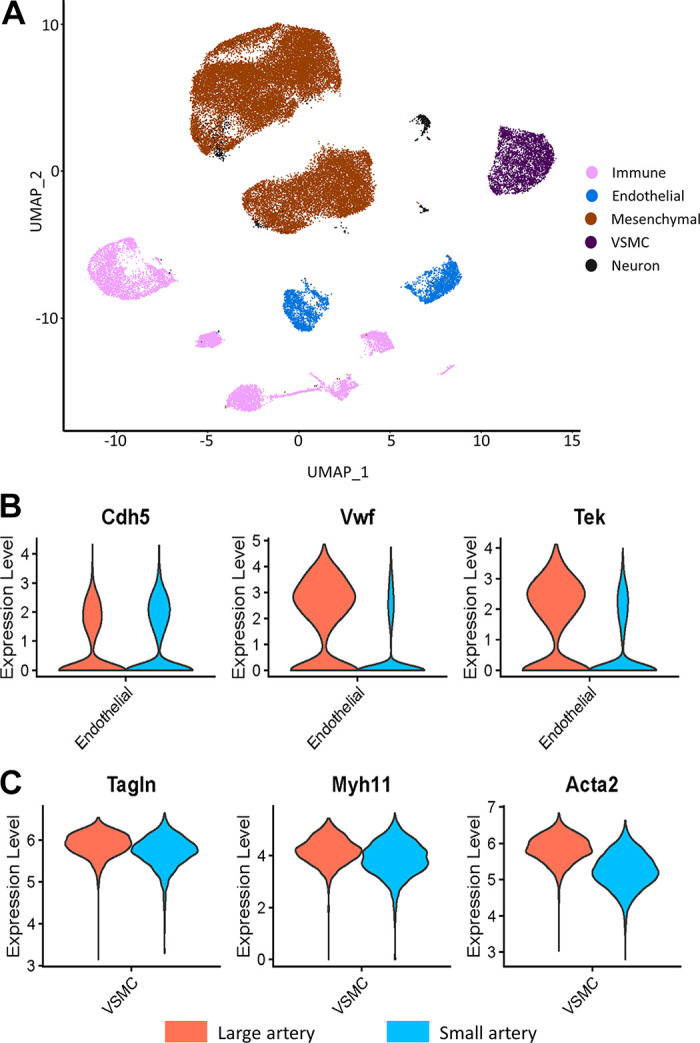
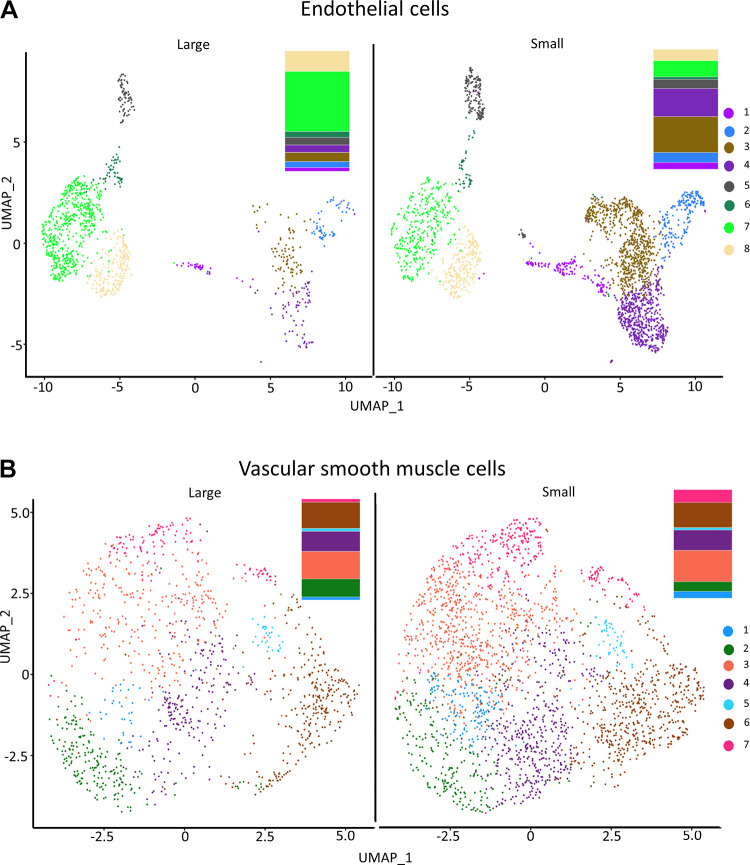
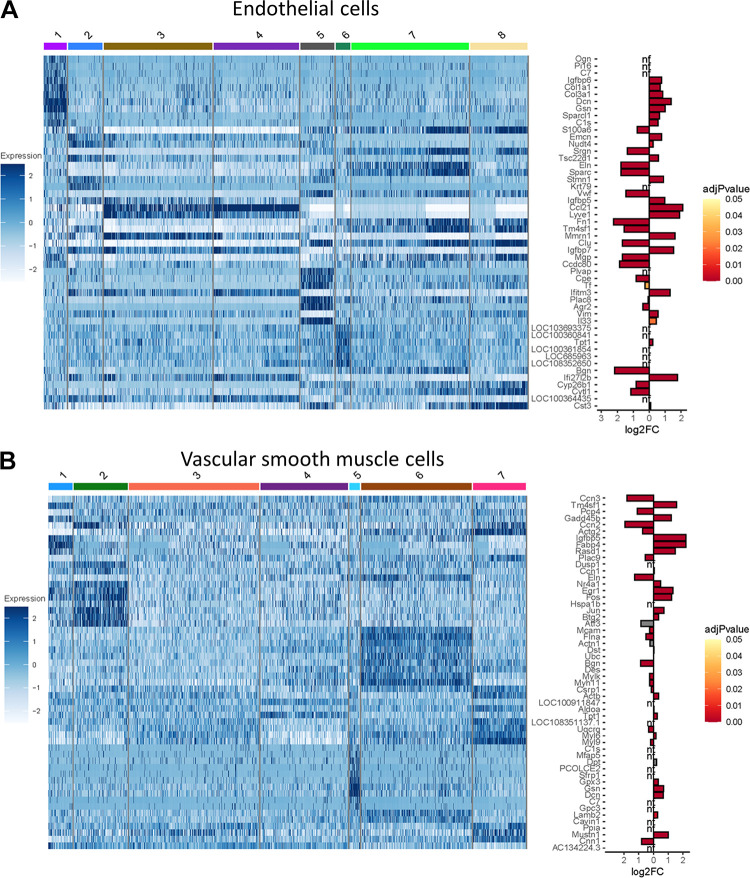
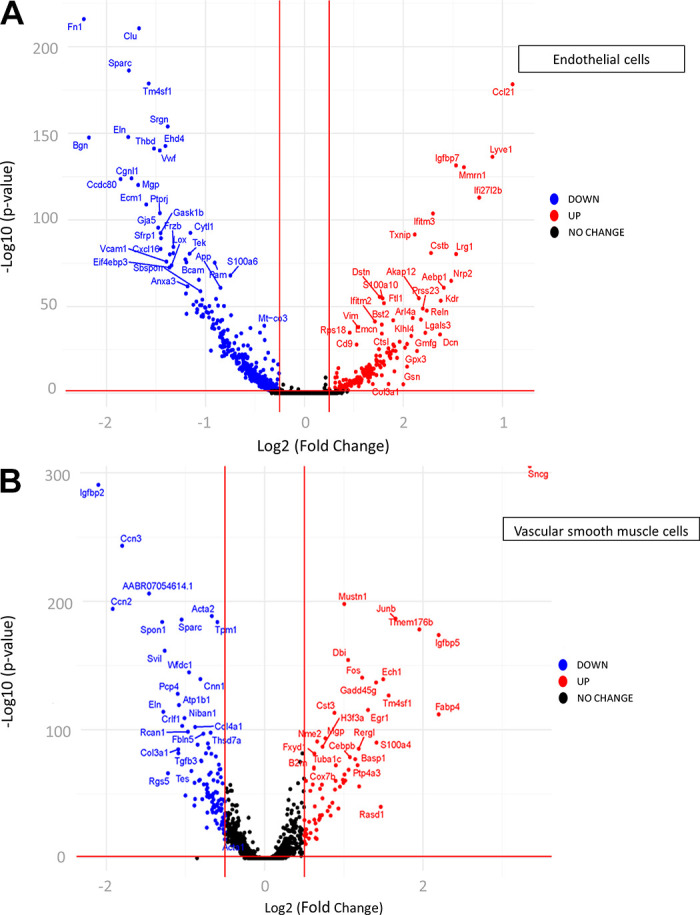
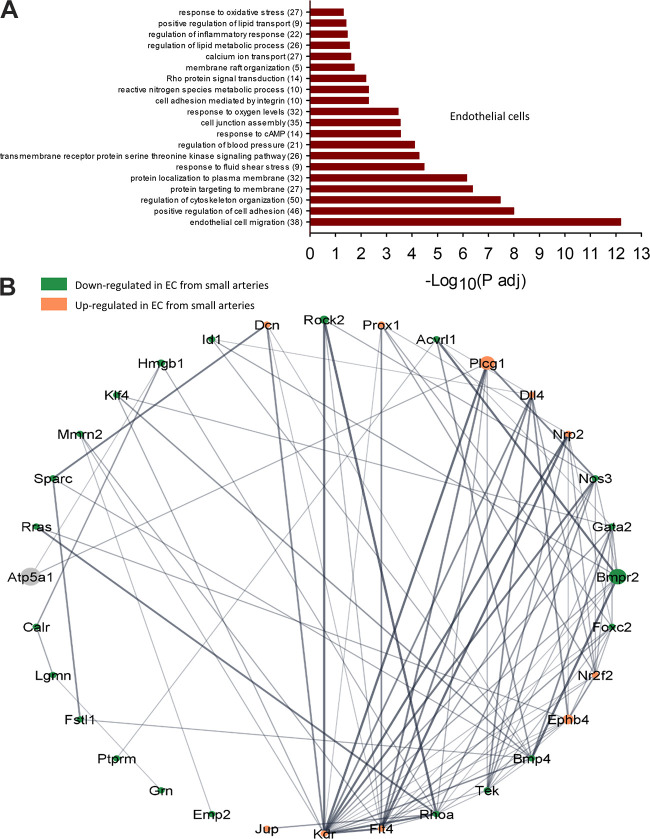
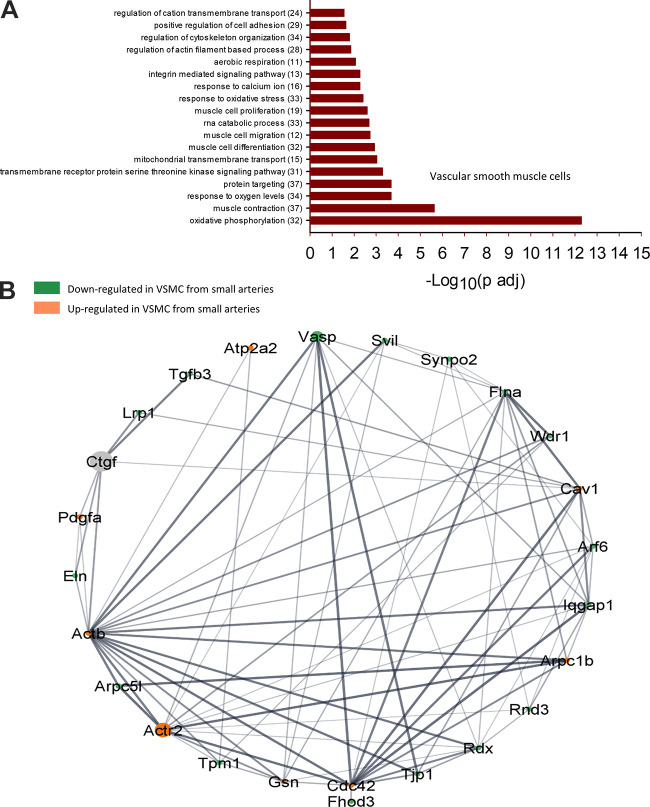
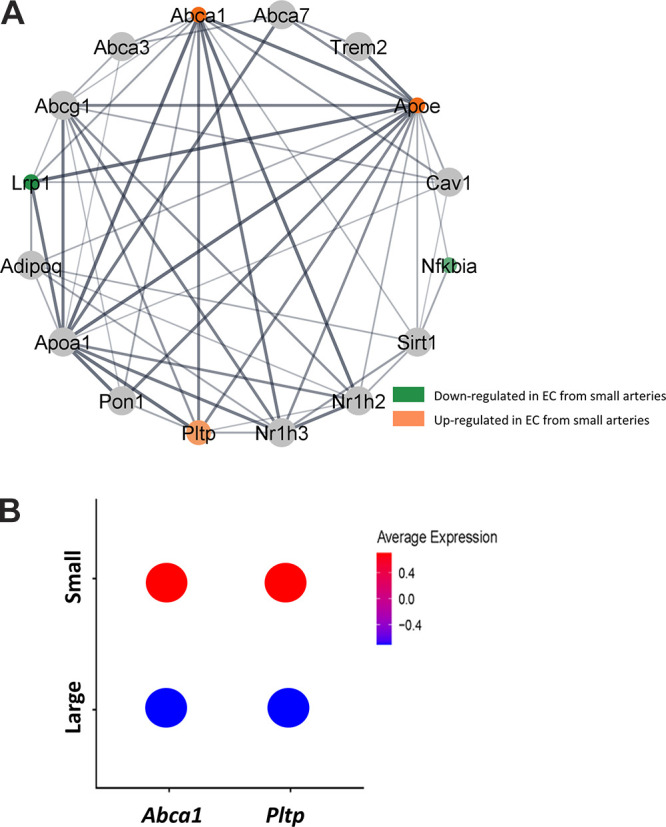
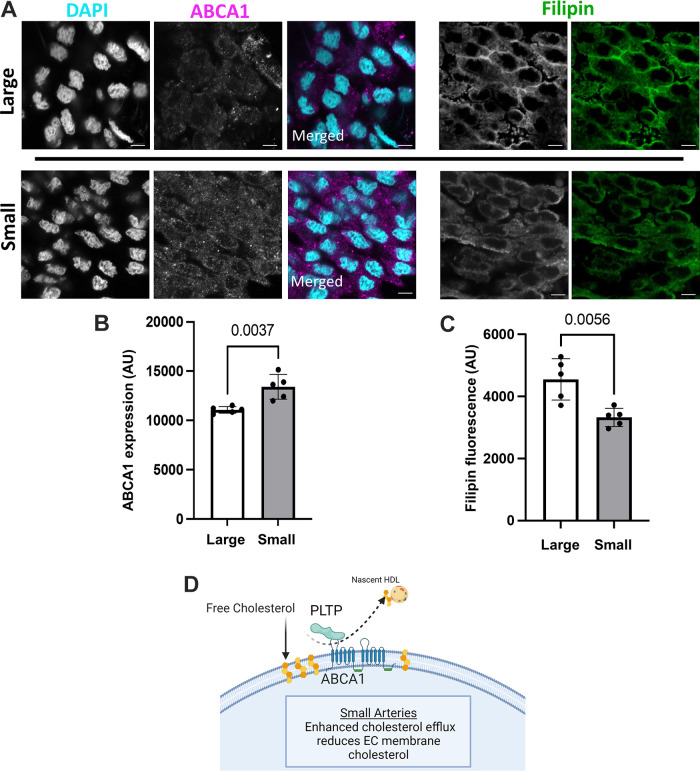
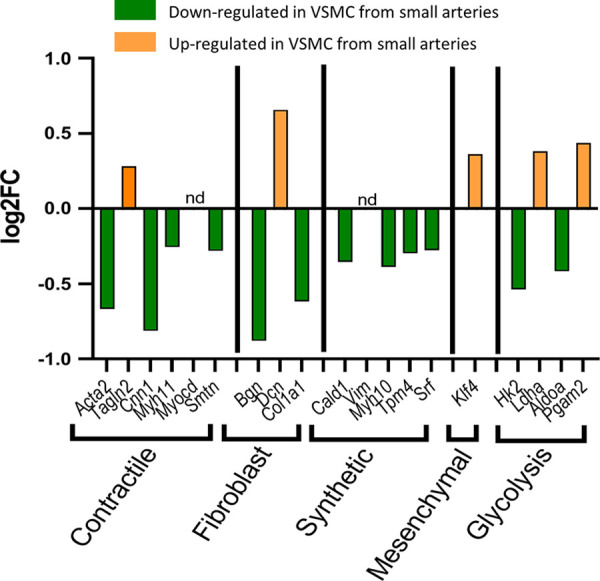
The endothelium contains morphologically similar cells throughout the vasculature, but individual cells along the length of a single vascular tree or in different regional circulations function dissimilarly. When observations made in large arteries are extrapolated to explain the function of endothelial cells (ECs) in the resistance vasculature, only a fraction of these observations are consistent between artery sizes. To what extent endothelial (EC) and vascular smooth muscle cells (VSMCs) from different arteriolar segments of the same tissue differ phenotypically at the single-cell level remains unknown. Therefore, single-cell RNA-seq (10x Genomics) was performed using a 10X Genomics Chromium system. Cells were enzymatically digested from large (>300 µm) and small (<150 µm) mesenteric arteries from nine adult male Sprague-Dawley rats, pooled to create six samples (3 rats/sample, 3 samples/group). After normalized integration, the dataset was scaled before unsupervised cell clustering and cluster visualization using UMAP plots. Differential gene expression analysis allowed us to infer the biological identity of different clusters. Our analysis revealed 630 and 641 differentially expressed genes (DEGs) between conduit and resistance arteries for ECs and VSMCs, respectively. Gene ontology analysis (GO-Biological Processes, GOBP) of scRNA-seq data discovered 562 and 270 pathways for ECs and VSMCs, respectively, that differed between large and small arteries. We identified eight and seven unique ECs and VSMCs subpopulations, respectively, with DEGs and pathways identified for each cluster. These results and this dataset allow the discovery and support of novel hypotheses needed to identify mechanisms that determine the phenotypic heterogeneity between conduit and resistance arteries.

Keywords: endothelial; heterogeneity; mesenteric; single-cell RNAseq; smooth muscle.


Conflict of interest statement

No conflicts of interest, financial or otherwise, are declared by the authors.

Figures

Figure 1.
Figure 1.
Single-cell RNA-sequencing atlas of mesenteric vascular wall cell types. Unbiased cluster analysis of cells from mesenteric arteries isolated by enzymatic digestion revealed 17 clusters. Smaller subclusters were manually merged to leave a final total of 12 clusters. Uniform manifold approximation and projection (UMAP; A) and t-distributed stochastic neighbor embedding plots (t-SNE; B). The proportion of cells per cluster between samples from large and small arteries (C).
Figure 2.
Figure 2.
Uniform manifold approximation and projection (UMAP) plot of in silico identified cells, color coded by cell type (A). Violin plots of the expression of gene markers confirming in silico identification of endothelial cells (ECs) (B) and vascular smooth muscle cells (VSMCs) (C). MSC, mesenchymal stem cell. For A, immune cells (pink), endothelial cells (blue), mesenchymal cells (brown), SMC (purple), neurons (black). For B and C, large (orange) and small (blue).
Figure 3.
Figure 3.
Representative images of the positive (CD44; A) and negative (CD34; B) mesenchymal stem cell markers in mesenteric artery cross sections. Sm22 (red) was used as a vascular smooth muscle cell (VSMC) marker, DAPI for nuclei (blue), CD44 and CD34 (green). C: seconday antibody only negative controls. Scale bar = 20 µm.
Figure 4.
Figure 4.
Uniform manifold approximation and projection (UMAP) plot visualization of in silico identified endothelial cell (EC, A) and vascular smooth muscle cell (VSMC, B) subclusters in cells from large and small arteries color coded for the identification of EC and VSMC subclusters. Bar graphs showing the relative fractions (%) of each EC and VSMC subcluster are provided to the right of the UMAP plots.
Figure 5.
Figure 5.
Gene expression profiles of endothelial cell (EC) and vascular smooth muscle cell (VSMC) subpopulations. Heatmaps of the top differentially expressed genes (DEGs) identified in each pan-EC (A) and pan-VSMC (B) subcluster (Comparison illustrated is subcluster x vs. all other subclusters). Bar graphs depict a comparison of these genes between large and small arteries. Genes with bars on the left-hand side of the bar plot were enriched in cells from large arteries, whereas genes with bars on the right are enriched in cells from small arteries. Genes with adj P values greater than 0.05 are shown in gray. nf, not found in gene list of DEGs between large and small arteries.
Figure 6.
Figure 6.
Volcano plots of differentially expressed genes (DEGs) in endothelial cells (ECs, A) and vascular smooth muscle cells (VSMCs, B) between large and small arteries. Genes significantly downregulated (blue) or upregulated (red) in small compared with large. Labels are included only for genes with > 1 log2fold change.
Figure 7.
Figure 7.
Selected GO biological processes (GOBP) pathway enrichment analysis significantly different between large and small endothelial cells (ECs, A). The number of DEGs within each pathway is shown in parentheses. Network analysis of selected GOBP pathway (endothelial cell migration) generated using String App in Cytoscape (B). Ball diameter represents magnitude of adjusted P value. Downregulated in cells from small arteries (green), upregulated in small arteries (orange). Gray balls are 2nd shell string interactors not found in dataset. Unconnected genes are not shown. Thickness of gray lines indicates strength of the scientific evidence for interaction between two genes.
Figure 8.
Figure 8.
Selected GO biological processes (GOBP) pathway enrichment analysis significantly different between large and small vascular smooth muscle cells (VSMCs, A). The number of DEGs within each pathway is shown in parentheses. Network analysis of selected GOBP pathway (Regulation of actin filament-based processes) generated using Search Tool for the Retrieval of Interaction Genes (String) App in Cytoscape (B). Ball diameter represents magnitude of adjusted P value. Downregulated in cells from small arteries (green), upregulated in small arteries (orange). Gray balls are 2nd shell string interactors not found in dataset. Unconnected genes are not shown. Thickness of gray lines indicates strength of the scientific evidence for interaction between two genes.
Figure 9.
Figure 9.
Network analysis of GO biological processes (GOBP) pathway (positive regulation of cholesterol efflux) generated using Search Tool for the Retrieval of Interaction Genes (String) App in Cytoscape (A). Ball diameter represents magnitude of adjusted P value. Downregulated in cells from small arteries (green), upregulated in small arteries (orange). Thickness of gray lines indicates strength of the scientific evidence for interaction between two genes. Average gene expression in endothelial cells (ECs) from large and small arteries from scRNA-seq analysis for Pltp and Abca1 (B).
Figure 10.
Figure 10.
Representative images of ABCA1 expression and the membrane cholesterol marker, filipin in endothelial cell tubes from large and small arteries (A). Quantification of mean fluorescence intensity for ABCA1 (B) and Filipin fluorescence (C). Nuclear stain DAPI (cyan), ABCA1 (magenta), and Filipin (green). Secondary antibody only control (Supplemental Fig. S6). Proposed hypothesis of the role of PLTP and ABCA1 in mediating the heterogeneous membrane cholesterol between endothelial cells (ECs) from large and small arteries (D). n = 5 animals/group; statistical comparison, unpaired Student’s t test. Scale bar = 5 µm.
Figure 11.
Figure 11.
Differential expression of vascular smooth muscle cell (VSMC) phenotype marker genes between large and small arteries. Genes downregulated in cells from small arteries (green). Genes upregulated in cells from small arteries (orange). nd, not detected in this data set.

References

    1. Krüger-Genge A, Blocki A, Franke R-P, Jung F. Vascular endothelial cell biology: an update. Int J Mol Sci 20: 4411, 2019. doi:10.3390/ijms20184411. - DOI - PMC - PubMed
    1. Schuliga M. Smooth muscle and extracellular matrix interactions in health and disease. In: Muscle Cell and Tissue, edited by Sakuma K. London: IntechOpen, 2015, p. 486. doi:10.5772/60403. - DOI
    1. Tykocki NR, Boerman EM, Jackson WF. Smooth muscle ion channels and regulation of vascular tone in resistance arteries and arterioles. Compr Physiol 7: 485–581, 2017. doi:10.1002/cphy.c160011. - DOI - PMC - PubMed
    1. Jiang J, Zheng JP, Li Y, Gan Z, Jiang Y, Huang D, Li H, Liu Z, Ke Y. Differential contribution of endothelium-derived relaxing factors to vascular reactivity in conduit and resistance arteries from normotensive and hypertensive rats. Clin Exp Hypertens 38: 393–398, 2016. doi:10.3109/10641963.2016.1148155. - DOI - PubMed
    1. Vanlandewijck M, He L, Mäe MA, Andrae J, Ando K, Del Gaudio F, Nahar K, Lebouvier T, Laviña B, Gouveia L, Sun Y, Raschperger E, Räsänen M, Zarb Y, Mochizuki N, Keller A, Lendahl U, Betsholtz C. A molecular atlas of cell types and zonation in the brain vasculature. Nature 554: 475–480, 2018. [Erratum in Nature 560: E3, 2018]. doi:10.1038/nature25739. - DOI - PubMed

Publication types