. 2023 Apr 1;60(2):351-377.
doi: 10.1215/00703370-10609710.

Understanding Geographic Disparities in Mortality

Affiliations

Understanding Geographic Disparities in Mortality

Jason M Fletcher et al. Demography. .

Abstract

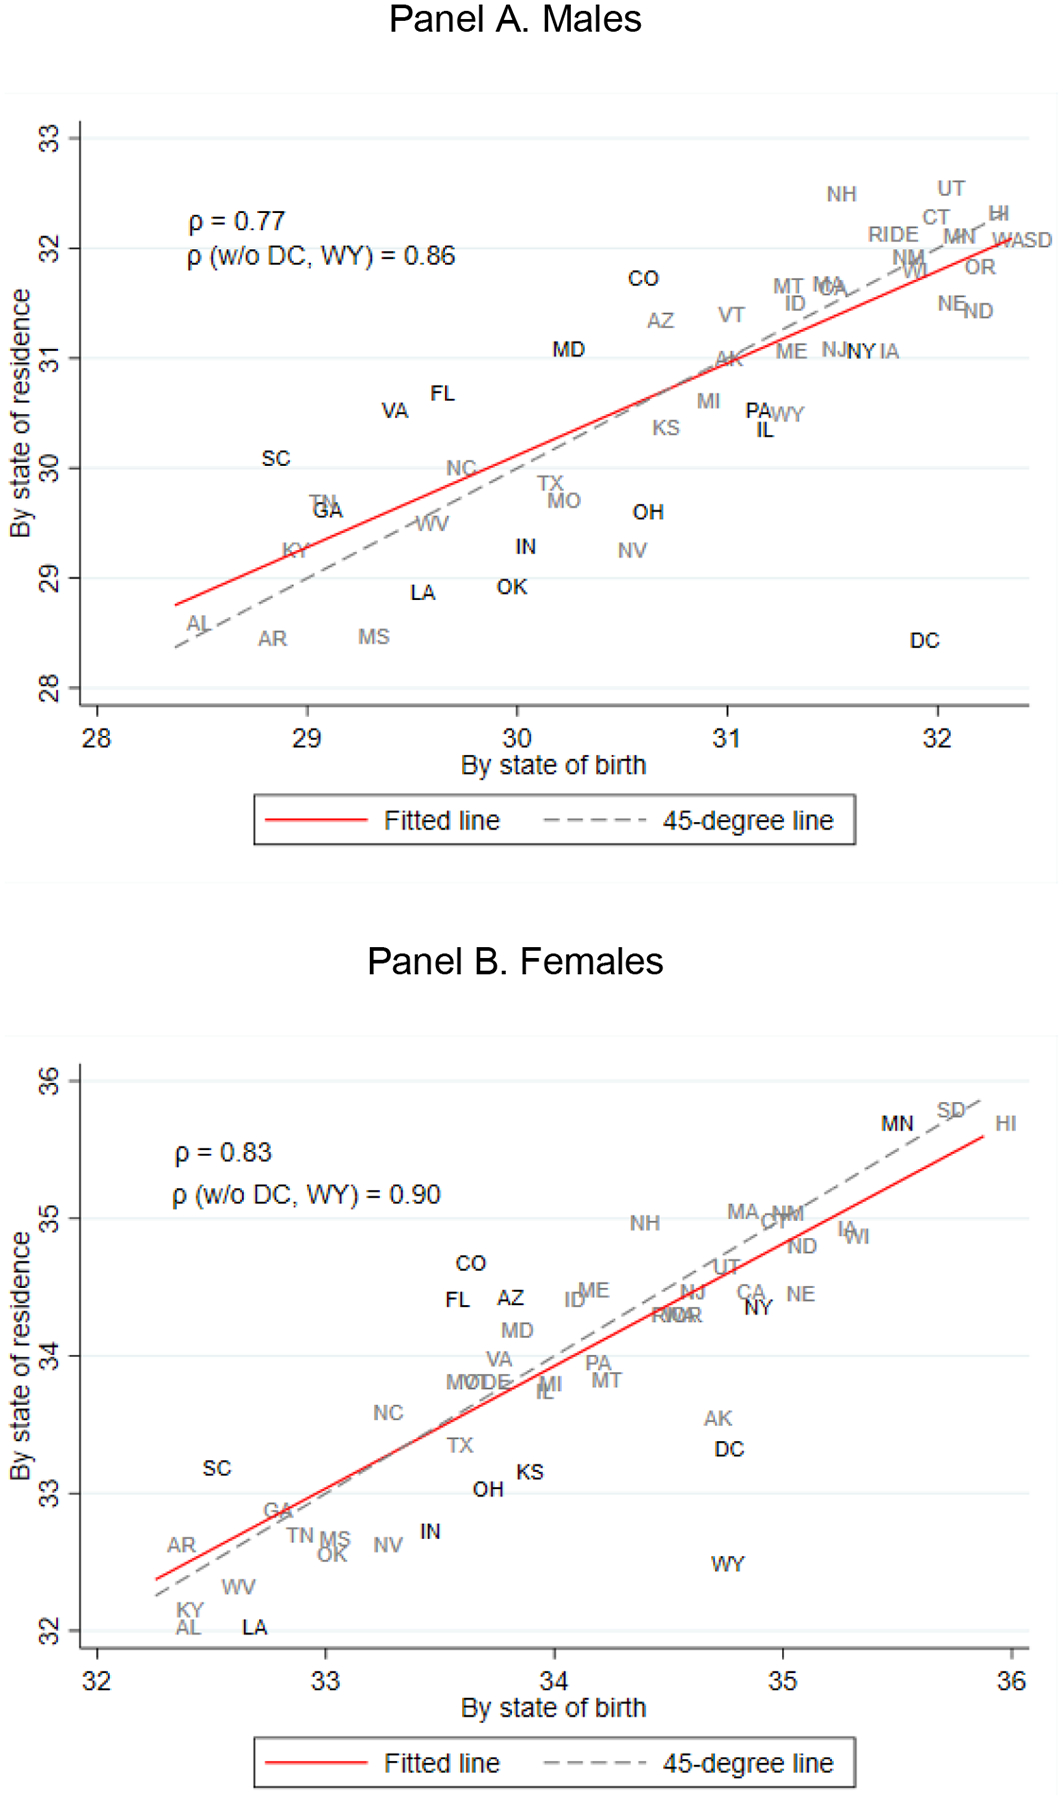
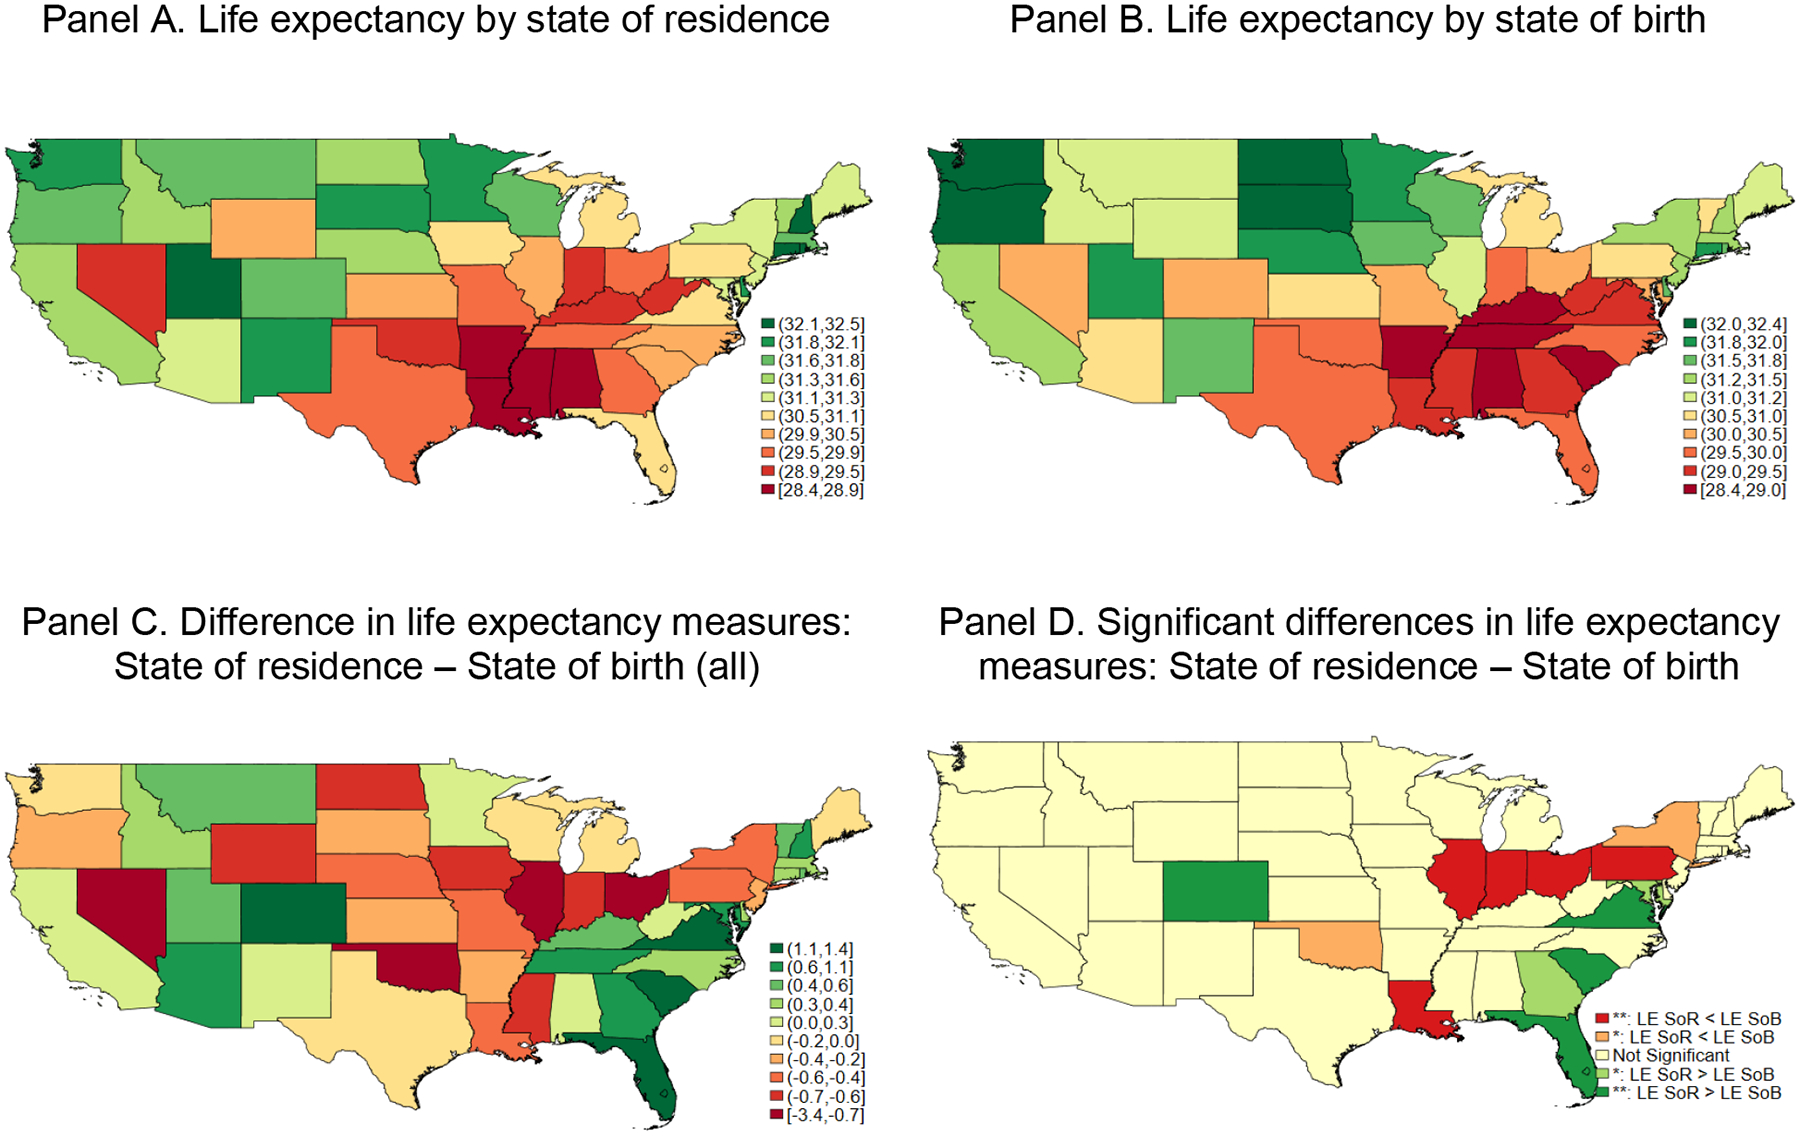
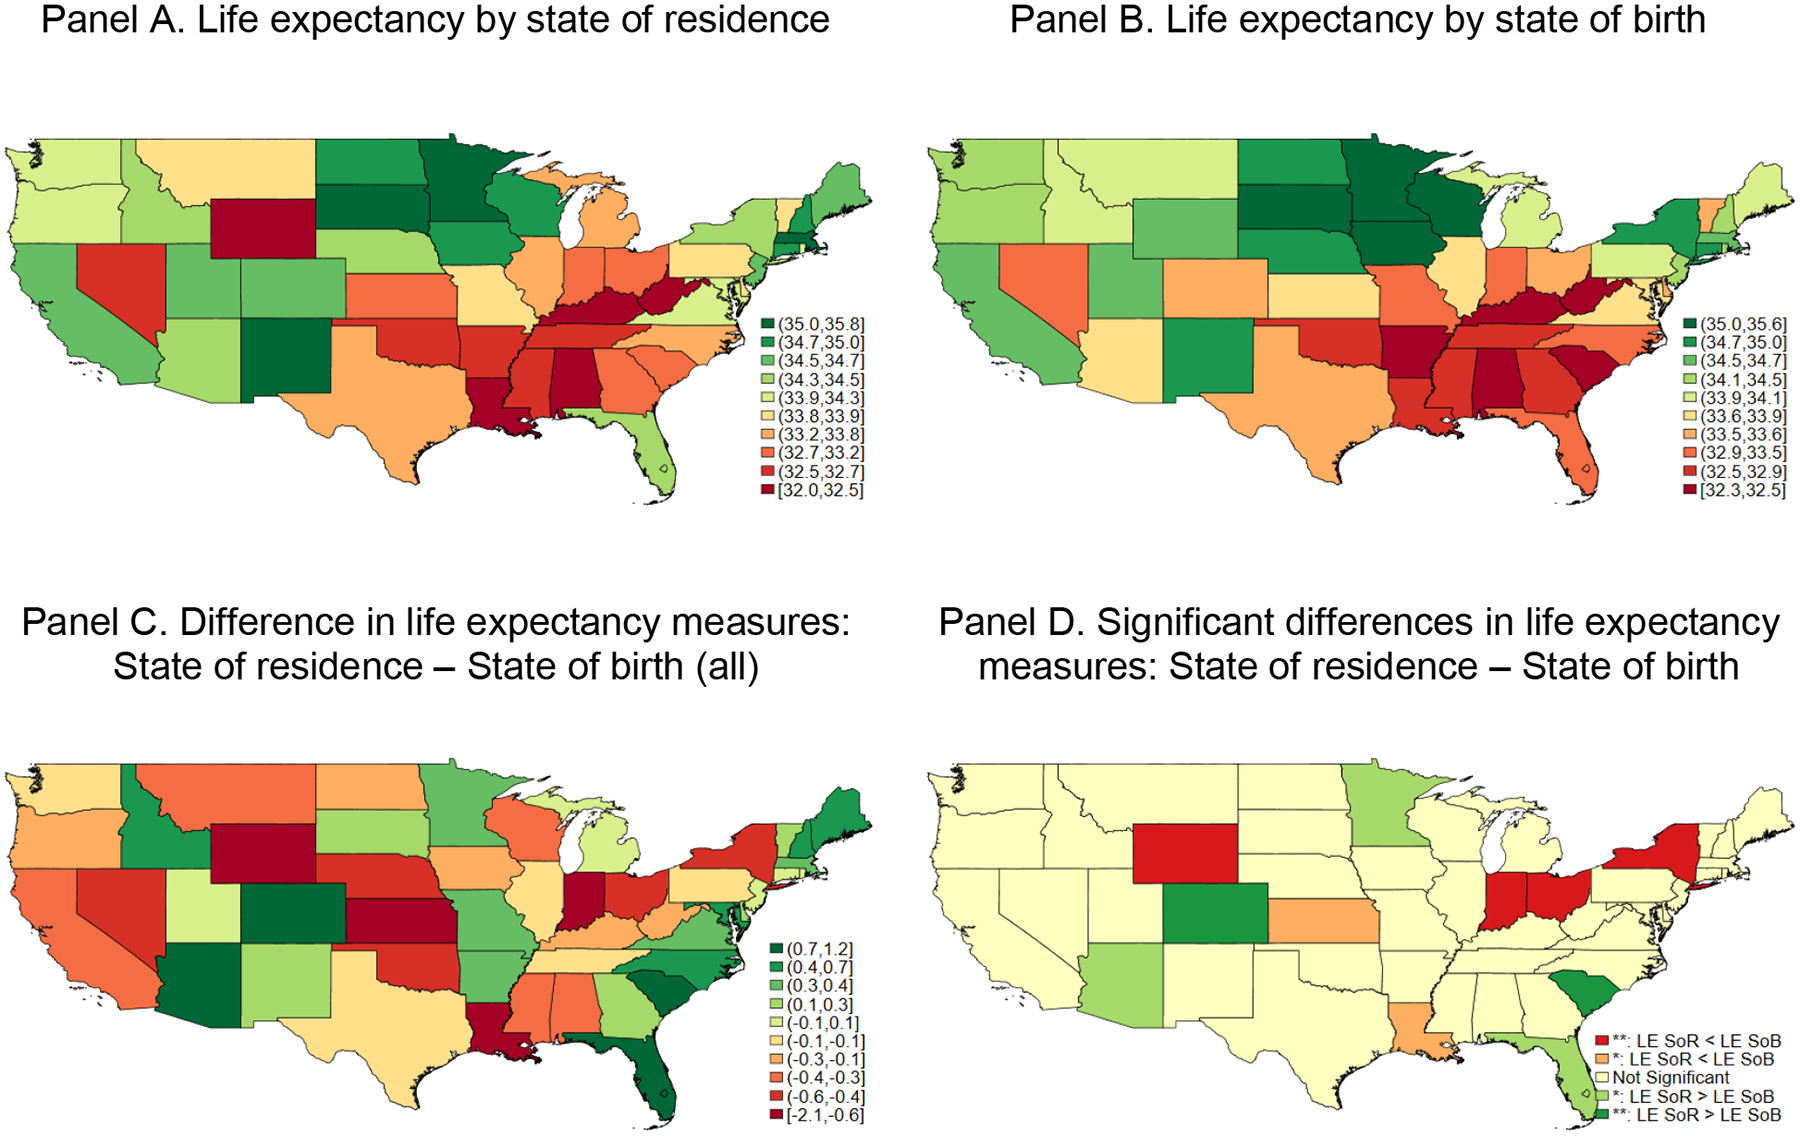
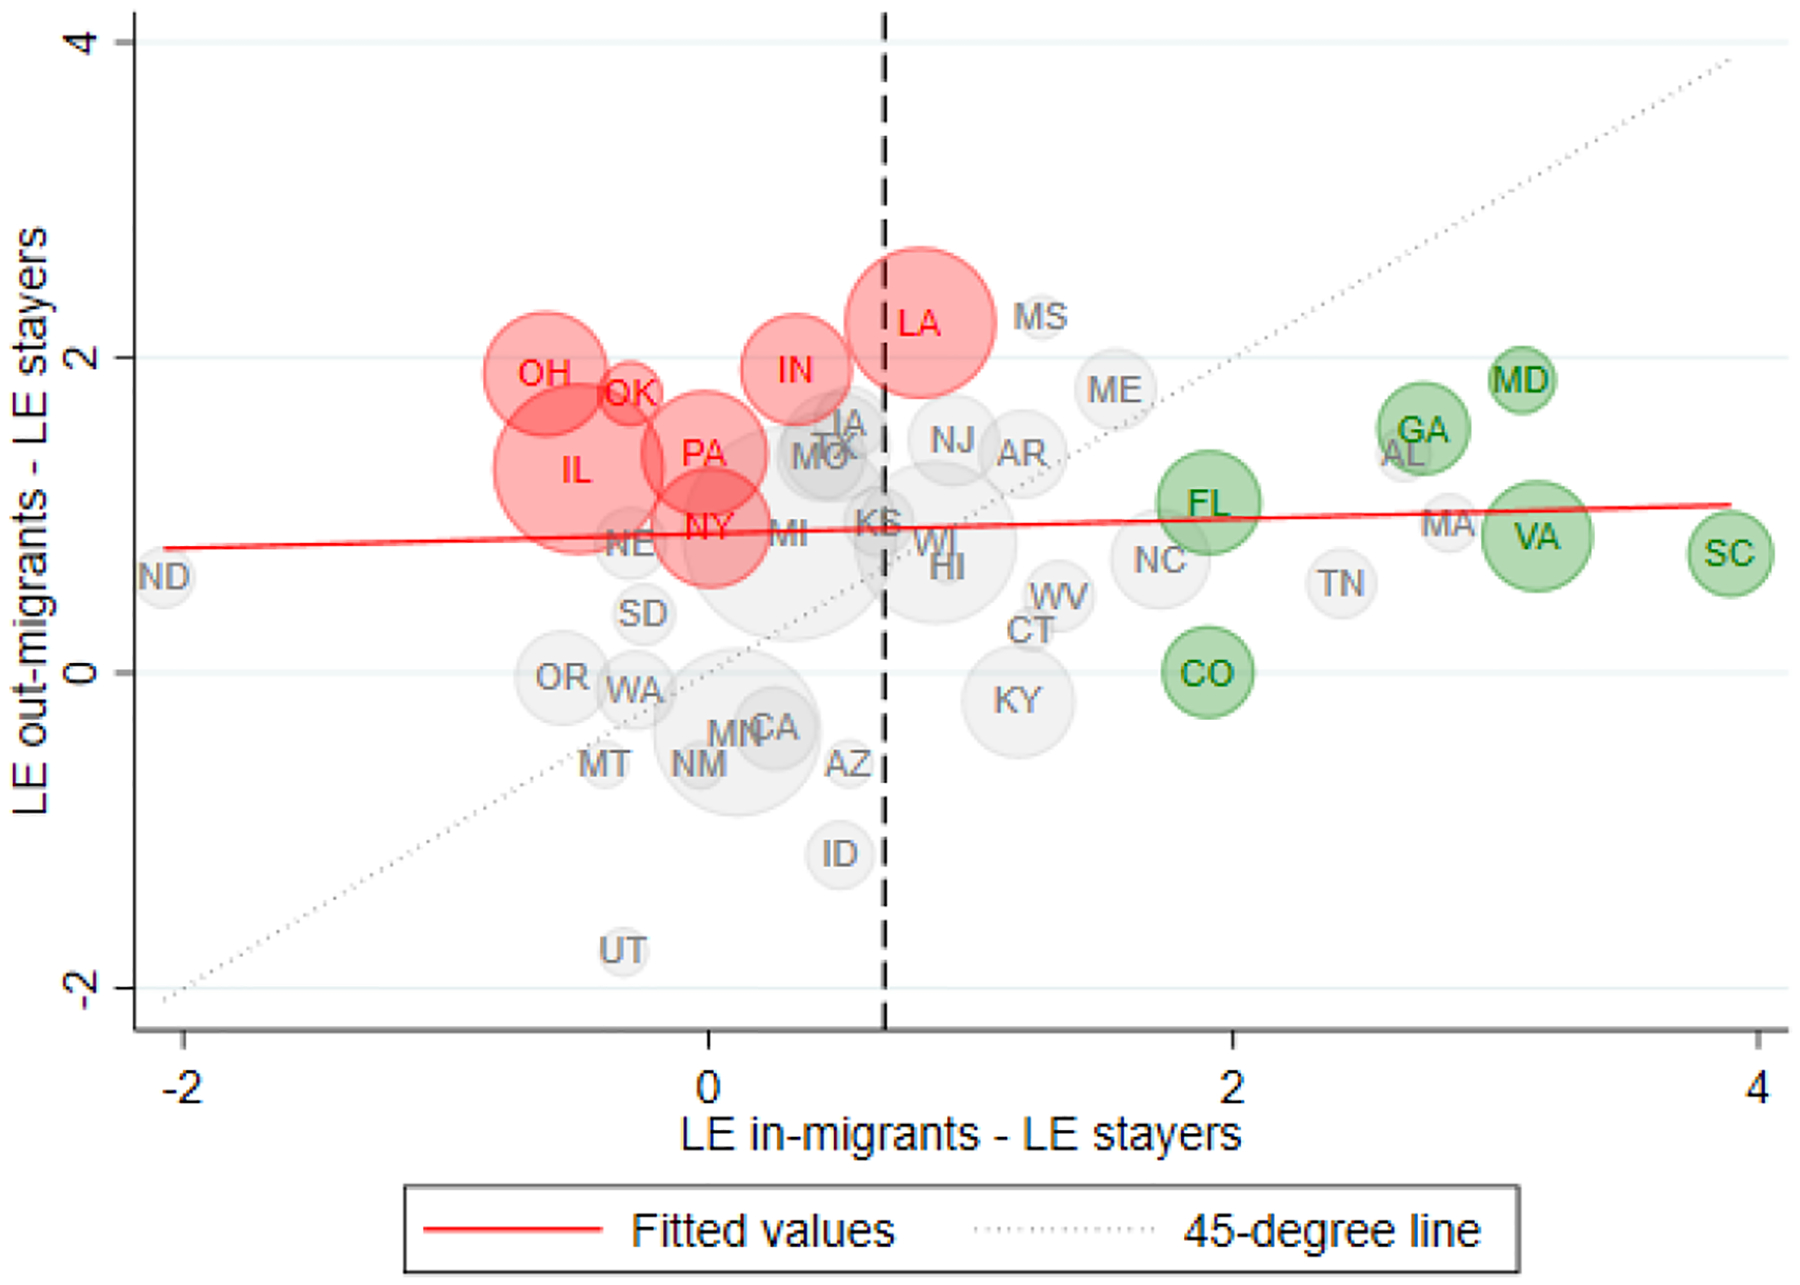
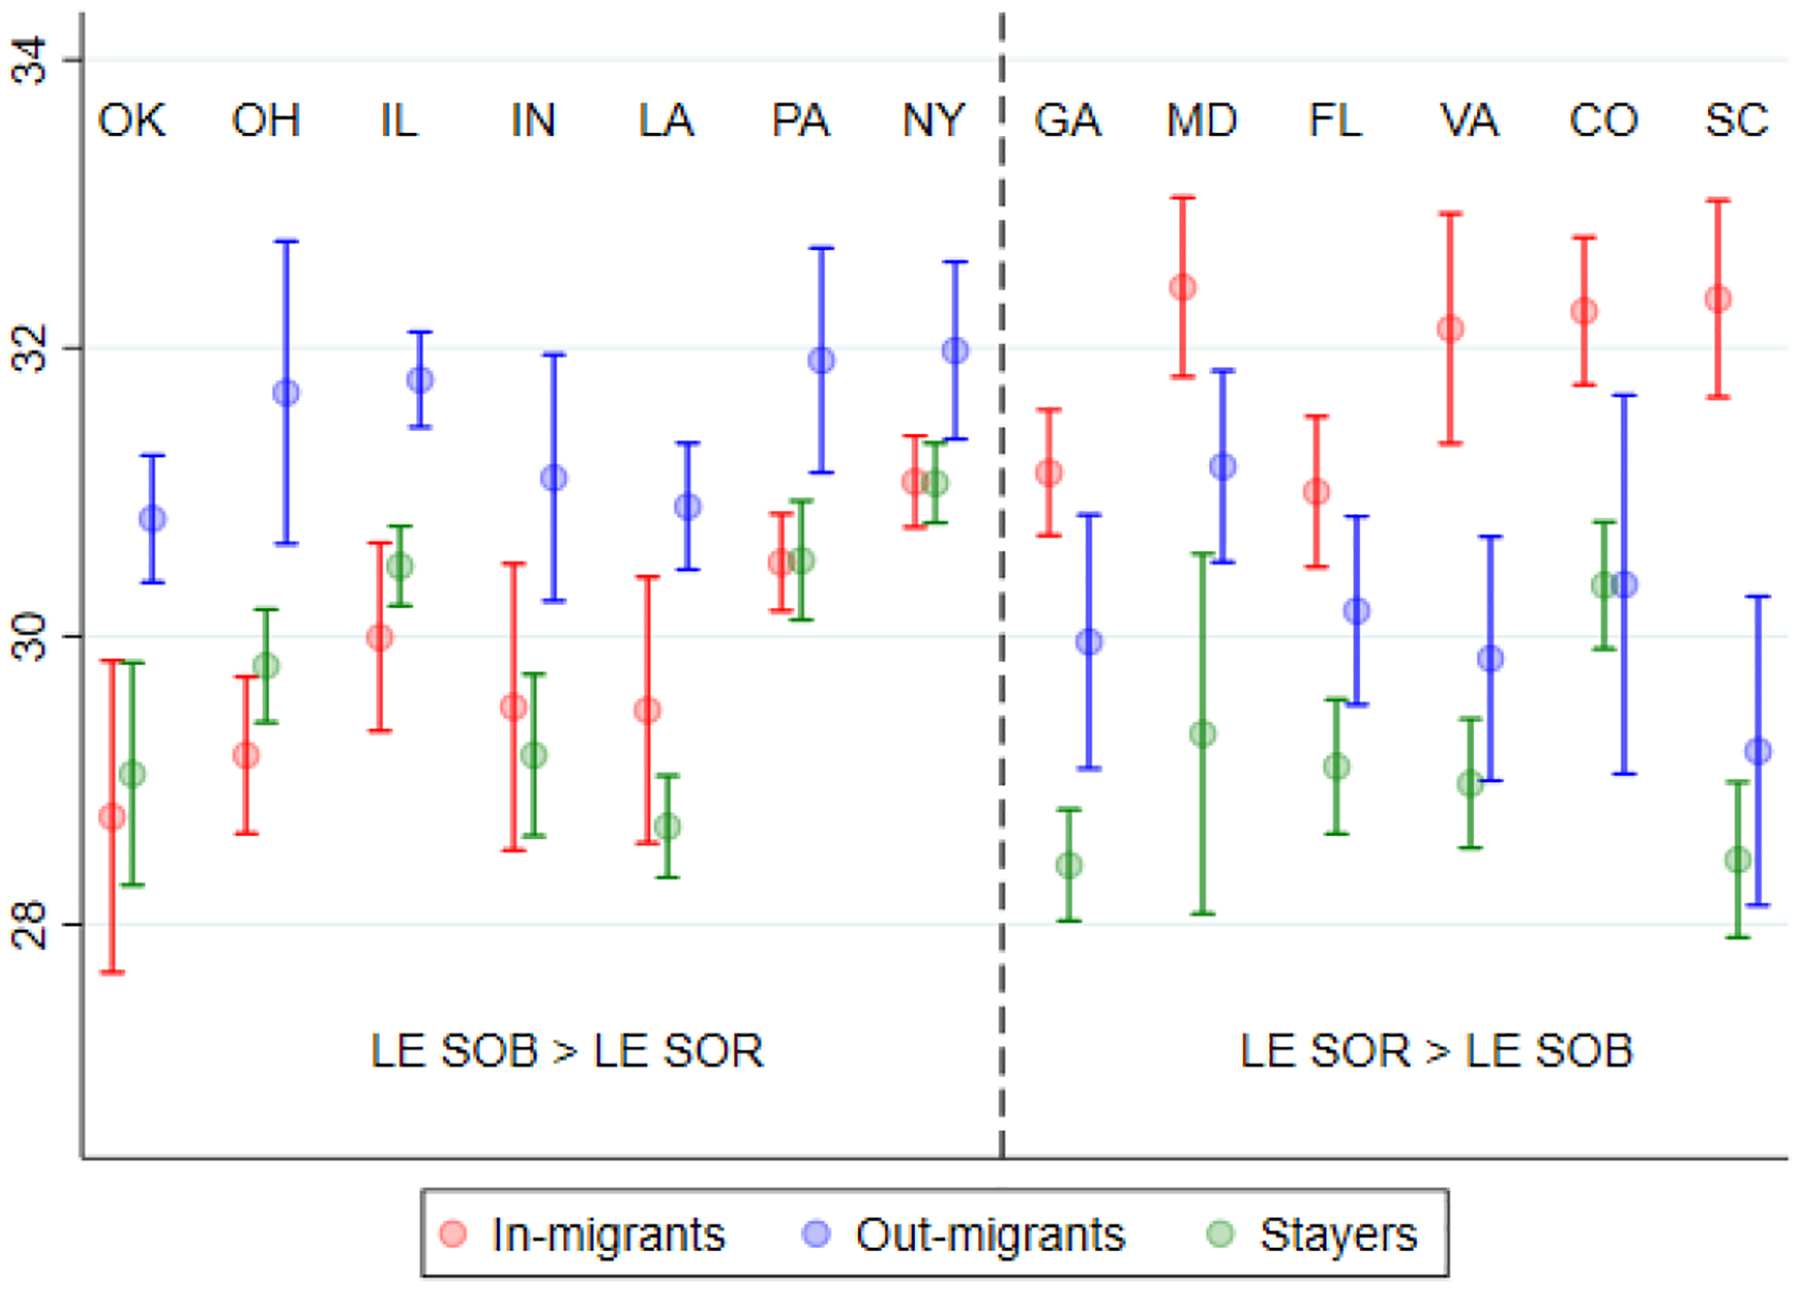
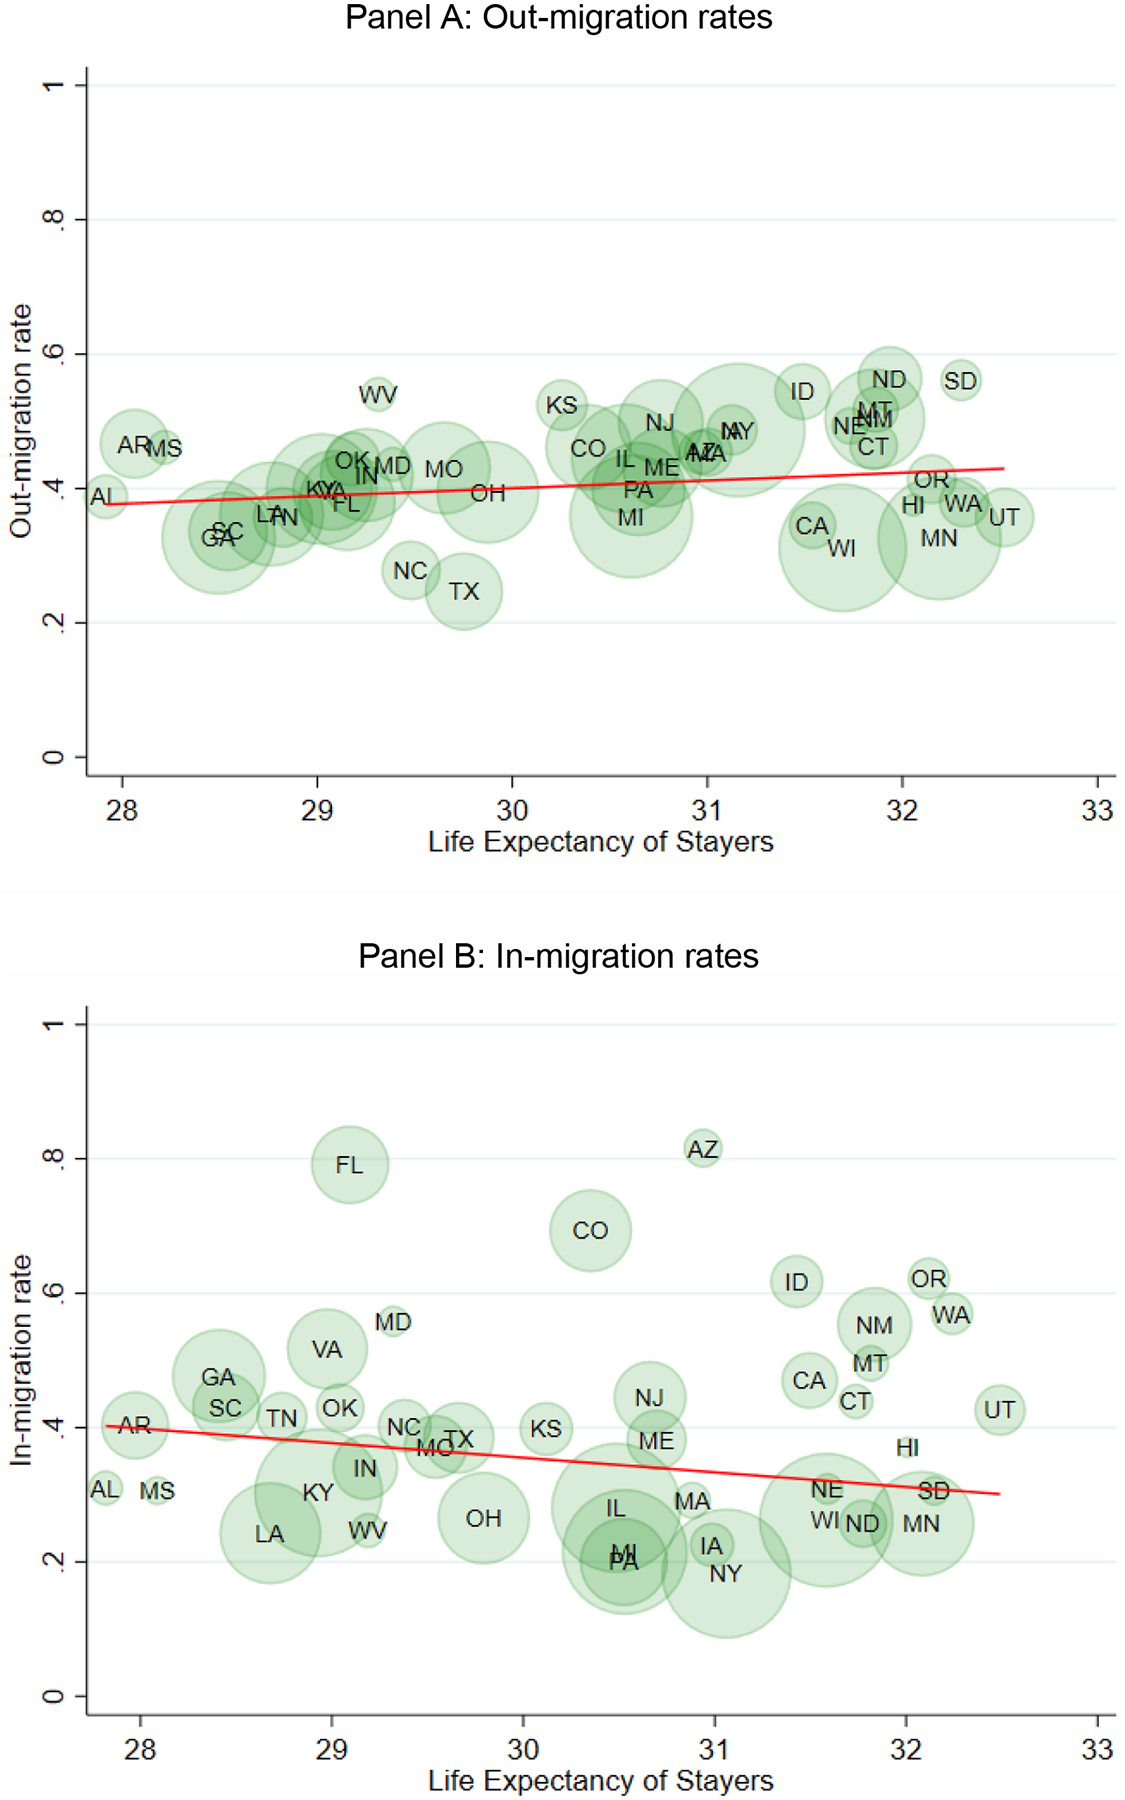
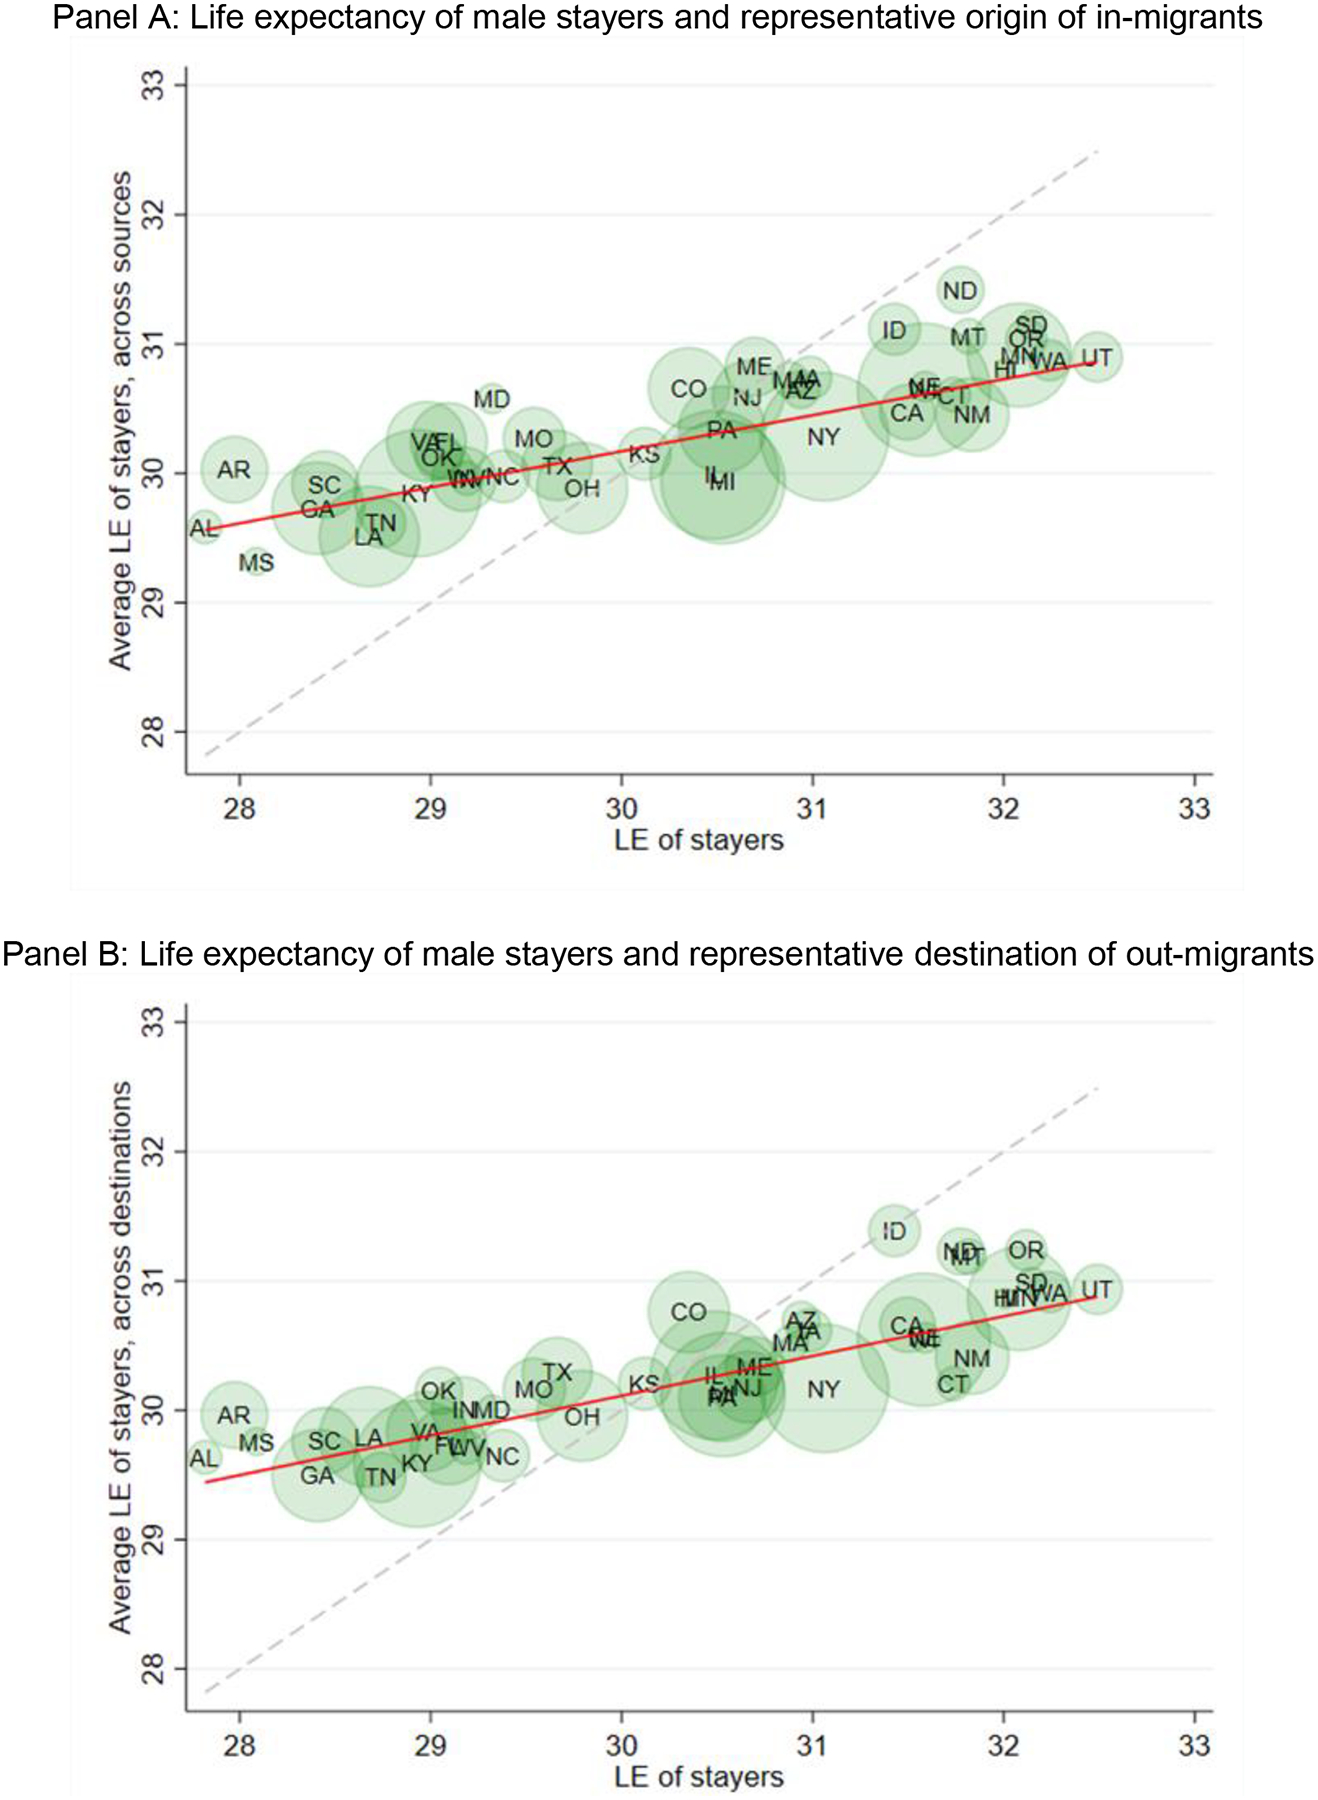
A rich literature shows that early-life conditions shape later-life outcomes, including health and migration events. However, analyses of geographic disparities in mortality outcomes focus almost exclusively on contemporaneously measured geographic place (e.g., state of residence at death), thereby potentially conflating the role of early-life conditions, migration patterns, and effects of destinations. We employ the newly available Mortality Disparities in American Communities data set, which links respondents in the 2008 American Community Survey to official death records, and estimate consequential differences based on the method of aggregation we use: the unweighted mean absolute deviation of the difference in life expectancy at age 50 measured by state of birth versus state of residence is 0.58 years for men and 0.40 years for women. These differences are also spatially clustered, and we show that regional inequality in life expectancy is higher based on life expectancies by state of birth, implying that interstate migration mitigates baseline geographic inequality in mortality outcomes. Finally, we assess how state-specific features of in-migration, out-migration, and nonmigration together shape measures of mortality disparities by state (of residence), further demonstrating the difficulty of clearly interpreting these widely used measures.

Keywords: Geographic disparities; Migration; Mortality; Place of birth.


Figures

Figure 1:
Figure 1:
Life expectancies at age 50 by state of birth and state of residence Note: Figure 1 shows the relationship between life expectancy at age 50 by state of birth and state of residence separately by gender. Life expectancies were constructed using data disclosed from the MDAC dataset with Census disclosure numbers CBDRB-FY19–304 and CBDRB-FY20–092, using the methods explained in the paper and further detailed in Technical Appendix A. Panel A shows the relationship between the two alternative measures of life expectancy at age 50 for men. Panel B shows the same relationship for women. States that have a significant difference between life expectancy measures at the 10% level are marked in black. The rest of the states are shown in gray.
Figure 2:
Figure 2:
Male life expectancies at age 50, 2008–2015 Note: Panel A of Figure 2 presents male life expectancies at age 50 grouping individuals by their state of residence in 2008, while Panel B of Figure 2 presents life expectancies at age 50 grouping individuals by their state of birth. Panel C of Figure 2 shows the differences between life expectancies by state of residence and life expectancies by state of birth for each of the states. Panel D of Figure 2 shows in red states in which the life expectancy by state of residence is significantly lower than the life expectancy by state of birth at the 5 and 10 percent significance levels. States in which the life expectancy by state of residence is significantly higher than the life expectancy by state of birth at the 5 and 10 significance levels are shown in green.
Figure 3:
Figure 3:
Female life expectancies at age 50, 2008–2015 Note: Panel A of Figure 3 presents female life expectancies at age 50 grouping individuals by their state of residence in 2008, while Panel B of Figure 3 presents life expectancies at age 50 grouping individuals by their state of birth. Panel C of Figure 3 shows the differences between life expectancies by state of residence and life expectancies by state of birth for each of the states. Panel D of Figure 3 shows in red states in which life expectancy by state of residence is significantly lower than life expectancy by state of birth at the 5 and 10 percent significance levels. States in which the life expectancy by state of residence is significantly higher than the life expectancy by state of birth at the 5 and 10 significance levels are shown in green.
Figure 4:
Figure 4:
Relationship between the relative mortality advantage of out-migrants and the relative mortality advantage of in-migrants across states Note: Figure 4 shows the difference in male life expectancy at age 50 of in-migrants relative to stayers on the horizontal axis and the difference in male life expectancy at age 50 of out-migrants relative to stayers on the vertical axis. States are weighted by the inverse variance of the difference between the life expectancy by state of residence and life expectancy by state of birth. States in green (red) have a male life expectancy at age 50 by state of residence that is significantly higher (lower) than the equivalent life expectancy by state of birth. The red dashed line corresponds to the fitted line of the weighted regression at the state level. The line in black corresponds to the weighted mean of the relative advantage of out-migrants (0.69 years).
Figure 5:
Figure 5:
Male life expectancies of stayers, movers-in, and movers-out at age 50 in selected states Note: Figure 5 shows the male life expectancy at age 50 for stayers, in-migrants, and out-migrants in the 13 states where the difference in life expectancy by state of residence and state of birth is statistically significant at conventional levels. Point estimates and 95% confidence intervals of the life expectancy of each type of individual in each state are also included.
Figure 6:
Figure 6:
Relationship between life expectancy of male stayers at age 50 and migration rates Note: Panel A (B) of Figure 6 shows the relationship between male life expectancy of the stayer sub-population at age 50 and out-migration (in-migration) rates at the state level. The out-migration rate of state s is calculated as the proportion of 50–64 year-old men that were born in state s that are out of their state of birth by the time of the 2008 ACS interview. Similarly, the in-migration rate of state s is calculated as the proportion of 50–64 year-old men that are observed in s by the time of the ACS interview that were born in a different state. In both panels, states are weighted by the inverse variance of the male life expectancy of stayers at age 50.
Figure 7:
Figure 7:
Relationship between male life expectancy of stayers at age 50 and representative origin / destination states Note: Panel A (B) of Figure 7 shows the relationship between the life expectancy of stayers and a measure that proxies for the place effect of the representative source (destination) of in-migrants (out-migrants). For more details on the construction of the proxies see the main text. In both panels, states are weighted by the inverse variance of the male life expectancy of stayers at age 50.

References

    1. Black DA, Sanders SG, Taylor EJ, & Taylor LJ (2015). The impact of the Great Migration on mortality of African Americans: Evidence from the Deep South. American Economic Review, 105(2), 477–503. - PMC - PubMed
    1. Boustan LP, Kahn ME, Rhode PW, & Yanguas ML (2020). The effect of natural disasters on economic activity in US counties: A century of data. Journal of Urban Economics, 118, 103257.
    1. Case A, & Deaton A (2015). Rising morbidity and mortality in midlife among white non-Hispanic Americans in the 21st century. Proceedings of the National Academy of Sciences, 112(49), 15078–15083. - PMC - PubMed
    1. Chetty R, Stepner M, Abraham S, Lin S, Scuderi B, Turner N, … & Cutler D (2016). The association between income and life expectancy in the United States, 2001–2014. Jama, 315(16), 1750–1766. - PMC - PubMed
    1. Chiang CL (1984). The life table and its applications (pp. 193–218). Malabar, FL: Krieger.

Publication types

LinkOut - more resources