. 2023 Mar 13:12:e85082.
doi: 10.7554/eLife.85082.

Evidence for embracing normative modeling

Affiliations

Evidence for embracing normative modeling

Saige Rutherford et al. Elife. .

Abstract

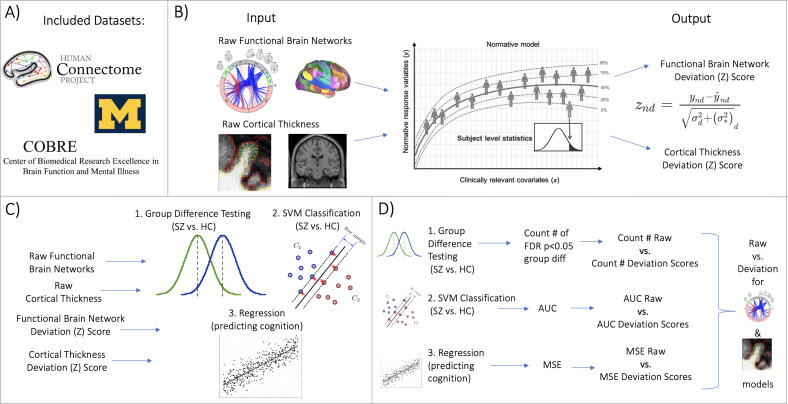
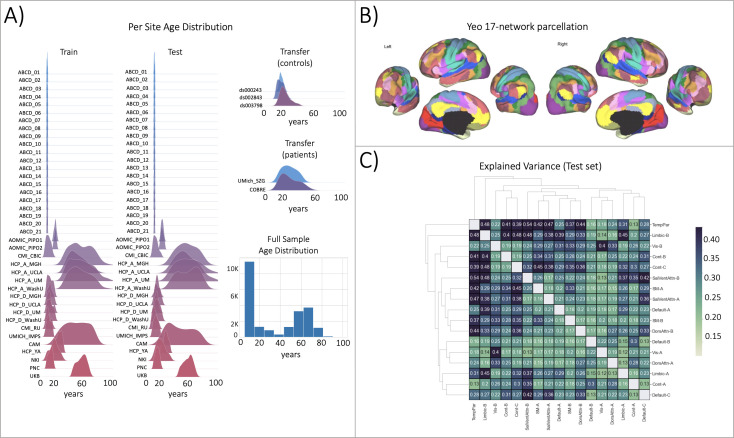
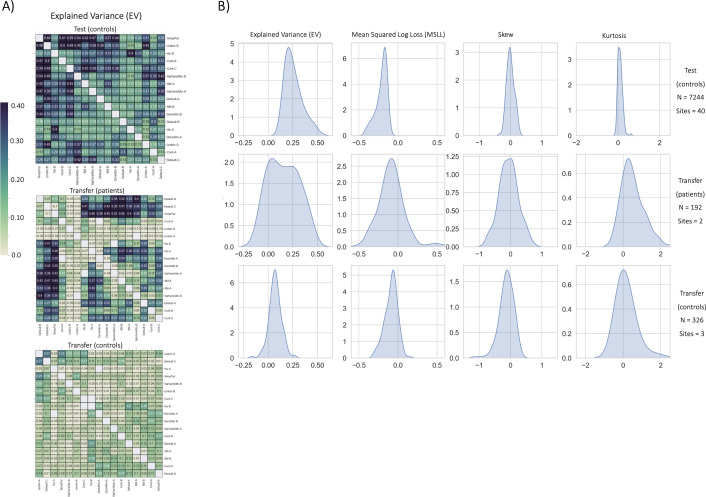
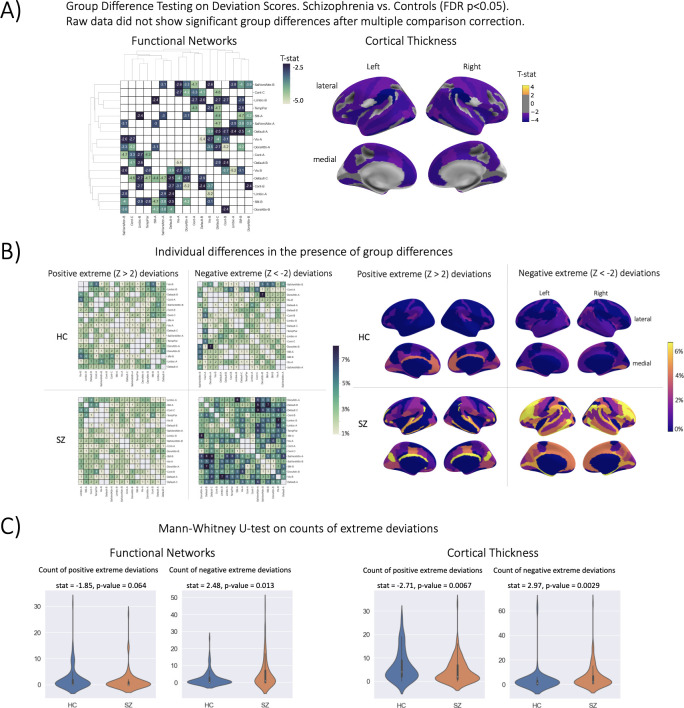
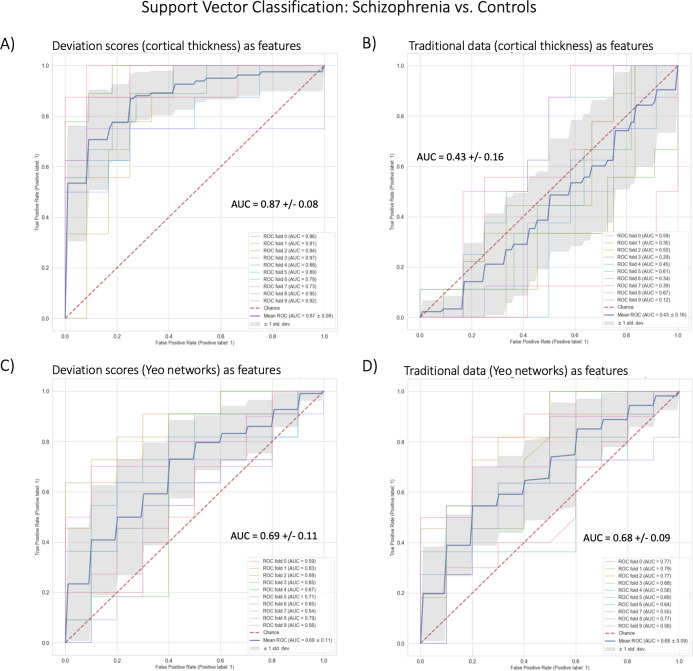
In this work, we expand the normative model repository introduced in Rutherford et al., 2022a to include normative models charting lifespan trajectories of structural surface area and brain functional connectivity, measured using two unique resting-state network atlases (Yeo-17 and Smith-10), and an updated online platform for transferring these models to new data sources. We showcase the value of these models with a head-to-head comparison between the features output by normative modeling and raw data features in several benchmarking tasks: mass univariate group difference testing (schizophrenia versus control), classification (schizophrenia versus control), and regression (predicting general cognitive ability). Across all benchmarks, we show the advantage of using normative modeling features, with the strongest statistically significant results demonstrated in the group difference testing and classification tasks. We intend for these accessible resources to facilitate the wider adoption of normative modeling across the neuroimaging community.

Keywords: brain charts; computational psychiatry; functional neuroimaging; heterogeneity; human; individual prediction; machine learning; neuroscience.


Conflict of interest statement

SR, PB, IT, CS, AM No competing interests declared, CB is director and shareholder of SBGNeuro Ltd, HR received speaker's honorarium from Lundbeck and Janssen

Figures

Figure 1.
Figure 1.. Overview of workflow.
(A) Datasets included the Human Connectome Project (young adult) study, the University of Michigan schizophrenia study, and the Center for Biomedical Research Excellence (COBRE) schizophrenia study. (B) Openly shared, pre-trained on big data, normative models were estimated for large-scale resting-state functional brain networks and cortical thickness. (C) Deviation (Z) scores and raw data, for both functional and structural data, were input into three benchmarking tasks: 1. group difference testing, 2. support vector machine (SVM) classification, and 3. regression (predicting cognition). (D) Evaluation metrics were calculated for each benchmarking task. These metrics were calculated for the raw data models and the deviation score models. The difference between each models’ performance was calculated for both functional and structural modalities.
Figure 2.
Figure 2.. Functional brain network normative modeling.
(A) Age distribution per scanning site in the train, test, and transfer data partitions and across the full sample (train +test). (B) The Yeo-17 brain network atlas is used to generate connectomes. Between network connectivity was calculated for all 17 networks, resulting in 136 unique network pairs that were each individually input into a functional normative model. (C) The explained variance in the controls test set (N=7244) of each of the unique 136 network pairs of the Yeo-17 atlas. Networks were clustered for visualization to show similar variance patterns.
Figure 3.
Figure 3.. Functional normative model evaluation metrics.
(A) Explained variance per network pair across the test set (top), and both transfer sets (patients – middle, controls – bottom). Networks were clustered for visualization to show similar variance patterns. (B) The distribution across all models of the evaluation metrics (columns) in the test set (top row) and both transfer sets (middle and bottom rows). Higher explained variance (closer to one), more negative MSLL, and normally distributed skew and kurtosis correspond to better model fit.
Figure 4.
Figure 4.. Group difference testing evaluation.
(A) Significant group differences in the deviation score models, (top left) functional brain network deviation, and (top right) cortical thickness deviation scores. The raw data, either cortical thickness or functional brain networks (residualized of sex and linear/ quadratic effects of age and motion (mean framewise displacement)) resulted in no significant group differences after multiple comparison corrections. Functional networks were clustered for visualization to show similar variance patterns. (B) There are still individual differences observed that do not overlap with the group difference map, showing the benefit of normative modeling, which can detect both group and individual differences through proper modeling of variation. Functional networks were clustered for visualization to show similar variance patterns. (C) There are significant group differences in the summaries (count) of the individual difference maps (panel B).
Figure 5.
Figure 5.. Benchmark task two multivariate prediction Classification evaluation.
(A) Support vector classification (SVC) using cortical thickness deviation scores as input features (most accurate model). (B) SVC using cortical thickness (residualized of sex and linear/quadratic effects of age) as input features. (C) SVC using functional brain network deviation scores as input features. (D) SVC using functional brain networks (residualized of sex and linear/ quadratic effects of age and motion (mean framewise displacement)) as input features.

Update of

  • doi: 10.1101/2022.11.14.516460

References

    1. Aine CJ, Bockholt HJ, Bustillo JR, Cañive JM, Caprihan A, Gasparovic C, Hanlon FM, Houck JM, Jung RE, Lauriello J, Liu J, Mayer AR, Perrone-Bizzozero NI, Posse S, Stephen JM, Turner JA, Clark VP, Calhoun VD. Multimodal neuroimaging in schizophrenia: description and dissemination. Neuroinformatics. 2017;15:343–364. doi: 10.1007/s12021-017-9338-9. - DOI - PMC - PubMed
    1. Arbabshirani MR, Kiehl KA, Pearlson GD, Calhoun VD. Classification of schizophrenia patients based on resting-state functional network connectivity. Frontiers in Neuroscience. 2013;7:133. doi: 10.3389/fnins.2013.00133. - DOI - PMC - PubMed
    1. Baker JT, Dillon DG, Patrick LM, Roffman JL, Brady RO, Pizzagalli DA, Öngür D, Holmes AJ. Functional connectomics of affective and psychotic pathology. PNAS. 2019;116:9050–9059. doi: 10.1073/pnas.1820780116. - DOI - PMC - PubMed
    1. Baron J. In: Blackwell Handbook of Judgment and Decision Making. Koehler DJ, Harvey N, editors. Blackwell Publishing Ltd; 2004. Normative models of judgment and decision making; pp. 19–36. - DOI
    1. Benkarim O, Paquola C, Park BY, Kebets V, Hong SJ, Vos de Wael R, Zhang S, Yeo BTT, Eickenberg M, Ge T, Poline JB, Bernhardt BC, Bzdok D. Population heterogeneity in clinical cohorts affects the predictive accuracy of brain imaging. PLOS Biology. 2022;20:e3001627. doi: 10.1371/journal.pbio.3001627. - DOI - PMC - PubMed

Publication types