. 2023 Mar 13:12:e79271.
doi: 10.7554/eLife.79271.

Mechanosensitive pore opening of a prokaryotic voltage-gated sodium channel

Affiliations

Mechanosensitive pore opening of a prokaryotic voltage-gated sodium channel

Peter R Strege et al. Elife. .

Abstract

Voltage-gated ion channels (VGICs) orchestrate electrical activities that drive mechanical functions in contractile tissues such as the heart and gut. In turn, contractions change membrane tension and impact ion channels. VGICs are mechanosensitive, but the mechanisms of mechanosensitivity remain poorly understood. Here, we leverage the relative simplicity of NaChBac, a prokaryotic voltage-gated sodium channel from Bacillus halodurans, to investigate mechanosensitivity. In whole-cell experiments on heterologously transfected HEK293 cells, shear stress reversibly altered the kinetic properties of NaChBac and increased its maximum current, comparably to the mechanosensitive eukaryotic sodium channel NaV1.5. In single-channel experiments, patch suction reversibly increased the open probability of a NaChBac mutant with inactivation removed. A simple kinetic mechanism featuring a mechanosensitive pore opening transition explained the overall response to force, whereas an alternative model with mechanosensitive voltage sensor activation diverged from the data. Structural analysis of NaChBac identified a large displacement of the hinged intracellular gate, and mutagenesis near the hinge diminished NaChBac mechanosensitivity, further supporting the proposed mechanism. Our results suggest that NaChBac is overall mechanosensitive due to the mechanosensitivity of a voltage-insensitive gating step associated with the pore opening. This mechanism may apply to eukaryotic VGICs, including NaV1.5.

Keywords: cell biology; electrophysiology; mechanosensitivity; molecular biophysics; patch-clamp; sodium channel; structural biology.


Conflict of interest statement

PS, LC, CA, AM, CA, LM, GF, AB No competing interests declared

Figures

Figure 1.
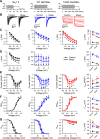
Figure 1.. Shear stress increases the peak Na+ current of eukaryotic NaV1.5 and prokaryotic NaV channel NaChBac.
(A) Topologies of eukaryotic NaV channel NaV1.5 (black) and prokaryotic NaV channel NaChBac, without (WT, blue) or with (T220A, red) point mutation T220A, which makes NaChBac devoid of inactivation. (B) Representative Na+ currents were elicited by a depolarization from –120 mV to –40 mV of NaV1.5 (black), WT NaChBac (blue), or T220A NaChBac (red), before (—) or during (▬) shear stress. (C) Difference currents were obtained by subtracting the control trace from the shear trace in (B). (D) Voltage-dependent conductance normalized to the maximum conductance of controls (G/GMax,Control) for NaV1.5 (black), WT NaChBac (blue) or T220A NaChBac (red), before (—) or during (▬) shear stress (n=7–10 cells; p<0.05 by a paired two-tailed t-test when comparing shear to control at voltages >−70 mV for NaV1.5, >−60 mV for WT and >−80 mV for T220A).
Figure 1—figure supplement 1.
Figure 1—figure supplement 1.. Shear stress increases peak Na+ current, hyperpolarizes the voltage of half-activation, and accelerates the kinetics of eukaryotic and prokaryotic NaV channels in HEK293 cells.
(A–B) Voltage protocols (A) elicited currents (B) from NaV1.5 and WT or T220A NaChBac channels transiently expressed in HEK293 cells. Currents were recorded before (control) or during (shear) flow of bath (extracellular) solution through the recording chamber at a rate of 10 mL/min. (C–D) Time constants of activation (C, τa) or inactivation (D, τi) versus step voltage, before (●) or during (○) shear stress. (E) Current density-voltage relationship of peak Na+ currents before (●) or during (○) shear stress. (F–G) Half-point of steady-state activation (F) and availability (G), recorded before (●) or during (○) shear stress. Far-right column, mean parameters for the time constants of activation (C, τa) or inactivation (D, τi) at –30 mV, the maximum peak Na+ current (E, IPeak), the half-point of steady-state activation (F, V1/2a), and the half-point of steady-state availability (G, V1/2i), recorded from paired controls (Control) or with shear stress (Shear). Voltage clamp data were recorded from n=7–10 cells each; *p<0.05 to control or †p<0.05 to NaV1.5 by two-way ANOVAs with Dunnett’s post-test.
Figure 2.
Figure 2.. Patch pressure increases the open channel probability of T220A NaChBac single channels in P1KO cells.
(A) Representative traces of single T220A NaChBac channels at −80, –60, –40, or –20 mV and with 0 (unshaded) or –10 mmHg (shaded region) applied to the patch. (B) All-point histograms constructed from the traces shown in (A) at −80, –60, or –20 mV and 0 (black) or –10 mmHg (red) binned every 0.2 pA. Bins were normalized to an area of 1 and fit with a sum of two Gaussians, in which open events at –60 mV were 0.77 pA and 0.17 PO without pressure and 0.75 pA and 0.72 PO (330% increase) with pressure; open events at –20 mV were 0.43 pA and 0.90 PO without pressure and 0.42 pA and 0.90 PO (0% increase) with pressure. (C) Mean open probabilities (PO) at voltage steps from –100 to –20 mV with 0 (black) or –10 to –50 mmHg (red gradient) pressure (n=7–21 cells per voltage; *p<0.05, control vs. pressure by a paired two-tailed t-test). (D) PO per voltage from (C), re-plotted vs. pressure (0 to –50 mmHg).
Figure 2—figure supplement 1.
Figure 2—figure supplement 1.. Endogenous channels in Piezo1-KO HEK (P1KO) cells are insensitive to pressure stimulus.
(A) Single channel activity from an untransfected P1KO cell before or during (shaded area) application of pressure by high-speed pressure clamp (HSPC). (B) All-sample distribution curves generated from all traces recorded from the cell represented in (A), at +60 mV and with 0 (black) or –30 mmHg pressure stimulus (red). (C) Voltage- and pressure-clamp protocols to test the pressure sensitivity of single channel currents to –30 mmHg at voltage steps from –60 through +100 mV. (D) Single channel currents averaged from 60 sweeps of the protocol shown in (C) —a holding voltage of –100 mV to steps from –50 to +100 mV with 0 (control) or –30 mmHg (pressure) applied to the patch. (E) Difference current obtained by subtracting pressure from control currents in (D) (IDifference = IControl – IPressure). (F) Current-voltage (I–V) relationship from control (black symbols), pressure (red), or difference (white) currents at the plateau, as shown in (D–E). (Inset) Enlargement of currents from –60 to 0 mV. (G) Noise spectrum averaged from 25 ten-second traces without (black) or with (red) the high-speed pressure clamp (HSPC) connected to the patch-clamp head stage. Vertical gray lines indicate multiples of 60 Hz. Noise exclusive to HSPC ≈ 1.7 kHz.
Figure 3.
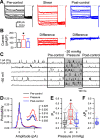
Figure 3.. Mechano-sensitive increase in whole-cell peak currents and single-channel open probability of T220A NaChBac is reversible.
(A) Representative whole-cell currents from HEK cells expressing T220A NaChBac were elicited by a voltage protocol (Figure 1—figure supplement 1A) before (black), during (red), or after (blue) shear stress. (B) Peak current densities before (black), during (red), or after (blue) shear stress (n=5 cells, *p<0.05 to pre-control by a one-way ANOVA with Dunnett’s post-test). (C) Representative single channel activity at –60 mV from Piezo1-knockout HEK cells transfected with T220A NaChBac, before (unshaded), during (shaded region), or after application of –30 mmHg to the patch for 500 ms. (D) All-sample distributions of single channel activity from the cell shown in (C), binned every 0.05 pA with peaks at 0 pA (closed) and ~0.9 pA (open). (E) Mean open channel probability (PO) per cell (gray circles) before (black), during (red), or after (blue) application of –30 mmHg pressure. (F) Differences in post-pressure PO (∆PO) from pre-pressure controls.
Figure 3—figure supplement 1.
Figure 3—figure supplement 1.. Effect of pressure on voltage-dependent open probability.
(A) Protocols to test the reversibility of pressure-dependent increases in PO. (B) Current traces averaged from idealized single channel events in 4–17 cells at voltage steps from –100 to –20 mV, before (black), during (red), or after (blue) the pressure step to –30 mmHg. Shaded areas represent the difference in average PO with pressure versus each pre-control baseline. (C) Single channel open probability versus voltage. (D) Differences in open probability (∆PO), subtracting the open probability before pressure from either pressure (red) or post-control (blue).
Figure 3—figure supplement 2.
Figure 3—figure supplement 2.. Shear-sensitive increase in whole-cell peak currents of NaV1.5 is reversible.
(A) Representative whole-cell Na+ current traces elicited by a voltage step from –120 to –30 mV before (black, pre-control), during (red, shear), or 2–5 min after shear stress (1.1 dyn/cm2). (B) Difference currents were obtained by subtracting the pre-control recording from either the shear (left, red traces) or the post-control recordings (right, blue traces). Na+ currents were elicited by voltage steps from –120 to –100 through 0 mV. (C) Voltage-dependent conductance of post-control currents, normalized to the maximum conductance of pre-controls (G/GMax,Control) (n=24 cells). Lower or upper boundaries of the shaded area represent the G/GMax of pre-control currents or currents during shear, respectively. (D) Maximum conductance (GMax) of Na+ currents before (black), during (red), or 2–5 min after shear stress (n=24 cells; *p<0.01, shear vs. pre-control and p>0.05, post-control vs. pre-control by paired two-tailed t-tests). (E) Difference in maximum conductance (∆GMax) of post-control Na+ currents, normalized to pre-controls.
Figure 4.
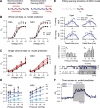
Figure 4.. Pressure destabilizes the T220A NaChBac closed state.
(A) Mechanosensitive activation (MSA) depicts a model in which the C1 to C5 closed state transitions are both voltage- and pressure-dependent (blue and red); mechanosensitive opening (MSO) depicts a model in which the C1 to C5 closed state transitions are voltage-dependent (blue), and the C5 closed to O6 open state transition is pressure-dependent (red). The predictions of these two models to voltage and pressure stimuli are shown in (B–D), with kinetic parameters as described in Materials and Methods. (B) MSA (left) and MSO (right) model predictions of open probability (PO) across voltages from –110 to –30 mV with 0 (black) or –28 mmHg applied pressure (dark red), compared to G/GMax whole-cell data (Figure 1D) with 0 (●) or 10 mL/min (○) fluid shear stress. (C–D) MSA (left) and MSO (right) model predictions of single channel PO (●) plotted versus voltage (C) at pressures from 0 to –50 mmHg (red gradient) or versus pressure (D) at voltages from –100 to –20 mV (blue gradient). (E) MSO model adapted fit to a single pressure-sensitive C5 to O6 transition with pressure-dependent kinetic constants assigned for opening (kO) and closing (kC). Insets: top, open (left), and closed (right) dwell time histograms of single channel data (black) vs. the MSO model PDF curves (blue), under 0 mmHg (top row) or –50 mmHg pressure (bottom row), with vertical dotted lines indicating the inverse of the time constants; middle, bar graphs depicting the change in the time constants kC (left) or kO (right) with –10 or –50 mmHg pressure; bottom, single channel trace recorded at –20 mV (black) and idealization (blue) with –10 mmHg applied to the region shaded (gray), compared to a trace simulated with the MSO model. *p<0.05 to 0 mmHg by unpaired two-tailed t-tests using the raw values of the time constants. (F) MSA (dotted blue line) and MSO (solid blue line) model prediction of single channel PO at –60 mV before, during, and after pressure, compared to the average current from single channel data (black).
Figure 5.
Figure 5.. I228G disrupts the pressure sensitivity of NaChBac background T220A.
(A) Conformational change of prokaryotic Na+ channels from the closed (cyan, NaVAb, 2017) to open state (magenta, NaVMs, 2017), illustrating the movement of the voltage sensor, S4-S5 linker, S6 segment, and C-terminal tail in relation to the lipid bilayer. (B) Location of key residues T220A and I228 in the S6 pore segment and D93 in the voltage sensor. (C–D) Voltage-dependent open probabilities ((D), PO) of single channel activities (C) recorded at the indicated voltages with 0 or –10 mmHg pressure from P1KO cells expressing the T220A NaChBac background (red or gray shading) or with additional mutations D93A (blue) or I228G (indigo). (*p<0.05, –10 mmHg vs. 0 mmHg by paired two-tailed t-tests, n=338–636 traces per voltage from 6 to 12 cells). Half-points of open probability (0 to –10 mmHg): T220A, –45.6 to –58.1 mV; D93A, –65.1 to –72.3 mV; I228G, –46.2 to –48.0 mV. (E) Difference in open probability induced by –10 mmHg pressure (PO(–10)–PO(0)) as a function of voltage in the control background (red or gray shading) or with D93A (blue) or I228G (indigo) (*p<0.05, D93A or I228G to T220A background by unpaired two-tailed t-tests).
Figure 5—figure supplement 1.
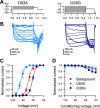
Figure 5—figure supplement 1.. Whole-cell voltage-dependent Na+ currents elicited from P1KO cells transfected with NaChBac mutants D93A or I228G in the T220A background.
(A) Voltage stimulus protocol to elicit whole-cell Na+ currents by holding the cell at –170 (D93A) or –120 mV (I228G), then stepping to a voltage ladder from –120 through –60 (D93A) or through 0 mV (I228G) for 1 s, then to a single voltage at –80 mV for 200 ms (D93A) or –50 mV for 400 ms (I228G). (B) Whole-cell Na+ currents elicited by the voltage protocols shown in (A). (C) Steady-state activation curves versus the voltage of step one for the T220A background (red) or the mutants D93A (blue) or I228G (indigo). (C) Steady-state availability (inactivation) currents at step two vs. the conditioning voltage of step one for background (red) or mutant D93A (blue) or I228G (indigo) channels (n=8 (T220A), 3 (D93A), or 11 (I228G) transfected P1KO cells).
Figure 5—figure supplement 2.
Figure 5—figure supplement 2.. Effect of pressure on I228G single channel open probability and macroscopic patch currents.
(A) Differences in open probability (∆PO) of the T220A background (left) or I228G (right), were calculated by subtracting the open probability (PO) at 0 mmHg from the PO with −10, –30, or –50 mmHg pressure. (B) Macroscopic current traces of T220A (red) and I228G (blue) elicited by voltage steps to −70, –60, and –50 mV and with –30 mmHg, compared to currents at 0 mmHg pressure (gray). (C) Current-voltage plots of T220A (red) and I228G (blue) at –30 mmHg vs. 0 mmHg controls (gray) (T220A, n=10 cells, *p<0.05, 0 to –30 mmHg; I228G, n=7 cells, p>0.05, 0 to –30 mmHg by paired two-tailed t-tests).
Figure 6.
Figure 6.. Model of voltage-gated ion channel (VGIC) mechanosensitivity.
(A) VGIC pore is embedded in the lipid bilayer, which has an intrinsic distribution of mechanical forces even with no tension added to the system. (B) Mechanical stress applied to the bilayer alters the profile of bilayer forces, which destabilizes the intracellular gate and leads to intracellular pore expansion.
Author response image 1.

Update of

  • doi: 10.1101/2022.05.10.491345

References

    1. Aldrich RW, Corey DP, Stevens CF. A reinterpretation of mammalian sodium channel gating based on single channel recording. Nature. 1983;306:436–441. doi: 10.1038/306436a0. - DOI - PubMed
    1. Anishkin A, Loukin SH, Teng J, Kung C. Feeling the hidden mechanical forces in lipid bilayer is an original sense. PNAS. 2014;111:7898–7905. doi: 10.1073/pnas.1313364111. - DOI - PMC - PubMed
    1. Bagnéris C, DeCaen PG, Naylor CE, Pryde DC, Nobeli I, Clapham DE, Wallace BA. Prokaryotic navms channel as a structural and functional model for eukaryotic sodium channel antagonism. PNAS. 2014;111:8428–8433. doi: 10.1073/pnas.1406855111. - DOI - PMC - PubMed
    1. Banderali U, Juranka PF, Clark RB, Giles WR, Morris CE. Impaired stretch modulation in potentially lethal cardiac sodium channel mutants. Channels. 2010;4:12–21. doi: 10.4161/chan.4.1.10260. - DOI - PubMed
    1. Benndorf K. Properties of single cardiac Na channels at 35 degrees C. The Journal of General Physiology. 1994;104:801–820. doi: 10.1085/jgp.104.5.801. - DOI - PMC - PubMed

Publication types

Substances