. 2023 Jun;66(6):1097-1115.
doi: 10.1007/s00125-023-05896-6. Epub 2023 Mar 13.

Methylation of histone H3 lysine 4 is required for maintenance of beta cell function in adult mice

Affiliations

Methylation of histone H3 lysine 4 is required for maintenance of beta cell function in adult mice

Ben Vanderkruk et al. Diabetologia. 2023 Jun.

Abstract

Aims/hypothesis: Beta cells control glucose homeostasis via regulated production and secretion of insulin. This function arises from a highly specialised gene expression programme that is established during development and then sustained, with limited flexibility, in terminally differentiated cells. Dysregulation of this programme is seen in type 2 diabetes but mechanisms that preserve gene expression or underlie its dysregulation in mature cells are not well resolved. This study investigated whether methylation of histone H3 lysine 4 (H3K4), a marker of gene promoters with unresolved functional importance, is necessary for the maintenance of mature beta cell function.

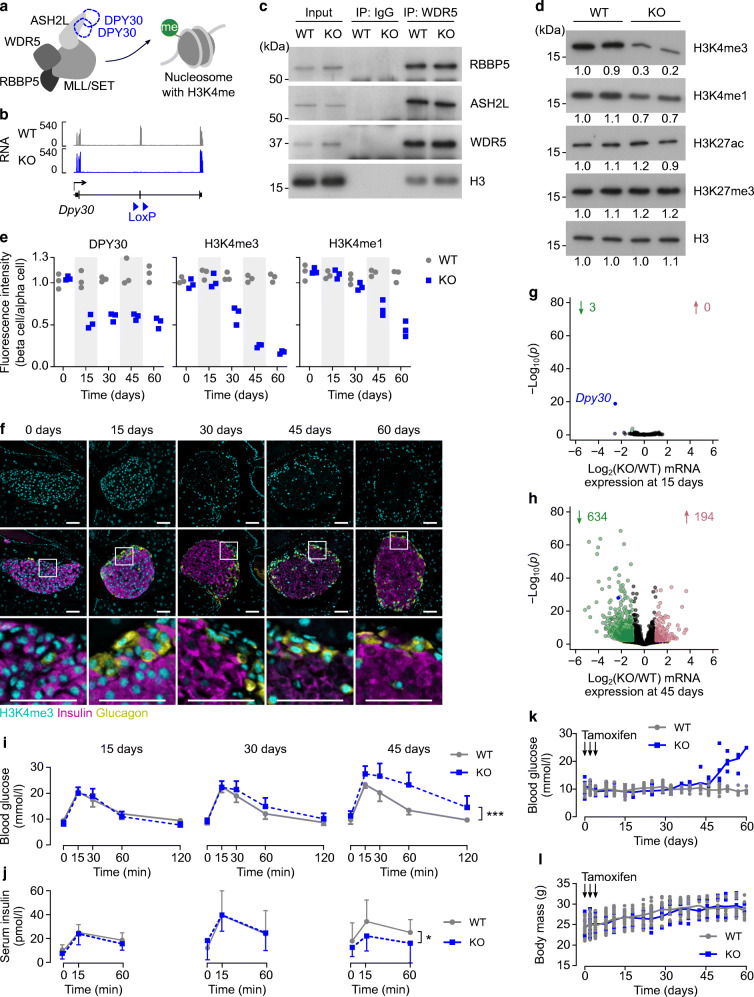
Methods: Beta cell function, gene expression and chromatin modifications were analysed in conditional Dpy30 knockout mice, in which H3K4 methyltransferase activity is impaired, and in a mouse model of diabetes.

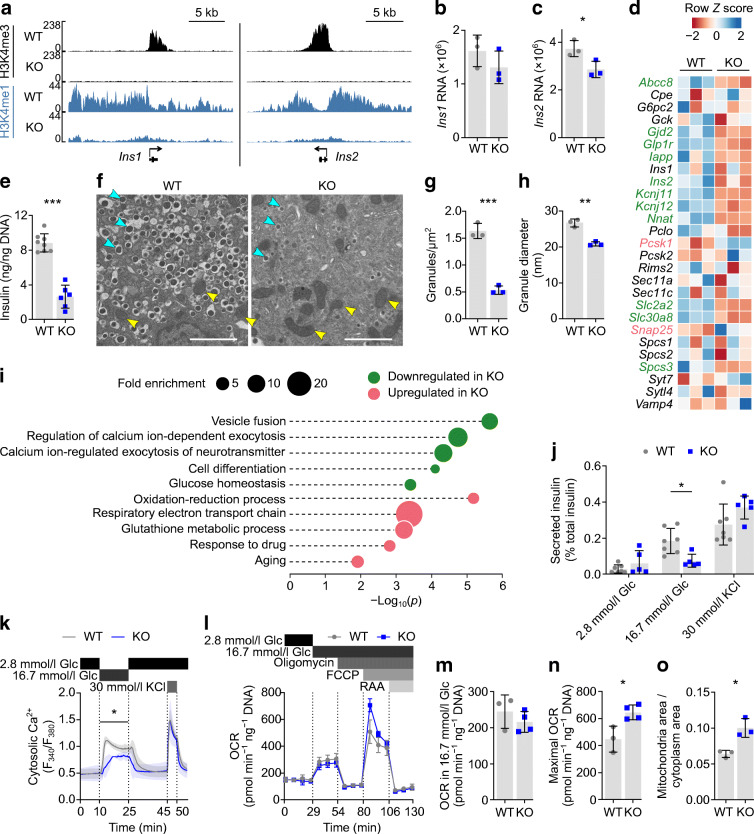
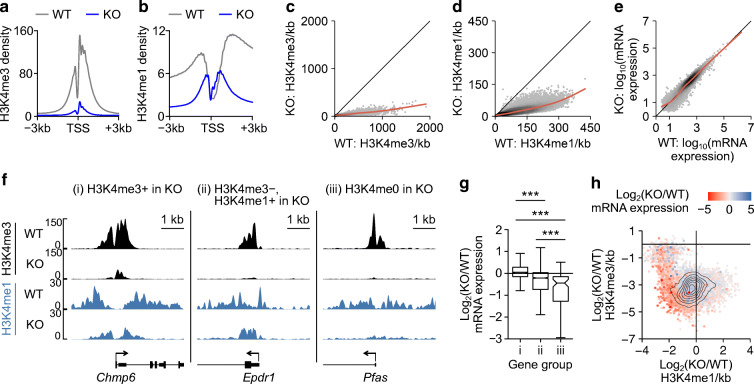
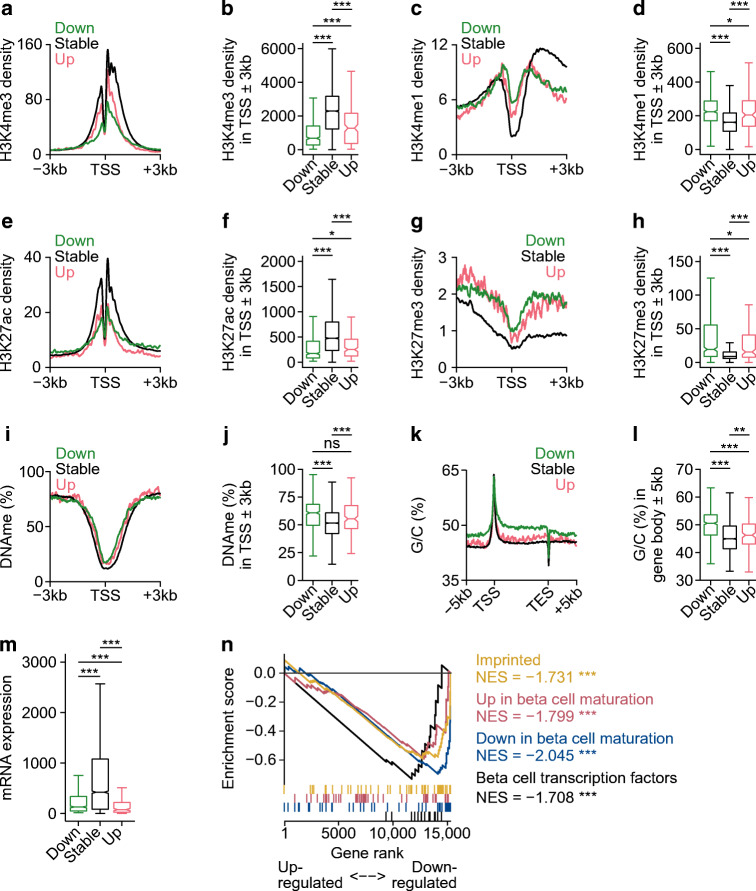
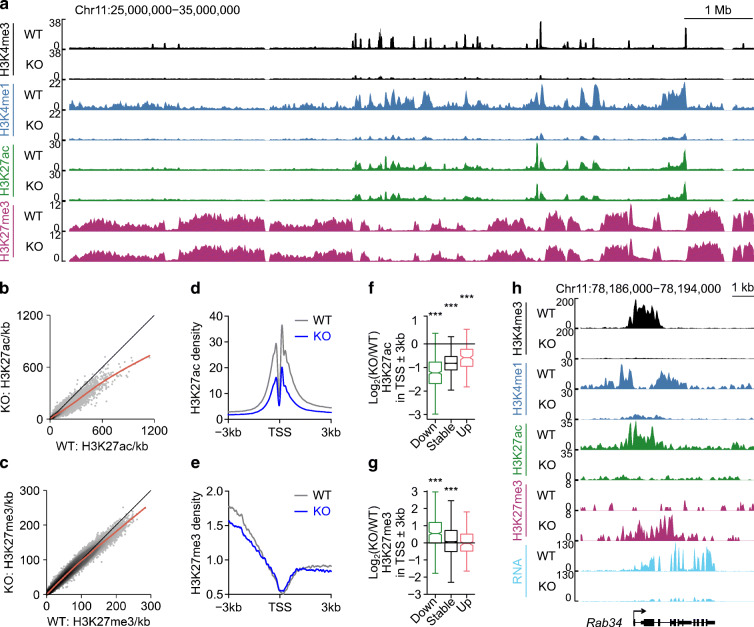
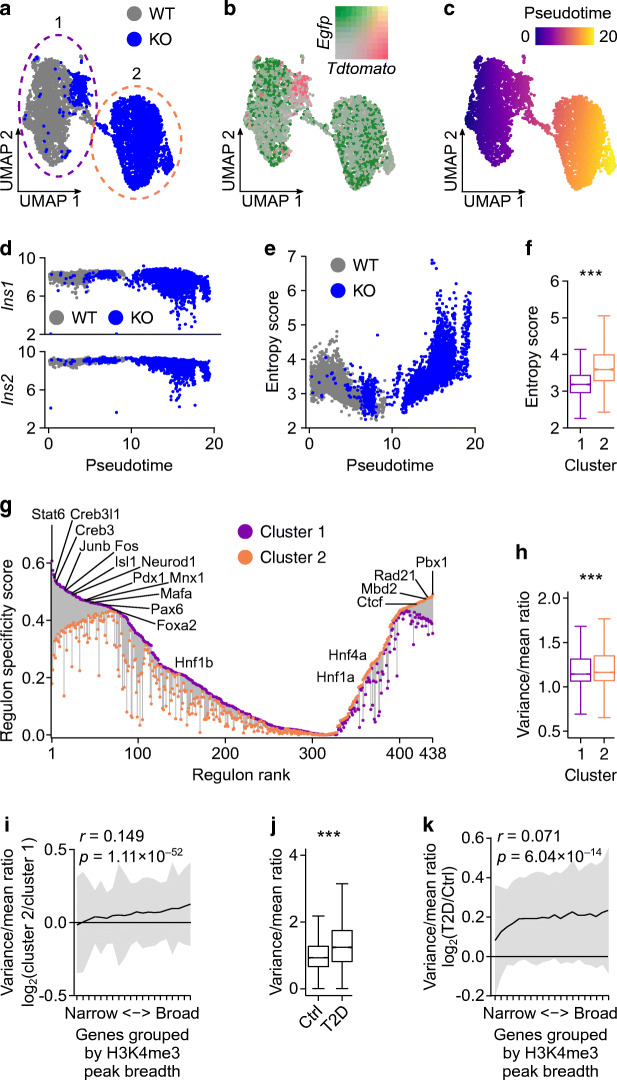
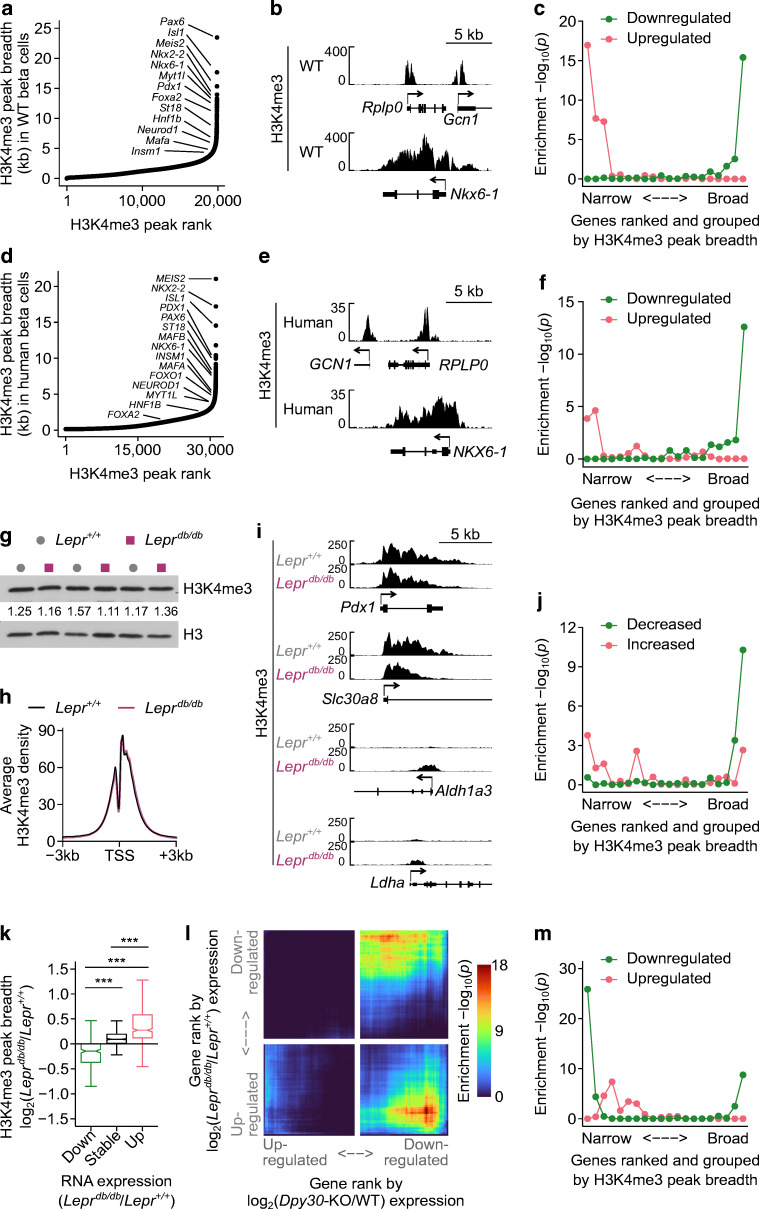
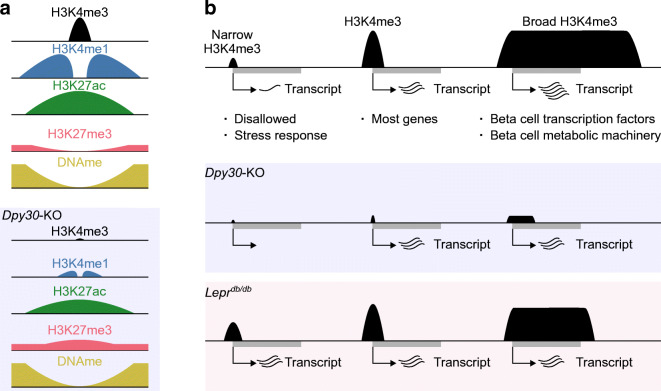
Results: H3K4 methylation maintains expression of genes that are important for insulin biosynthesis and glucose responsiveness. Deficient methylation of H3K4 leads to a less active and more repressed epigenome profile that locally correlates with gene expression deficits but does not globally reduce gene expression. Instead, developmentally regulated genes and genes in weakly active or suppressed states particularly rely on H3K4 methylation. We further show that H3K4 trimethylation (H3K4me3) is reorganised in islets from the Leprdb/db mouse model of diabetes in favour of weakly active and disallowed genes at the expense of terminal beta cell markers with broad H3K4me3 peaks.

Conclusions/interpretation: Sustained methylation of H3K4 is critical for the maintenance of beta cell function. Redistribution of H3K4me3 is linked to gene expression changes that are implicated in diabetes pathology.

Keywords: Beta cell; COMPASS; Chromatin; DPY30; H3K4me3; Insulin; Transcription; Type 2 diabetes.


Figures

Fig. 1
Fig. 1
Reduction of H3K4 methylation in beta cells of adult mice leads to glucose intolerance and hyperglycaemia. (a) Schematic showing the core COMPASS subunits and a nucleosome methylated on H3K4. (b) Genome-aligned RNA-seq reads at the Dpy30 gene locus in Dpy30-WT and Dpy30-KO beta cells 15 days post tamoxifen. Note that the floxed exon 4 is efficiently deleted in the KO cells. (c) Immunoblots showing the COMPASS subunits RBBP5, ASH2L and WDR5 and the nucleosome protein histone H3, co-immunoprecipitated with WDR5 or an IgG control from Dpy30-WT and Dpy30-KO islet cell nuclei 45 days post tamoxifen administration. Representative immunoblots of three independent co-immunoprecipitations are shown. IP, immunoprecipitation. (d) Immunoblots showing H3K4me3, H3K4me1, histone H3 lysine 27 acetylation (H3K27ac), histone H3 lysine 27 trimethylation (H3K27me3) and total histone H3 in islets from Dpy30-WT and Dpy30-KO mice 45 days post tamoxifen administration. Numbers beneath each band indicate the band intensity normalised to the left-most sample. (e) Mean immunofluorescent intensity of DPY30, H3K4me3 and H3K4me1 in Dpy30-WT and Dpy30-KO beta cell nuclei at the indicated days after tamoxifen administration. Data are normalised to the fluorescence intensity of alpha cell nuclei (n=3). (f) Example immunohistochemical images of Dpy30-KO islets used for measurements in (e) showing H3K4me3 (cyan), insulin (magenta) and glucagon (yellow). Scale bars: 100 μm. (g, h) Scatterplots showing log2(fold change) and –log10(p) of gene expression in Dpy30-KO vs Dpy30-WT beta cells 15 days (g) and 45 days (h) post tamoxifen administration. Genes showing a twofold or greater increase or decrease in expression at p≤0.01 (calculated using Wald tests with Benjamini–Hochberg correction) are coloured red and green, respectively, and enumerated above. The full-length transcript of Dpy30 is blue. (i, j) Blood glucose (i) and serum insulin (j) levels during an IPGTT in Dpy30-WT and Dpy30-KO mice 15, 30 and 45 days after tamoxifen administration. Data are means ± SD (n=8–15). P values were calculated from AUCs using multiple two-tailed t tests with Welch’s and Benjamini–Hochberg corrections. (k, l) Unfasted blood glucose levels (k) and body mass (l) of Dpy30-WT and Dpy30-KO mice up to 60 days after tamoxifen administration. Data are individual measurements with means (n=8; however, tracking was stopped after a blood glucose reading ≥20 mmol/l). *p<0.05, ***p<0.001
Fig. 2
Fig. 2
Genes involved in insulin production and glucose-induced activity are regulated by H3K4 methylation. (a) H3K4me3 and H3K4me1 enrichment at the Ins1 and Ins2 gene loci in Dpy30-WT and Dpy30-KO beta cells 45 days after tamoxifen administration. (b, c) Ins1 (b) and Ins2 (c) RNA levels in Dpy30-WT and Dpy30-KO beta cells 45 days after tamoxifen administration. Expression and p values were calculated from RNA-seq data using DESeq2 (Wald tests with Benjamini–Hochberg correction). (d) Heatmap showing expression Z scores in Dpy30-WT and Dpy30-KO beta cells 45 days post tamoxifen administration for selected genes. P values were calculated from RNA-seq data using Wald tests with Benjamini–Hochberg correction (n=3). Significantly downregulated and upregulated genes are shown in green and pink, respectively. (e) Insulin content in Dpy30-WT and Dpy30-KO islets. P values were calculated using two-tailed t tests with Welch’s correction (n=8 WT, n=6 KO). (f) Representative transmission electron micrographs of beta cells from a Dpy30-WT mouse and a Dpy30-KO mouse. Examples of insulin granules and mitochondria are indicated with cyan and yellow arrows, respectively. Scale bars: 2 μm. (g, h) Quantification of median insulin core granule density (g) and size (h). P values were calculated using two-tailed t tests with Welch’s correction (n=3). (i) Enrichment analysis of Gene Ontology: biological process terms in differentially expressed genes 45 days after tamoxifen administration. P values represent EASE scores, modified Fisher’s exact p values, calculated using the Database for Annotation, Visualization and Integrated Discovery (DAVID) v.6.8 [82]. (j) Insulin secretion from Dpy30-WT and Dpy30-KO islets during static in vitro stimulation with glucose and KCl solutions, normalised to islet insulin content. P values were calculated using multiple two-tailed t tests with Welch’s and Benjamini–Hochberg corrections (n=7 WT, n=5 KO). (k) Cytosolic Ca2+ concentration in islets from Dpy30-WT and Dpy30-KO mice during in vitro perifusion of glucose and KCl solutions. P values were calculated for the AUC in each time block by one-way ANOVA between genotypes (n=4 WT, n=3 KO). (l) Oxygen consumption rate in Dpy30-WT and Dpy30-KO dispersed islet cells during treatment with the indicated compounds (n=3 WT, n=4 KO). (m, n) Mitochondrial respiration in Dpy30-WT and Dpy30-KO islet cells in 16.7 mM glucose (m) and their maximal respiration capacity (n), inferred from the data shown in (l). P values were calculated using two-tailed t tests with Welch’s correction (n=3 WT, n=4 KO). (o) Fraction of cytoplasm area occupied by mitochondria in transmission electron micrographs of Dpy30-WT and Dpy30-KO beta cells. P values were calculated using two-tailed t tests with Welch’s correction (n=3). *p<0.05, **p<0.01, ***p<0.001. FCCP, carbonyl cyanide-p-trifluoromethoxyphenylhydrazone; Glc, glucose; OCR, oxygen consumption rate; RAA, rotenone and antimycin A
Fig. 3
Fig. 3
Transcription start site (TSS)-associated H3K4 methylation maintains gene expression in mature beta cells. (a, b) Average enrichment profiles of H3K4me3 (a) and H3K4me1 (b) at the TSS of all expressed genes in Dpy30-WT and Dpy30-KO chromatin. (c, d) Scatterplot of H3K4me3 (c) and H3K4me1 (d) enrichment in 10 kb bins spanning the genome in Dpy30-KO vs Dpy30-WT cells. (e) Scatterplot showing gene expression in Dpy30-KO vs Dpy30-WT cells. (f) Examples of genes that retain H3K4me3 (i), lose H3K4me3 but retain H3K4me1 (ii) and lose H3K4me3 and H3K4me1 (iii) from the TSS in Dpy30-KO chromatin. (g) Box and whisker plot showing log2(fold change) in RNA expression for gene groups exemplified in (f) (group i, n=10,045 genes, group ii, n=2302 genes, group iii, n=111 genes). (h) Contour scatterplot showing log2(fold change) in H3K4me1 enrichment (x axis) plotted against log2(fold change) in H3K4me3 enrichment (y axis) in the TSS±1 kb of all expressed genes. The log2(fold change) in RNA expression of the associated genes is shown as a colour gradient. ***p<0.001
Fig. 4
Fig. 4
Weakly active and developmentally regulated genes are susceptible to downregulation in H3K4me3-deficient beta cells. (al) Average enrichment profiles and quantification of H3K4me3 (a, b), H3K4me1 (c, d), H3K27ac (e, f), H3K27me3 (g, h), DNAme (i, j) and G/C nucleotide content (k, l) in Dpy30-WT cells for genes downregulated, stably expressed or upregulated by Dpy30-KO. (m) Box and whisker plot showing RNA expression in Dpy30-WT cells for genes downregulated, stably expressed or upregulated by Dpy30-KO. (n) Running enrichment plot for imprinted genes ([83]), genes up- or downregulated during mouse beta cell maturation (adults vs postnatal day 10, [63]) and mature beta cell transcription factor genes. P values were calculated using Wilcoxon rank-sum (bm) or permutation (n) tests with Benjamini–Hochberg correction. *p<0.05, **p<0.01, ***p<0.001. NES, normalised enrichment score; ns, not significant; TES, transcription end site
Fig. 5
Fig. 5
H3K4me3 deficiency leads to a less active and more repressed epigenome in mature beta cells. (a) Genome browser view of H3K4me3, H3K4me1, H3K27ac and H3K27me3 in Dpy30-WT and Dpy30-KO cells showing preservation of the megabase-scale organisation of H3K27me3-positive Polycomb-repressed compartments. (b, c) Scatterplots of H3K27ac (b) and H3K27me3 (c) enrichment in 10 kb bins spanning the genome in Dpy30-KO vs Dpy30-WT cells. (d, e) Average enrichment profiles of H3K27ac (d) and H3K27me3 (e) at the TSS of all expressed genes in Dpy30-WT and Dpy30-KO cells. (f, g) Box and whisker plots showing the log2(fold change) in H3K27ac (f) and H3K27me3 (g) enrichment in the TSS of downregulated, stable and upregulated genes in Dpy30-KO vs Dpy30-WT cells. (h) Genome browser view of a downregulated gene, Rab34, showing loss of H3K4me3, H3K4me1, H3K27ac and RNA and accumulation of H3K27me3 in Dpy30-KO cells. P values were calculated using Wilcoxon rank-sum tests with Benjamini–Hochberg correction. ***p<0.001
Fig. 6
Fig. 6
Reduction in transcriptional consistency in beta cells from Dpy30-KO mice and human donors with type 2 diabetes. (ac) Uniform manifold approximation and projection (UMAP) visualisation of beta cell transcriptomes coloured according to genotype of the donor mouse (a), expression of tdTomato, EGFP and their overlap (b) and pseudotime (c). (d) Scatterplot showing Ins1 and Ins2 expression in beta cells plotted against pseudotime. (e) Scatterplot showing gene expression entropy scores of beta cells plotted against pseudotime. (f) Box and whisker plot showing transcriptome entropy of beta cells in clusters 1 and 2 (2466 and 2411 cells, respectively). (g) Active transcription factor regulons identified using SCENIC [67, 68], showing the specificity score of each regulon for cluster 1 (purple) and cluster 2 (orange) connected by a line. Regulons are ranked from the most specific for cluster 1 on the left to the most specific for cluster 2 on the right, and some notable regulons are labelled. (h) Box and whisker plot showing the variance/mean ratio of gene expression across beta cells in clusters 1 and 2. (i) Variance/mean ratio of beta cell gene expression in cluster 2 vs cluster 1 (y axis) plotted as a function of H3K4me3 breadth in quantiles (x axis) (622 genes/quantile). Data are presented as means ± SD. The Spearman rank correlation is shown. (j, k) The same analysis as in (h) and (i), respectively, in beta cells from human donors with or without type 2 diabetes, using H3K4me3 ChIP-seq data from Bramswig et al [52] and single-cell RNA-seq (scRNA-seq) data from Camunas-Soler et al [54]. P values were calculated using Wilcoxon rank-sum tests. ***p<0.001
Fig. 7
Fig. 7
H3K4me3 peak breadth encodes gene expression changes in a mouse model of type 2 diabetes. (a) H3K4me3 peaks in Dpy30-WT beta cells ranked from narrow to broad. Peaks associated with beta cell transcription factor genes are labelled. (b) Genome browser views showing H3K4me3 at a housekeeping gene (Rplp0) and an expression-matched beta cell transcription factor gene (Nkx6-1). (c) Enrichment p values of genes down- or upregulated in islets from Leprdb/db mice, with genes ranked by H3K4me3 peak breadth (as in [a]) and grouped into 20 quantiles. P values were calculated using one-sided Fisher’s exact tests. (d, e) The same data as in (a, b) for human beta cells. (f) Enrichment p values of genes down- or upregulated in islets from donors with type 2 diabetes, with genes ranked by H3K4me3 peak breadth (as in [d]) and grouped into 20 quantiles. P values were calculated using one-sided Fisher’s exact tests. (g) Immunoblots of H3K4me3 and H3 in islet lysates from Lepr+/+ and Leprdb/db mice. H3-normalised H3K4me3 band densities are listed. (h) Average enrichment profiles of H3K4me3 at the TSS of all expressed genes in Lepr+/+ and Leprdb/db islets. (i) Genome browser views of H3K4me3 in Lepr+/+ and Leprdb/db islets at notable genes that are downregulated (Pdx1, Slc30a8) or induced (Aldh1a3, Ldha) in Leprdb/db islets. (j) Enrichment p values of H3K4me3 peaks showing significant change in peak breadth in Leprdb/db vs Lepr+/+ islets (y axis) in the different gene groups ranked from narrow to broad (x axis). Enrichment p values were calculated using one-sided Fisher’s exact tests. (k) Box and whisker plot showing the log2(fold change) in H3K4me3 peak breadth for genes that are downregulated, stably expressed and upregulated in Leprdb/db islets. P values were calculated using Wilcoxon rank-sum tests with Benjamini–Hochberg correction. ***p<0.001. (l) Stratified rank/rank hypergeometric overlap plot comparing gene expression changes caused by Dpy30-KO (x axis) and by Leprdb/db (y axis) mutations. Colourscale shows the hypergeometric enrichment p value. (m) Same as (c) for genes down- or upregulated in Dpy30-KO cells
Fig. 8
Fig. 8
Summary of H3K4me3 in mature mouse beta cells. (a) Active gene promoters are enriched for H3K4me3, H3K4me1 and H3K27ac and are depleted of repressive H3K27me3 and DNAme. Reduction of H3K4me3 and H3K4me1 in Dpy30-KO cells was associated with a generalised reduction of H3K27ac and specific gain of H3K27me3 in downregulated gene promoters. (b) A continuum of H3K4me3 peak breadth distinguishes disallowed and lowly expressed genes from critical mature beta cell lineage factors. Global reduction of H3K4me3 in Dpy30-KO cells impaired expression of genes with very narrow or very broad peaks. In Leprdb/db mice, accumulation of H3K4me3 at narrow peaks and loss of H3K4me3 from broad peaks was associated with concordant changes in gene expression. Genes with an intermediate H3K4me3 peak profile were not generally dysregulated in either model

References

    1. Ebrahimi AG, Hollister-Lock J, Sullivan BA, Tsuchida R, Bonner-Weir S, Weir GC (2020) Beta cell identity changes with mild hyperglycemia: Implications for function, growth, and vulnerability. Mol Metab 35:100959. 10.1016/j.molmet.2020.02.002 - PMC - PubMed
    1. Salinno C, Cota P, Bastidas-Ponce A, Tarquis-Medina M, Lickert H, Bakhti M. β-cell maturation and identity in health and disease. Int J Mol Sci. 2019;20(21):1–20. doi: 10.3390/ijms20215417. - DOI - PMC - PubMed
    1. Kim H, Yoon BH, Oh CM, et al. PRMT1 is required for the maintenance of mature β-cell identity. Diabetes. 2020;69(3):355–368. doi: 10.2337/db19-0685. - DOI - PubMed
    1. Lu TTH, Heyne S, Dror E, et al. The Polycomb-dependent epigenome controls β cell dysfunction, dedifferentiation, and diabetes. Cell Metab. 2018;27(6):1294–1308. doi: 10.1016/j.cmet.2018.04.013. - DOI - PMC - PubMed
    1. Dhawan S, Georgia S, Tschen SI, Fan G, Bhushan A. Pancreatic β cell identity is maintained by DNA methylation-mediated repression of Arx. Dev Cell. 2011;20(4):419–429. doi: 10.1016/j.devcel.2011.03.012. - DOI - PMC - PubMed

Publication types