. 2023 Mar 13;2(3):e0000199.
doi: 10.1371/journal.pdig.0000199. eCollection 2023 Mar.

Proactive Contact Tracing

Affiliations

Proactive Contact Tracing

Prateek Gupta et al. PLOS Digit Health. .

Abstract

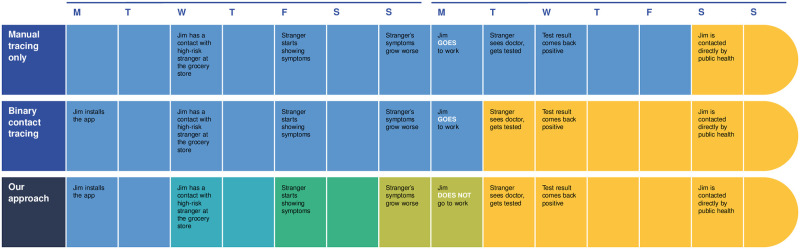
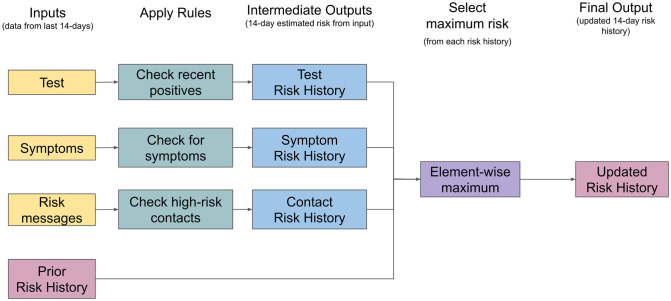
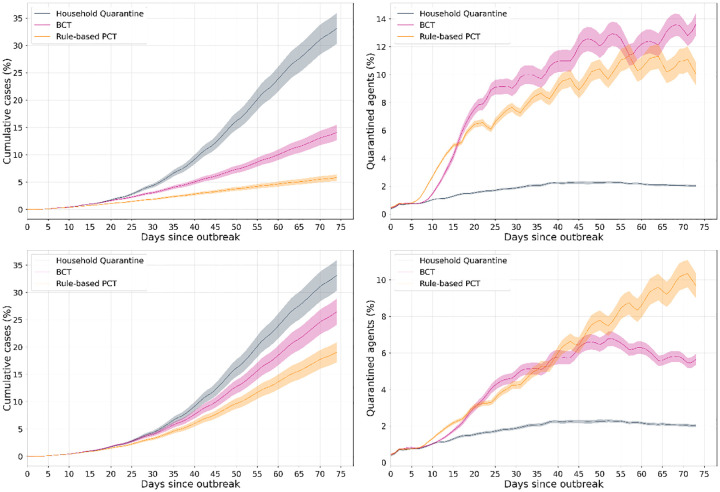
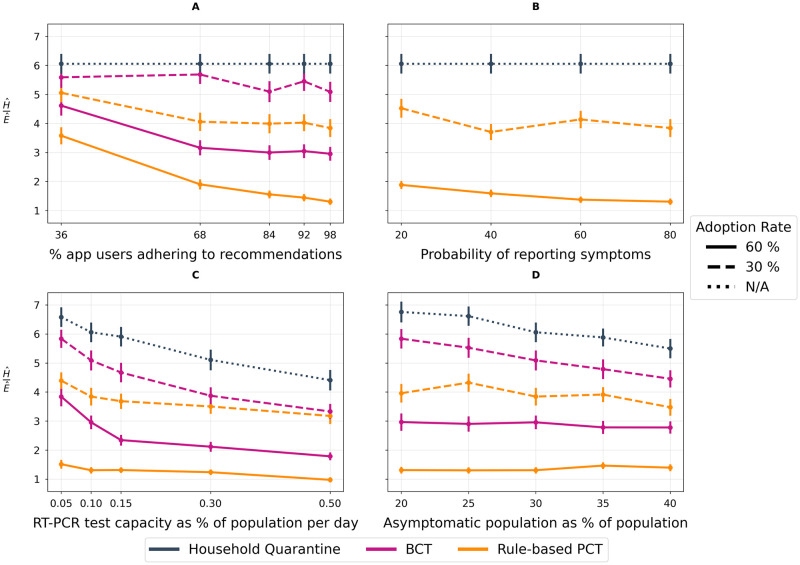
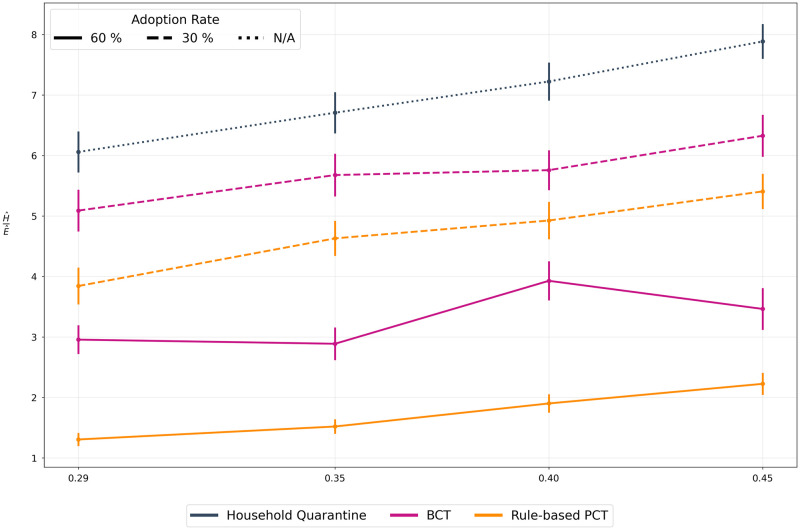
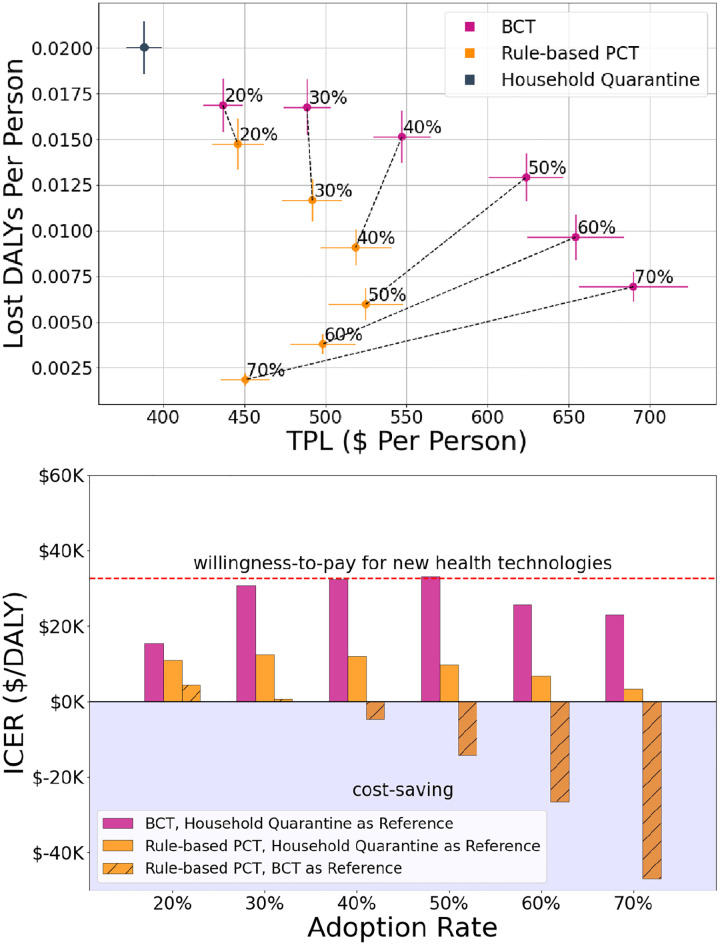
The COVID-19 pandemic has spurred an unprecedented demand for interventions that can reduce disease spread without excessively restricting daily activity, given negative impacts on mental health and economic outcomes. Digital contact tracing (DCT) apps have emerged as a component of the epidemic management toolkit. Existing DCT apps typically recommend quarantine to all digitally-recorded contacts of test-confirmed cases. Over-reliance on testing may, however, impede the effectiveness of such apps, since by the time cases are confirmed through testing, onward transmissions are likely to have occurred. Furthermore, most cases are infectious over a short period; only a subset of their contacts are likely to become infected. These apps do not fully utilize data sources to base their predictions of transmission risk during an encounter, leading to recommendations of quarantine to many uninfected people and associated slowdowns in economic activity. This phenomenon, commonly termed as "pingdemic," may additionally contribute to reduced compliance to public health measures. In this work, we propose a novel DCT framework, Proactive Contact Tracing (PCT), which uses multiple sources of information (e.g. self-reported symptoms, received messages from contacts) to estimate app users' infectiousness histories and provide behavioral recommendations. PCT methods are by design proactive, predicting spread before it occurs. We present an interpretable instance of this framework, the Rule-based PCT algorithm, designed via a multi-disciplinary collaboration among epidemiologists, computer scientists, and behavior experts. Finally, we develop an agent-based model that allows us to compare different DCT methods and evaluate their performance in negotiating the trade-off between epidemic control and restricting population mobility. Performing extensive sensitivity analysis across user behavior, public health policy, and virological parameters, we compare Rule-based PCT to i) binary contact tracing (BCT), which exclusively relies on test results and recommends a fixed-duration quarantine, and ii) household quarantine (HQ). Our results suggest that both BCT and Rule-based PCT improve upon HQ, however, Rule-based PCT is more efficient at controlling spread of disease than BCT across a range of scenarios. In terms of cost-effectiveness, we show that Rule-based PCT pareto-dominates BCT, as demonstrated by a decrease in Disability Adjusted Life Years, as well as Temporary Productivity Loss. Overall, we find that Rule-based PCT outperforms existing approaches across a varying range of parameters. By leveraging anonymized infectiousness estimates received from digitally-recorded contacts, PCT is able to notify potentially infected users earlier than BCT methods and prevent onward transmissions. Our results suggest that PCT-based applications could be a useful tool in managing future epidemics.


Conflict of interest statement

The authors have declared that no competing interests exist.

Figures

Fig 1
Fig 1. Motivating example comparing manual, binary, and proactive contact tracing.
This example shows the potential effectiveness of early warning signals in controlling the spread of the infection. We see that manual tracing suffers from a delay between laboratory-confirmed diagnosis and informing all contacts. Further, both manual and digital contact tracing send late signals because they only make use of the strongest possible signal (a laboratory-confirmed diagnosis). The proposed PCT approach takes advantage of reported symptoms and the propagation of risk signals between phones to obtain much earlier signals.
Fig 2
Fig 2. Rule-Based PCT Overview.
This simplified diagram shows how information flows through the rule-based PCT algorithm. This algorithm is run each day on the agent’s 14-day history of features to estimate their risk history. Each day the algorithm is run, it takes as input their current RT-PCR test history, user-input symptom history, and anonymized risk message history. Next, a ruleset is applied independently to each input type yielding estimates of the user’s risk history over the past 14 days. Finally, to construct a single conservative estimate of the user’s risk history, RB-PCT takes the maximum risk across all estimates including the previously generated estimates. There are some exceptions to these rules (e.g. negative test results reset some of the risk history to low values); a full description is provided in S3 Appendix.
Fig 3
Fig 3
Left: Cumulative case counts for each method (fraction of the population) and Right: Mobility restriction (fraction of population quarantined), for 60% (top) and 30% (bottom) app adoption Gist: Both BCT and PCT significantly reduce cases as compared to HQ, even at lower app adoption; benefits increase with increasing adoption. With higher adoption, (top) PCT imposes less restriction while achieving much greater reduction in cases. However, at lower adoptions, the reduction in cases is achieved via more conservative recommendations, highlighting the need for more sophisticated predictors if app adoption is low. The plots show mean and 1-standard error bands of these quantities. Note that the HQ scenario includes (false) quarantines because household members of an infected individual are recommended quarantine irrespective of their infection status.
Fig 4
Fig 4. Adoption rate comparison.
We compare all methods for adoption rates between 0% (HQ) and 60% of both BCT and PCT. Gist: Both BCT and PCT methods are able to improve over the HQ scenario, even at low adoption rates. We also observe that PCT is able to negotiate the health-economic trade-off better than BCT (lower the ratio, better is the trade-off). We further compare this performance across adoption rates in cost-benefit analysis.
Fig 5
Fig 5. Sensitivity Analyses.
All experiments measure the proportion of the population infected, H^, within 60 days of an outbreak normalized by mean daily contacts per person per day, E^. We plot H^E^ for each tracing method across two app adoption rates as well as against a baseline household quarantining scenario. A lower H^E^ ratio indicates a better trade-off between epidemic control and restriction of population mobility. We use N/A to represent irrelevance of adoption rate in the baseline scenario as no DCT app is deployed. (A) Recommendation Adherence. Illustrates the impact of varying recommendation adherence (e.g. the daily likelihood of getting a test, quarantining, reducing contacts given an in-app notification is received). (B) Symptom reporting. Illustrates the impact of varying the daily rate of symptom reporting. Note: the plot omits BCT because BCT doesn’t incorporate symptoms in its inputs. (C) RT-PCR Testing Capacity. Illustrates the impact of varying the percentage of the population that can receive an RT-PCR test on any given day, ranging from the observed provincial testing capacity of 0.1% to a highly optimistic value of 0.5% of the population. (D) Infectiousness and symptoms. Illustrates the impact of varying the proportion of cases that will not develop symptoms.
Fig 6
Fig 6. Asymptomatic infection ratio.
We vary the relative infectiousness of asymptomatic cases. A value of f implies that the asymptomatic case can potentially infect f times as many people as compared to a symptomatic case. A value of 0.29 is the chosen minimum as described in the epidemiological literature while a higher value of 0.45 is a hypothetical situation describing a more infectious variant of the virus. Once again, we use N/A to represent irrelevance of adoption rate in the baseline scenario as no DCT app is deployed. Gist As the infectiousness of asymptomatic cases increases, their timely and accurate detection becomes increasingly important. Thus, all the scenarios show a degradation in performance. However, owing to the early warning signals of PCT, it retains its advantage across the range of infection ratios.
Fig 7
Fig 7. Cost-effectiveness analysis.
(a) We evaluate the trade-off between temporary productivity loss (TPL) per person and disability-adjusted life years (DALYs) per person for each of the scenarios (HQ, BCT, PCT) at various adoption rates (annotations). (b) Further, we compute incremental cost-effectiveness ratios (ICER) of BCT (pink bars) and PCT (yellow bars) with respect to HQ (unshaded bars) and of PCT with respect to BCT (shaded bars) to quantify these trade-offs with a single metric. The dashed red line represents a willingness-to-pay threshold for new health technologies [33] of $33K in 2020 Canadian dollars (see S5 Appendix for calculations). Gist Increased adoption rates lead to better health outcomes for both BCT and PCT, with PCT performing better than BCT across all adoption rates. Additionally, above 30% adoption, PCT is able to leverage the additional information to dominate BCT, making PCT cost-saving with respect to BCT in this regime. This pareto dominance of PCT over BCT above 30% adoption is shown in figure (b) by negative ICER values of PCT with BCT as a reference intervention (shaded bar). Across all adoption rates, the ICER of PCT is well below the willingness-to-pay threshold for new health technologies. As a final note, increases in the adoption rate of PCT above 50% lead to increasingly cost-saving outcomes.

References

    1. Vinceti M, Filippini T, Rothman KJ, Ferrari F, Goffi A, Maffeis G, et al.. Lockdown timing and efficacy in controlling COVID-19 using mobile phone tracking. EClinicalMedicine. 2020;25:100457. doi: 10.1016/j.eclinm.2020.100457 - DOI - PMC - PubMed
    1. Rossi R, Socci V, Talevi D, Mensi S, Niolu C, Pacitti F, et al.. COVID-19 Pandemic and Lockdown Measures Impact on Mental Health Among the General Population in Italy. Frontiers in Psychiatry. 2020;11:790. doi: 10.3389/fpsyt.2020.00790 - DOI - PMC - PubMed
    1. Bonaccorsi G, Pierri F, Cinelli M, Flori A, Galeazzi A, Porcelli F, et al.. Economic and social consequences of human mobility restrictions under COVID-19. Proceedings of the National Academy of Sciences. 2020;117(27):15530–15535. doi: 10.1073/pnas.2007658117 - DOI - PMC - PubMed
    1. Mandel A, Veetil V. The economic cost of COVID lockdowns: an out-of-equilibrium analysis. Economics of Disasters and Climate Change. 2020;4:431–451. doi: 10.1007/s41885-020-00066-z - DOI - PMC - PubMed
    1. Cele S, Jackson L, Khoury DS, Khan K, Moyo-Gwete T, Tegally H, et al.. Omicron extensively but incompletely escapes Pfizer BNT162b2 neutralization. Nature. 2022;602(7898):654–656. doi: 10.1038/s41586-021-04387-1 - DOI - PMC - PubMed

LinkOut - more resources