. 2023 Mar 21;120(12):e2301358120.
doi: 10.1073/pnas.2301358120. Epub 2023 Mar 13.

Rgs1 is a regulator of effector gene expression during plant infection by the rice blast fungus Magnaporthe oryzae

Affiliations

Rgs1 is a regulator of effector gene expression during plant infection by the rice blast fungus Magnaporthe oryzae

Bozeng Tang et al. Proc Natl Acad Sci U S A. .

Abstract

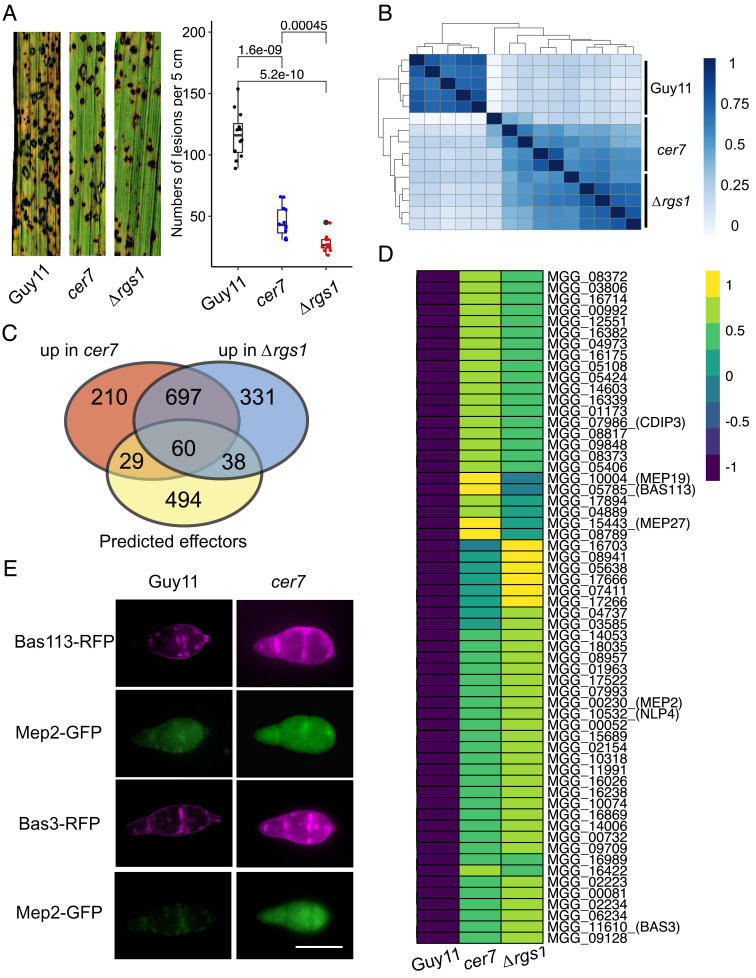
To cause rice blast disease, the filamentous fungus Magnaporthe oryzae secretes a battery of effector proteins into host plant tissue to facilitate infection. Effector-encoding genes are expressed only during plant infection and show very low expression during other developmental stages. How effector gene expression is regulated in such a precise manner during invasive growth by M. oryzae is not known. Here, we report a forward-genetic screen to identify regulators of effector gene expression, based on the selection of mutants that show constitutive effector gene expression. Using this simple screen, we identify Rgs1, a regulator of G-protein signaling (RGS) protein that is necessary for appressorium development, as a novel transcriptional regulator of effector gene expression, which acts prior to plant infection. We show that an N-terminal domain of Rgs1, possessing transactivation activity, is required for effector gene regulation and acts in an RGS-independent manner. Rgs1 controls the expression of at least 60 temporally coregulated effector genes, preventing their transcription during the prepenetration stage of development prior to plant infection. A regulator of appressorium morphogenesis is therefore also required for the orchestration of pathogen gene expression required for invasive growth by M. oryzae during plant infection.

Keywords: effectors; gene expression; plant pathogen; rice blast.


Conflict of interest statement

The authors declare no competing interest.

Figures

Fig. 1.
Fig. 1.
A forward genetic screen identified the cer7 mutant of M. oryzae (A) Micrographs showing differential expression of Mep2-GFP at the BIC in invasive hyphae and basal expression in conidia of the wild-type M. oryzae strain Guy11. (Scale bar, 10 µm.) BIC localization was imaged in rice leaf sheath tissue inoculated with conidia of Guy11:Mep2-GFP at 32 hpi. (B) Boxplots to show relative transcripts of MEP2 as log2 fold changes values in invasive hyphae of Guy11. The samples were harvested from Guy11. conidia and leaf sheath harvested at 16 hpi, 24 hpi, and 48 hpi. n = 6 experiments. Expression is shown relative to the M. oryzae actin gene. (C) Micrographs and line-scan graphs showing the constitutive fluorescence signal of Mep2-GFP in mutant strain cer7 conidia, compared to the wild-type Guy11 (Scale bar, 10 µm.) (D) Box plots to show fluorescence intensities of Mep2-GFP as log2 values and relative abundance of MEP2 transcripts as log2 fold change values in qRT-PCR. Colours correspond to Guy11 (black), cer7 (red), and Guy11:MEP2-GFP (blue). Significance between groups of samples was performed using Unpaired Student’s t test. ***P < 0.001, *P < 0.05, NS = no significant difference.
Fig. 2.
Fig. 2.
Bulked segregant analysis and genetic complementation defined rgs1cer7 as the allele responsible for constitutive expression of Mep2-GFP in conidia. (A) Micrographs showing expression of Mep2-GFP in segregating ascospores obtained from a cross between cer7 and TH3. A single ascospore was isolated from an ascus under the dissecting microscope. Progeny displaying a high level of fluorescence signal from Mep2-GFP (cer7) were pooled together for whole genome sequencing. (Scale bar, 2 µm.) Boxplots showing log2 values of fluorescence intensities of Mep2-GFP measured from conidia of 253 individual M. oryzae progeny. Progeny with cer7 phenotype (blue), and those showing CER7 phenotype (red), were compared to wild-type Guy11 conidia (black). n(cer7) = 59, n(CER7) = 194. A t test was performed to determine the significance between the samples and P values are shown. (B) Graph showing SNP cosegregation frequencies on chromosome 2 after sequencing genomic DNA from pools of progeny segregating for cer7 and CER7 phenotypes, respectively. Red line shows frequencies of variants identified from pooled genomic DNA from progeny showing the cer7 phenotype. Blue line shows frequencies of variants identified from pooled genomic DNA from progeny with CER7 phenotype (C) Boxplot and micrographs to show the fluorescence intensity of Mep2-GFP in conidia of wild-type Guy11 (Black), cer7 (red), Guy11:rgs1cer7 (blue), cer7:RGS1WT (orange), Guy11::rgs1cer7 (gray), and Δrgs1 (green). Letters within each sample refer to one-way ANOVA tests (P < 0.05, Duncan test). Micrographs show bright field and epifluorescence images of conidia. (Scale bar, 10 µm.)
Fig. 3.
Fig. 3.
The N terminus of Rgs1 is required for the repression of MEP2 expression in conidia. (A) Heatmap showing relative transcript abundance of MEP2 (MGG_00230) and RGS1 (MGG_14517) genes in M. oryzae conidia, and during infection from 8 to 144 hpi. Relative transcript levels are fold change compared to expression in mycelium (from data set PRJEB44745). Data were extracted from RNA-seq dataset PRJEB45007. The colour key shows scaled fold change values. (B) Micrograph showing the fluorescence signal of Rgs1-GFP expressed in Guy11. Live-cell imaging was performed during a time course experiment to investigate expression of Rgs1-GFP in conidia, germ tubes, mature appressoria, and invasive hyphae at 24 hpi. (C) Images showing transactivation activity of N-terminal Rgs1 (N-Rgs1), C-terminal Rgs1 (C-Rgs1), and full length Rgs1 in yeast cells. Cotransformation of Y2HGold yeast cells with bait (BD) and prey (AD) vectors was carried out with following combinations; pGBKT7-N-Rgs1/pGADT7, pGBKT7-C-Rgs1/pGADT7, pGBKT7-Rgs1/ pGADT7, and positive control (pGBKT7-53 and pGADT7-T) along with empty vectors, and grown in double drop-out and quadruple-dropout media. Images represent two independent biological replicates. (D) Micrographs showing expression of Mep2-GFP in conidia of strains cer7, Guy11, cer7:N-Rgs1, cer7:C-Rgs1. Conidia from each strain were harvested from colonies after 5 d growth on CM and immediately mounted on microscope slides for GFP visualization using epifluorescence microscopy. (Scale bar, 10 µm.) The schematic illustration demonstrates different genotypes in corresponding M. oryzae strains.
Fig. 4.
Fig. 4.
Rgs1 Regulates expression of a subpopulation of effectors during plant infection. (A) Seedlings of rice cultivar CO-39 were inoculated with M. oryzae conidial suspensions of equal concentration (1 × 10⁵ conidia/mL) of wild-type Guy11, cer7 and Δrgs1 mutants. The boxplot represents the number of rice blast disease lesions per 5 cm in three independent repetitions of the experiment. Unpaired Student’s t test was performed to determine significant differences. (B) Heatmap showing the Euclidean distance between RNA-seq samples from conidia of cer7, the wild-type Guy11, and Δrgs1. Normalized reads counts were used from all the samples to determine clustering. Intensity of colours represent similarities and distance between samples. (C) Venn diagram to show the number of effector genes derepressed in conidia of the cer7 and Δrgs1 mutants. Blue circle = cer7, red circle = Δrgs1. (D) Heatmap showing expression of 60 effector genes significantly upregulated in conidia of cer7 and Δrgs1 mutants, compared to Guy11. Normalized expression values of transcripts used the TMM method. (E) Micrographs showing expression of Mep2-GFP, Bas113-RFP, and Bas3-RFP in conidia of cer7 compared to Guy11. Conidial suspensions from each strain were inoculated onto hydrophobic glass coverslips and imaged using epifluorescence microscopy. (Scale bar, 10 µm.)
Fig. 5.
Fig. 5.
Rgs1 prevents rice defence gene expression and is a fitness determinant for rice blast disease. (A) Micrographs showing growth of invasive hyphae of Guy11 and Δrgs1 48 hpi. (Scale bar, 10 µm.) Rice leaf sheaths of rice cultivar CO39 were inoculated with conidial suspensions of Guy11 and Δrgs1. (Scale bars, 12 μm.) (B) Boxplots to show fold change values as relative transcripts of defence-related genes CPS2 and PR1a in rice. Rice leaf sheath samples were inoculated with 0.02% gelatin (black), conidial suspension of Guy11 (blue) and Δrgs1 (red). The qRT-PCR was performed using rice housekeeping genes eEF1A and UBQ5 as standards. (C) Seedlings of rice cultivar CO-39 were inoculated with conidial suspensions of equal concentration (1 × 10⁵ conidia/mL) of ToxAp:RGS1, ToxAp:RGS1-GFP, and Guy11:H1-RFP. The boxplot represents the number of rice blast disease lesions per 5 cm in two independent repetitions of the experiment. Unpaired Student’s t tests were performed to determine significant differences. NS = no significant difference. Micrographs show the fluorescence signals of ToxAp:Rgs1-GFP and H1-RFP strains used in the relative fitness assay (Scale bar, 10 µm.) (D). Boxplots showing the number of spores recovered from disease lesions following mixed infections with conidial suspensions of M. oryzae strains expressing H1-RFP and ToxAp:RGS1-GFP respectively. After 7 d, spores were collected from disease lesions, the ratio of each genotype determined and then used for subsequent inoculation of CO-39 seedlings. (E) The relative fitness of the ToxAp:Rgs1-GFP M. oryzae strain was carried out using the formula: Relative fitness = x2(1 − x1)/x1(1 − x2), where x1 is the initial frequency and x2 the final frequency.

References

    1. Lo Presti L., et al. , Fungal effectors and plant susceptibility. Annu. Rev. Plant Biol. 66, 513–545 (2015). - PubMed
    1. Kamoun S., A catalogue of the effector secretome of plant pathogenic oomycetes. Annu. Rev. Phytopathol. 44, 41–60 (2006). - PubMed
    1. Skamnioti P., Gurr S. J., Against the grain: Safeguarding rice from rice blast disease. Trends Biotechnol. 27, 141–150 (2009). - PubMed
    1. Toruño T. Y., Stergiopoulos I., Coaker G., Plant-pathogen effectors: Cellular probes interfering with plant defenses in spatial and temporal manners. Annu. Rev. Phytopathol. 54, 419 (2016). - PMC - PubMed
    1. Jeon J., et al. , Transcriptome profiling of the rice blast fungus Magnaporthe oryzae and its host oryza sativa during infection. Mol. Plant Microb. Interact. 33, 141–144 (2019). - PubMed

Publication types

Substances

Supplementary concepts