. 2023 Apr:161:105420.
doi: 10.1016/j.jcv.2023.105420. Epub 2023 Mar 3.

Duration of viral infectiousness and correlation with symptoms and diagnostic testing in non-hospitalized adults during acute SARS-CoV-2 infection: A longitudinal cohort study

Affiliations

Duration of viral infectiousness and correlation with symptoms and diagnostic testing in non-hospitalized adults during acute SARS-CoV-2 infection: A longitudinal cohort study

Paul K Drain et al. J Clin Virol. 2023 Apr.

Abstract

Background: Guidelines for SARS-CoV-2 have relied on limited data on duration of viral infectiousness and correlation with COVID-19 symptoms and diagnostic testing.

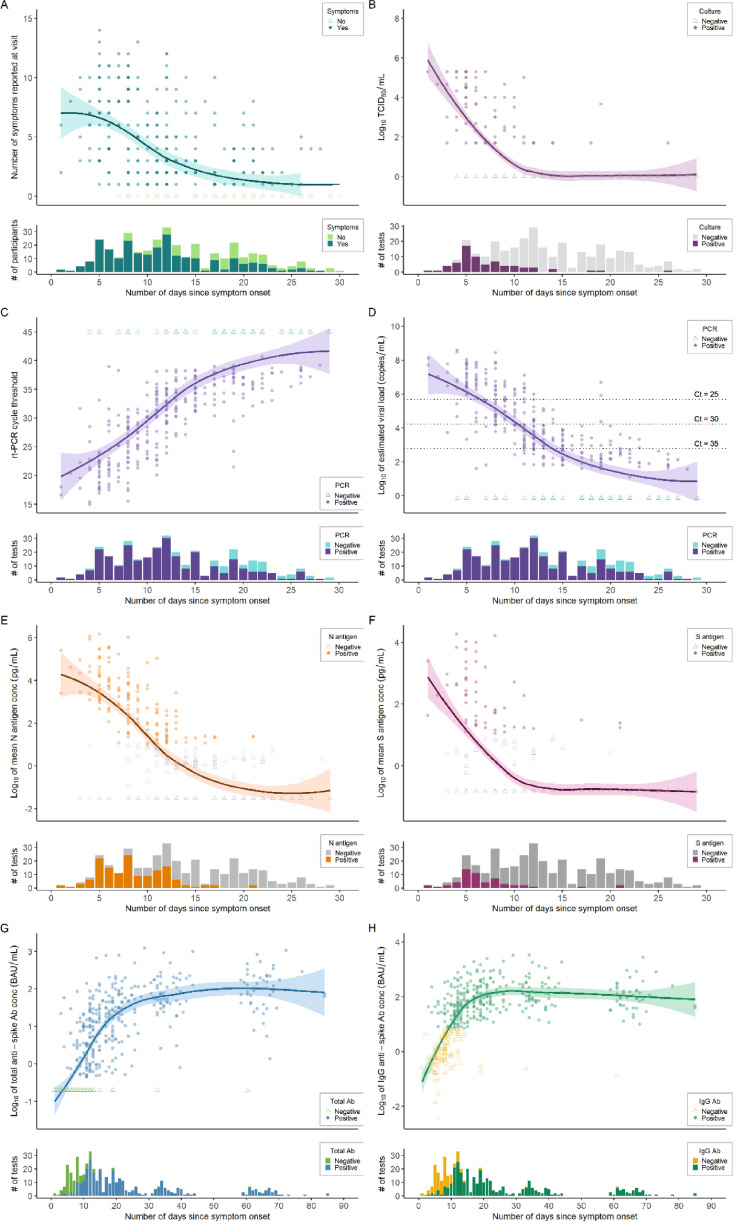
Methods: We enrolled ambulatory adults with acute SARS-CoV-2 infection and performed serial measurements of COVID-19 symptoms, nasal swab viral RNA, nucleocapsid (N) and spike (S) antigens, and replication-competent SARS-CoV-2 by viral growth in culture. We determined average time from symptom onset to a first negative test result and estimated risk of infectiousness, as defined by positive viral growth in culture.

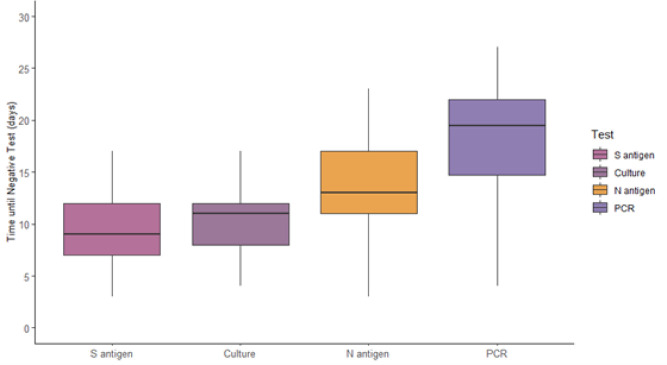
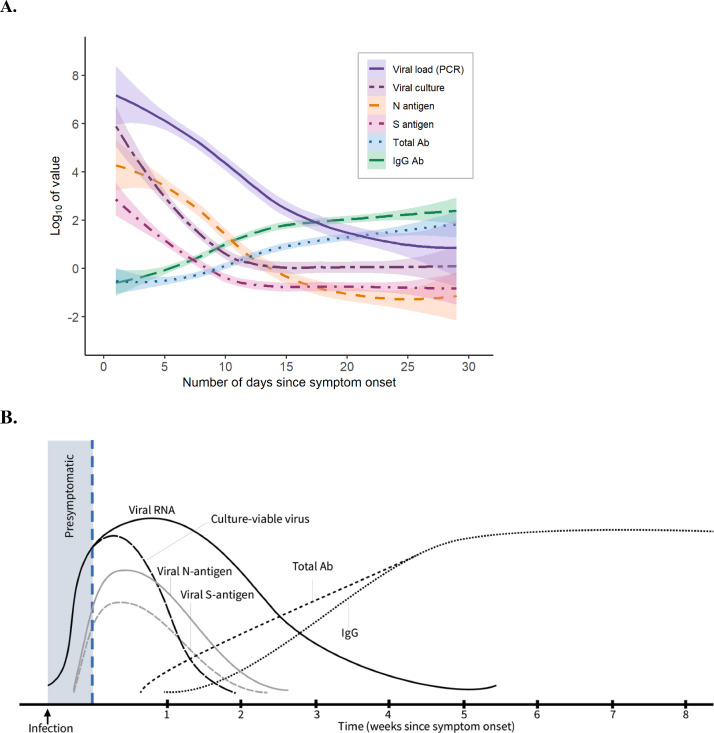
Results: Among 95 adults, median [interquartile range] time from symptom onset to first negative test result was 9 [5] days, 13 [6] days, 11 [4] days, and >19 days for S antigen, N antigen, culture growth, and viral RNA by RT-PCR, respectively. Beyond two weeks, virus growth and N antigen titers were rarely positive, while viral RNA remained detectable among half (26/51) of participants tested 21-30 days after symptom onset. Between 6-10 days from symptom onset, N antigen was strongly associated with culture positivity (relative risk=7.61, 95% CI: 3.01-19.22), whereas neither viral RNA nor symptoms were associated with culture positivity. During the 14 days following symptom onset, the presence of N antigen remained strongly associated (adjusted relative risk=7.66, 95% CI: 3.96-14.82) with culture positivity, regardless of COVID-19 symptoms.

Conclusions: Most adults have replication-competent SARS-CoV-2 for 10-14 after symptom onset. N antigen testing is a strong predictor of viral infectiousness and may be a more suitable biomarker, rather than absence of symptoms or viral RNA, to discontinue isolation within two weeks from symptom onset.

Keywords: COVID-19; Infectiousness; Isolation; SARS-CoV-2; Transmission.


Conflict of interest statement

Declaration of Competing Interest The authors declare that they have no known competing financial interests or personal relationships that could have appeared to influence the work reported in this paper.

Figures

Fig 1
Fig. 1
Viral phylogram for unvaccinated adults presenting with acute SARS-CoV-2 infection. Phylogram on the SARS-CoV-2 virus and variants among the enrolled participants (red font indicates reference strains; similar colors indicate related samples, either household contacts or samples from the same individual at different time points).
Fig 2
Fig. 2
Median days from symptom onset to first negative test among spike (S) antigen, viral culture, nucleocapsid (N) antigen, and RT-PCR for viral RNA. Median [interquartile range] days from symptom onset to the first negative test was 9 days for S antigen, 11 days for viral culture, 13 days for N antigen, and >19 days for RT-PCR, among participants testing negative within 14 days of enrollment. Median for RT-PCR could not be precisely approximated because more than half of participants were positive at all available sample times (within 14 days of enrollment, which corresponds to 2–4 weeks after onset of symptoms).
Fig 3
Fig. 3
Trajectory of clinical symptoms, replication-competent viral growth, viral load by RT-PCR, nucleocapsid and spike antigen concentrations, and antibody titers, by days since symptom onset. Within each panel, quantitative data are displayed in the top portion and dichotomous positive/negative test results are displayed in the bottom portion, by number of days since date of symptom onset. Average lines represent LOESS curves and shaded regions represent 95% confidence intervals. Darker coloring indicates higher density of observations at that value (e.g., overlapping points lead to darker coloration). A, Total number of COVID-19 symptoms reported by participants at each clinical visit (n = 351). B, Viral culture by log10 TCID50 per mL, with an estimated limit of detection of 2.0 (n = 307). C, RT-PCR testing of viral RNA with cycle threshold (Ct) on the vertical axis (n = 347). D, Estimated log10 of SARS-CoV-2 viral load (copies/mL) from RT-PCR testing (n = 347). E, Nucleocapsid (N) antigen log10 mean concentration (pg/mL) as measured by a MesoScale Diagnostics assay (n = 348). F, Spike (S) antigen log10 mean concentration (pg/mL) as measured by a MesoScale Diagnostics assay (n = 349). G, Total anti-spike log10 mean antibody concentration (BAU/mL) tested by Roche Elecsys assay (n = 442), excluding antibody titers obtained after vaccination. H, Anti-spike IgG log10 mean antibody concentration (BAU/mL) tested by Abbott AdviseDx assay (n = 442), excluding antibody titers obtained after vaccination.
Fig 4
Fig. 4
Diagnostic test kinetics and immunological responses in adults with non-severe, symptomatic SARS-CoV-2 infection. Average lines represent LOESS curves and shaded regions represent 95% confidence intervals. The x-axis shows days since symptom onset and the y-axis uses a log transformation. A, Study data with Log10 values for measured SARS-CoV-2 viral load, TCID50 from viral culture, nucleocapsid (N) antigen and spike (S) antigen mean concentration, and total anti-spike and anti-spike IgG antibody concentrations, by number of days since symptom onset. B, Theoretical model of diagnostic test kinetics and immunological responses, as extrapolated from observed data obtained among unvaccinated adults during acute SARS-CoV-2 infection.

References

    1. World Health Organization. WHO coronavirus (COVID-19) dashboard (2022); https://COVID19.who.int.
    1. Wu S.L., et al. Substantial underestimation of SARS-CoV-2 infection in the United States. Nat. Commun. 2020;11:4507. - PMC - PubMed
    1. COVID-19 Excess Mortality Collaborators Estimating excess mortality due to the COVID-19 pandemic: a systematic analysis of COVID-19-related mortality, 2020–21. Lancet. 2022 Published Online March 10. - PMC - PubMed
    1. World Health Organization . World Health Organization; Geneva: 2021. Technical Specifications For Selection of Essential in Vitro Diagnostics For SARS-CoV-2.
    1. World Health Organization . Interim Guidance; 2020. Laboratory Testing Strategy Recommendations For COVID-19.https://apps.who.int/iris/bitstream/handle/10665/331509/WHO-COVID-19-lab... 21 MarchRef: WHO/2019-nCoV/lab_testing/2020.1. Note: “The role of rapid disposable tests for antigen detection for COVID-19 needs to be evaluated and is not currently recommended for clinical diagnosis pending more evidence on test performance and operational utility. WHO will update this guidance as more information laboratory tests for COVID-19 becomes available.

Publication types