

Automatic segmentation of the choroid plexuses: Method and validation in controls and patients with multiple sclerosis
- PMID: 36913908
- PMCID: PMC10011049
- DOI: 10.1016/j.nicl.2023.103368
Automatic segmentation of the choroid plexuses: Method and validation in controls and patients with multiple sclerosis
Abstract
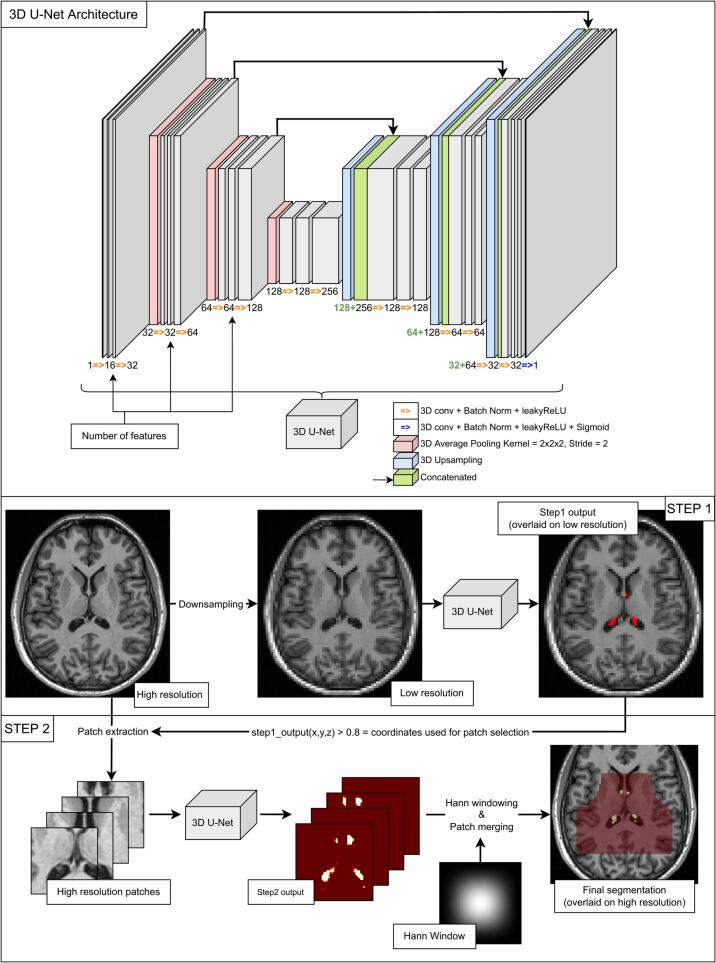
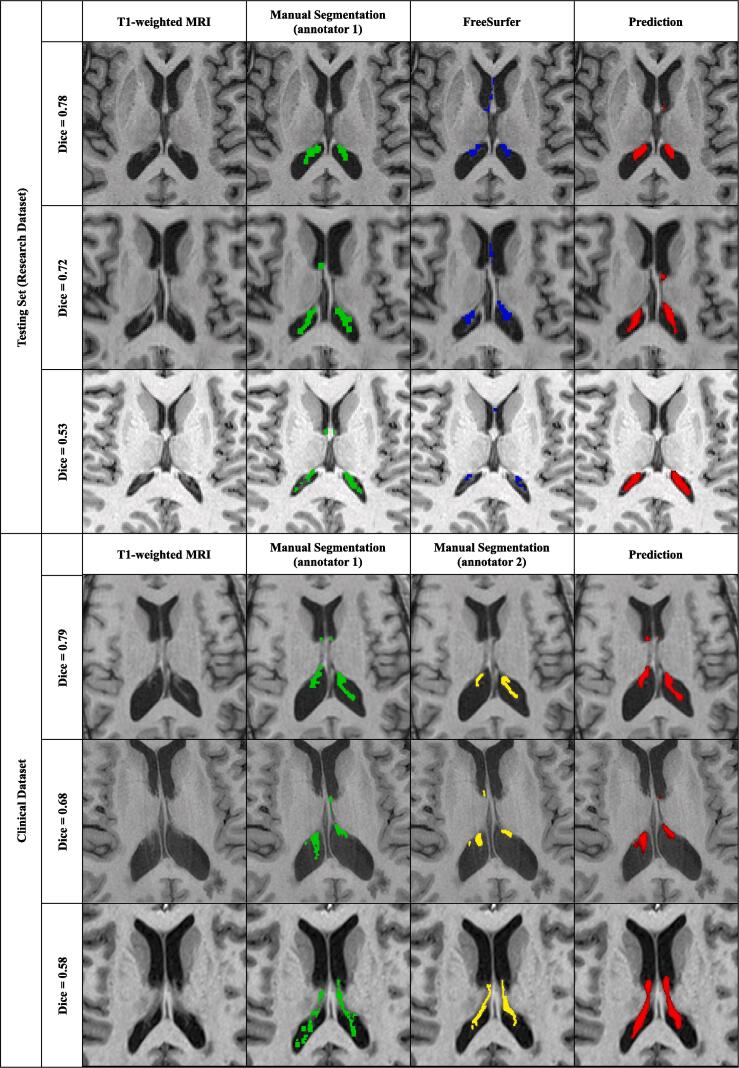
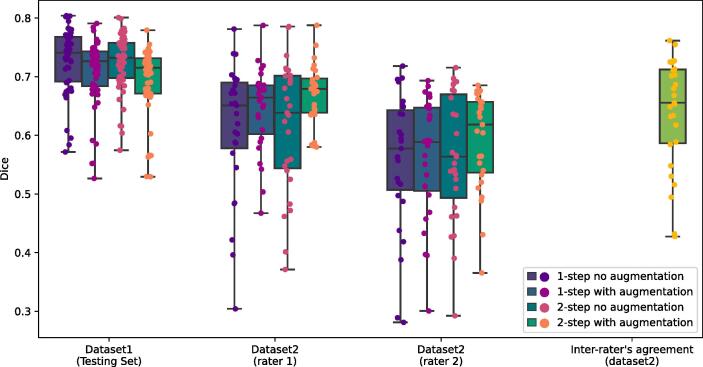
Choroid Plexuses (ChP) are structures located in the ventricles that produce the cerebrospinal fluid (CSF) in the central nervous system. They are also a key component of the blood-CSF barrier. Recent studies have described clinically relevant ChP volumetric changes in several neurological diseases including Alzheimer's, Parkinson's disease, and multiple sclerosis (MS). Therefore, a reliable and automated tool for ChP segmentation on images derived from magnetic resonance imaging (MRI) is a crucial need for large studies attempting to elucidate their role in neurological disorders. Here, we propose a novel automatic method for ChP segmentation in large imaging datasets. The approach is based on a 2-step 3D U-Net to keep preprocessing steps to a minimum for ease of use and to lower memory requirements. The models are trained and validated on a first research cohort including people with MS and healthy subjects. A second validation is also performed on a cohort of pre-symptomatic MS patients having acquired MRIs in routine clinical practice. Our method reaches an average Dice coefficient of 0.72 ± 0.01 with the ground truth and a volume correlation of 0.86 on the first cohort while outperforming FreeSurfer and FastSurfer-based ChP segmentations. On the dataset originating from clinical practice, the method reaches a Dice coefficient of 0.67 ± 0.01 (being close to the inter-rater agreement of 0.64 ± 0.02) and a volume correlation of 0.84. These results demonstrate that this is a suitable and robust method for the segmentation of the ChP both on research and clinical datasets.
Keywords: Choroid plexus; Deep learning; Multiple sclerosis; Radiologically isolated syndrome; Segmentation.
Copyright © 2023 The Author(s). Published by Elsevier Inc. All rights reserved.
Conflict of interest statement
Declaration of Competing Interest The authors declare that they have no known competing financial interests or personal relationships that could have appeared to influence the work reported in this paper.
Figures
References
-
- Biewald, L., 2020. Experiment tracking with weights and biases.
-
- Choi J.D., Moon Y., Kim H.-J., Yim Y., Lee S., Moon W.-J. Choroid plexus volume and permeability at brain MRI within the Alzheimer disease clinical spectrum. Radiology. 2022;304(3):635–645. - PubMed
-
- Çiçek, Ö., Abdulkadir, A., Lienkamp, S.S., Brox, T., Ronneberger, O., 2016. 3D U-Net: Learning Dense Volumetric Segmentation from Sparse Annotation. ArXiv160606650 Cs.
-
- Egorova N., Gottlieb E., Khlif M.S., Spratt N.J., Brodtmann A. Choroid plexus volume after stroke. Int. J. Stroke. 2019;14(9):923–930. - PubMed
Publication types
MeSH terms
LinkOut - more resources
Full Text Sources
Medical
