. 2023 May;14(3):438-450.
doi: 10.1016/j.advnut.2023.03.004. Epub 2023 Mar 11.

Effects of Dairy Intake on Markers of Cardiometabolic Health in Adults: A Systematic Review with Network Meta-Analysis

Affiliations

Effects of Dairy Intake on Markers of Cardiometabolic Health in Adults: A Systematic Review with Network Meta-Analysis

Eva Kiesswetter et al. Adv Nutr. 2023 May.

Abstract

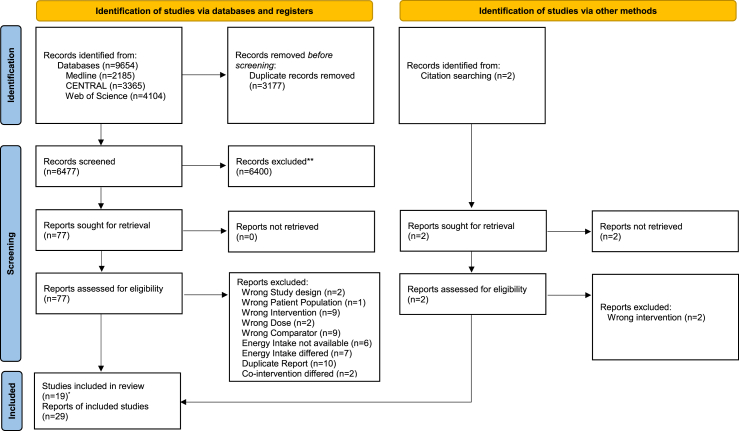
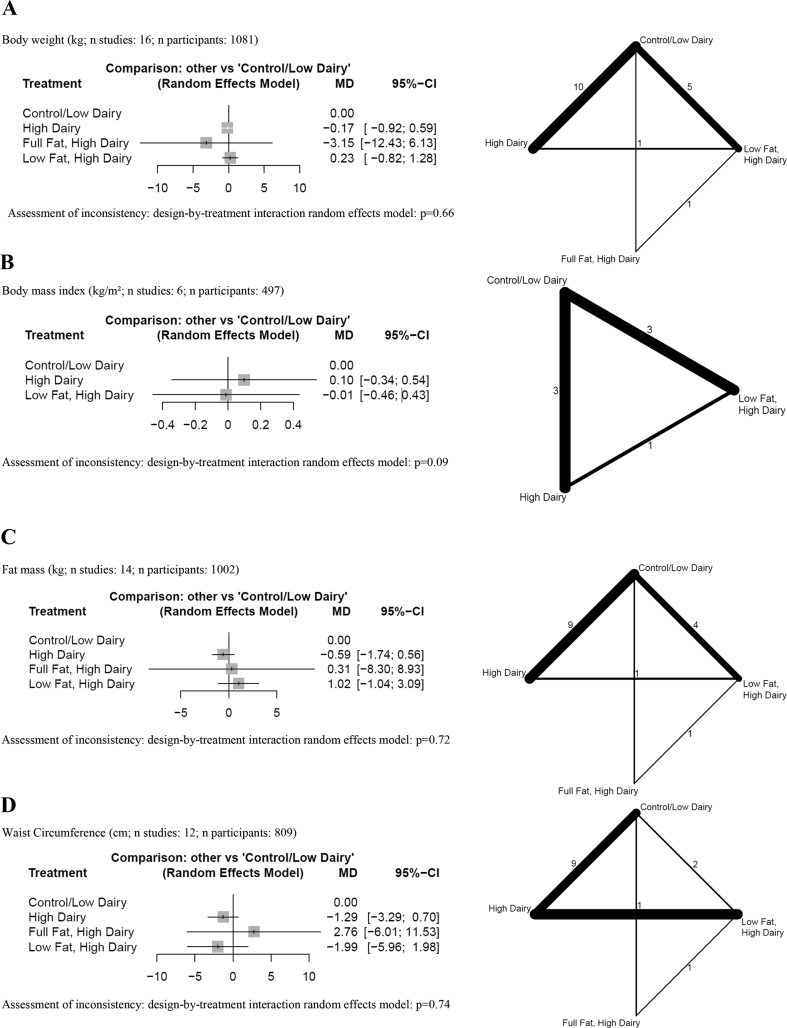
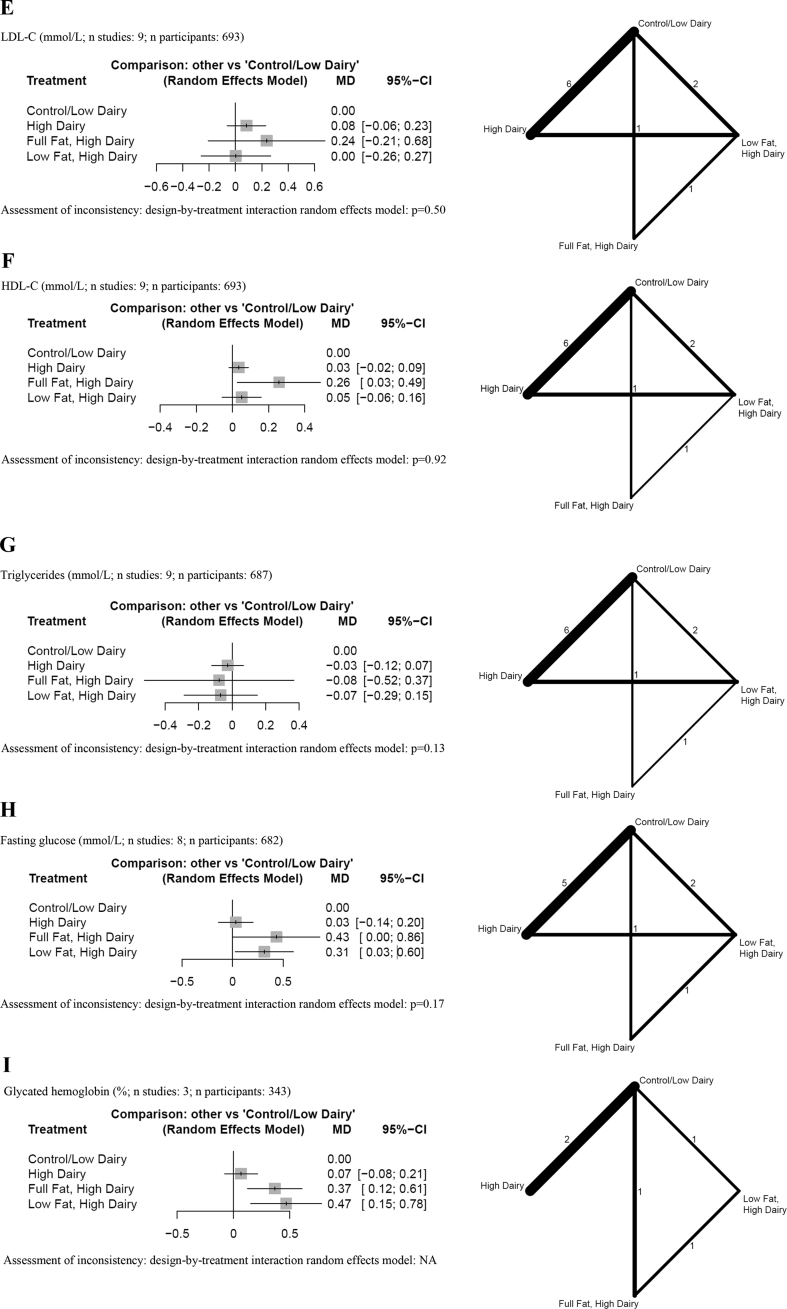
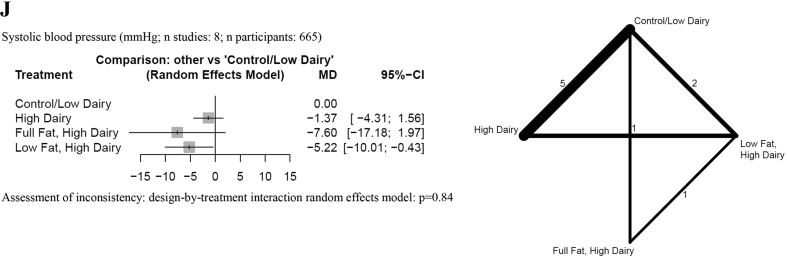
The health effects of dairy products are still a matter of scientific debate owing to inconsistent findings across trials. Therefore, this systematic review and network meta-analysis (NMA) aimed to compare the effects of different dairy products on markers of cardiometabolic health. A systematic search was conducted in 3 electronic databases [MEDLINE, Cochrane Central Register of Controlled Trials (CENTRAL), and Web of Science; search date: 23 September 2022]. This study included randomized controlled trials (RCTs) with a ≥12-wk intervention comparing any 2 of the eligible interventions [e.g., high dairy (≥3 servings/d or equal amount in grams per day), full-fat dairy, low-fat dairy, naturally fermented milk products, and low dairy/control (0-2 servings/d or usual diet)]. A pairwise meta-analysis and NMA using random-effects model was performed in the frequentist framework for 10 outcomes [body weight, BMI, fat mass, waist circumference, low-density lipoprotein cholesterol, high-density lipoprotein (HDL) cholesterol, triglycerides, fasting glucose, glycated hemoglobin, and systolic blood pressure]. Continuous outcome data were pooled using mean differences (MDs) and dairy interventions ranked using the surface under the cumulative ranking curve. Nineteen RCTs with 1427 participants were included. High-dairy intake (irrespective of fat content) showed no detrimental effects on anthropometric outcomes, blood lipids, and blood pressure. Both low-fat and full-fat dairy improved systolic blood pressure (MD: -5.22 to -7.60 mm Hg; low certainty) but, concomitantly, may impair glycemic control (fasting glucose-MD: 0.31-0.43 mmol/L; glycated hemoglobin-MD: 0.37%-0.47%). Full-fat dairy may increase HDL cholesterol compared with a control diet (MD: 0.26 mmol/L; 95% CI: 0.03, 0.49 mmol/L). Yogurt improved waist circumference (MD: -3.47 cm; 95% CI: -6.92, -0.02 cm; low certainty), triglycerides (MD: -0.38 mmol/L; 95% CI: -0.73, -0.03 mmol/L; low certainty), and HDL cholesterol (MD: 0.19 mmol/L; 95% CI: 0.00, 0.38 mmol/L) compared with milk. In conclusion, our findings indicate that there is little robust evidence that a higher dairy intake has detrimental effects on markers of cardiometabolic health. This review was registered at PROSPERO as CRD42022303198.

Keywords: body weights and measures; cardiometabolic risk; dairy products; energy intake; glycemic control; network meta-analysis; systematic review.


Figures

FIGURE 1
FIGURE 1
PRISMA 2020 flow diagram. ∗Two studies were reported in 1 record From: Page MJ, McKenzie JE, Bossuyt PM, Boutron I, Hoffmann TC, Mulrow CD, et al. The PRISMA 2020 statement: an updated guideline for reporting systematic reviews. BMJ 2021;372:n71. doi: 10.1136/bmj.n71. For more information, visit: http://www.prisma-statement.org/
FIGURE 2
FIGURE 2
Forest plots summarizing MDs with 95% CIs and network plots for (A) body weight, (B) BMI, (C) fat mass, (D) waist circumference, (E) LDL cholesterol, (F) HDL cholesterol, (G) triglycerides, (H) fasting glucose, (I) glycated hemoglobin, and (J) systolic blood pressure as estimated from the network meta-analysis on total dairy intake with a combined control/low-dairy group. Control/low dairy, usual diet or a diet with 0–2 dairy servings/d or an equal amount in grams per day; high dairy, ≥3 dairy servings/d or an equal amount in grams per day; full-fat dairy, dairy products with its natural fat content; low fat dairy, skimmed or semiskimmed dairy products. Network plots: line width, weight from random-effects model comparing 2 treatments; numbers: the number of studies directly comparing treatments. MD, mean difference; NA, not applicable.
FIGURE 2
FIGURE 2
Forest plots summarizing MDs with 95% CIs and network plots for (A) body weight, (B) BMI, (C) fat mass, (D) waist circumference, (E) LDL cholesterol, (F) HDL cholesterol, (G) triglycerides, (H) fasting glucose, (I) glycated hemoglobin, and (J) systolic blood pressure as estimated from the network meta-analysis on total dairy intake with a combined control/low-dairy group. Control/low dairy, usual diet or a diet with 0–2 dairy servings/d or an equal amount in grams per day; high dairy, ≥3 dairy servings/d or an equal amount in grams per day; full-fat dairy, dairy products with its natural fat content; low fat dairy, skimmed or semiskimmed dairy products. Network plots: line width, weight from random-effects model comparing 2 treatments; numbers: the number of studies directly comparing treatments. MD, mean difference; NA, not applicable.

References

    1. Dietary Guidelines Advisory Committee . US Department of Agriculture, Agricultural Research Service; Washington, DC: 2015. Scientific Report of the 2015 Dietary Guidelines Advisory Committee: Advisory Report to the Secretary of Health and Human Services and the Secretary of Agriculture.
    1. Weaver C.M. How sound is the science behind the dietary recommendations for dairy? Am. J. Clin. Nutr. 2014;99(5 Suppl):1217s–1222s. - PMC - PubMed
    1. Willett W.C., Ludwig D.S. Milk and health. N. Engl. J. Med. 2020;382(7):644–654. - PubMed
    1. Schlesinger S., Neuenschwander M., Schwedhelm C., Hoffmann G., Bechthold A., Boeing H., et al. Food groups and risk of overweight, obesity, and weight gain: a systematic review and dose-response meta-analysis of prospective studies. Adv. Nutr. 2019;10(2):205–218. - PMC - PubMed
    1. Schwingshackl L., Schwedhelm C., Hoffmann G., Knüppel S., Iqbal K., Andriolo V., et al. Food groups and risk of hypertension: a systematic review and dose-response meta-analysis of prospective studies. Adv. Nutr. 2017;8(6):793–803. - PMC - PubMed

Publication types