. 2023 Mar 13;9(1):28.
doi: 10.1038/s41421-023-00532-4.

Single-cell and spatial dissection of precancerous lesions underlying the initiation process of oral squamous cell carcinoma

Affiliations

Single-cell and spatial dissection of precancerous lesions underlying the initiation process of oral squamous cell carcinoma

Lulu Sun et al. Cell Discov. .

Abstract

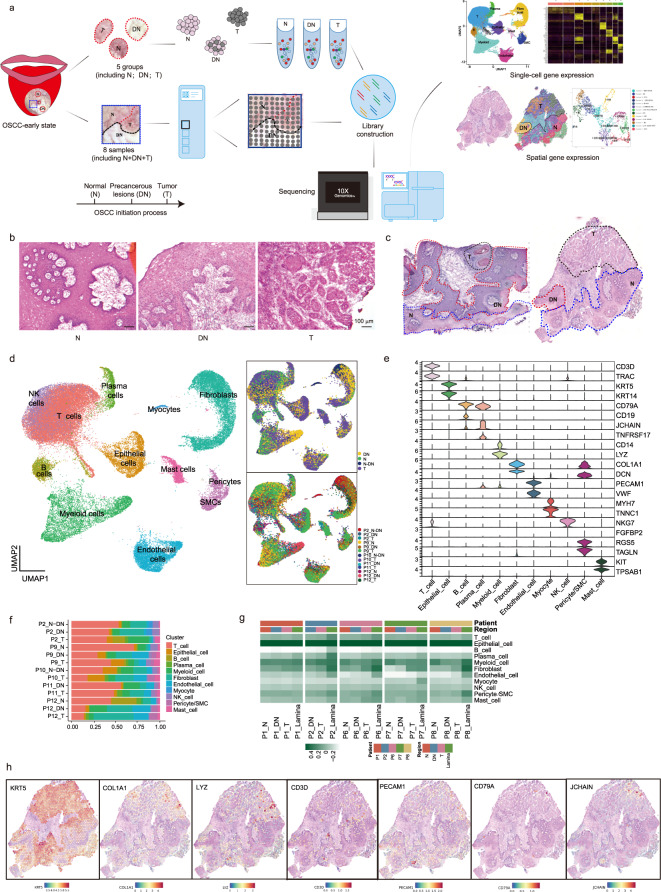
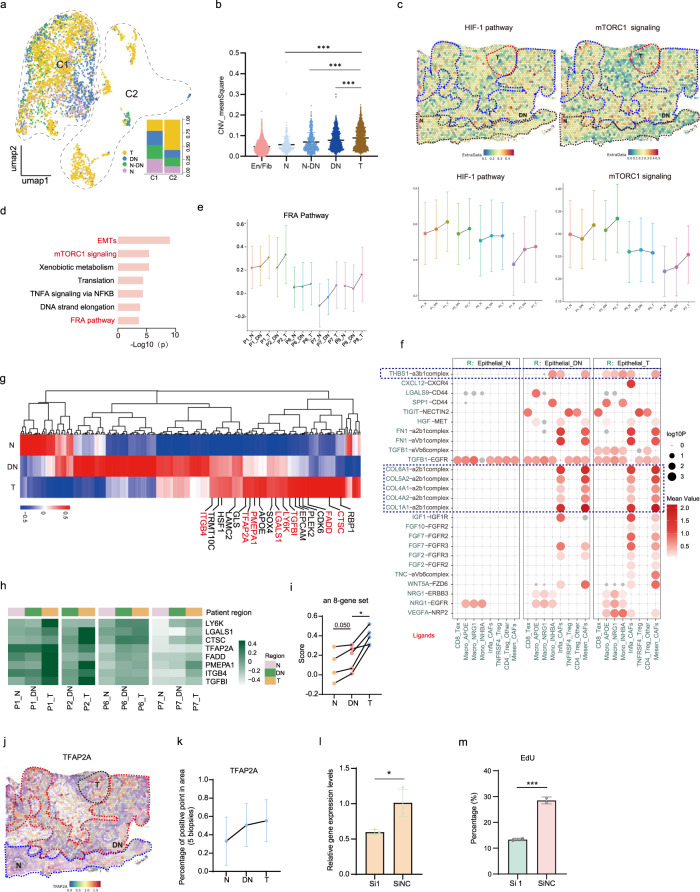
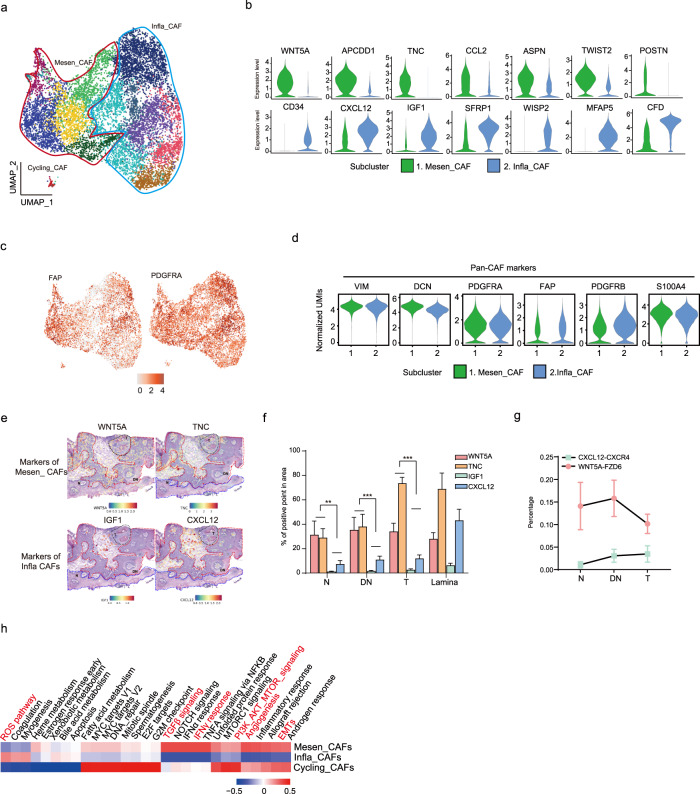
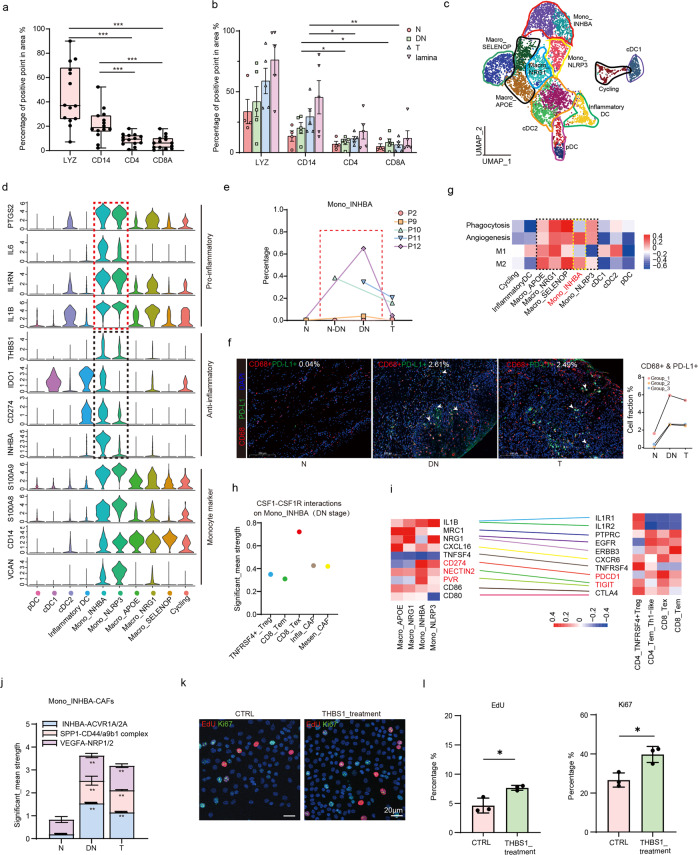
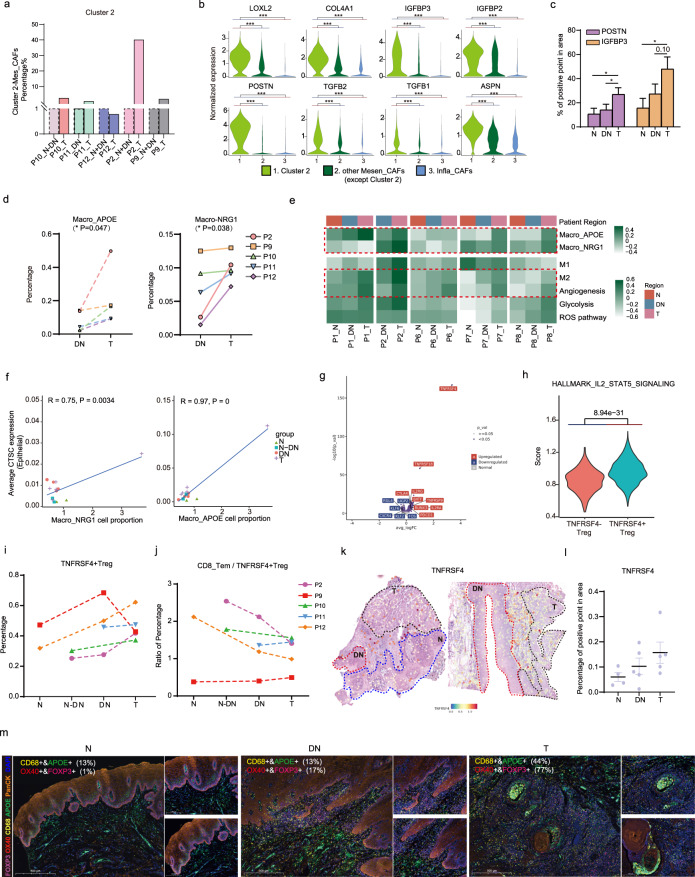
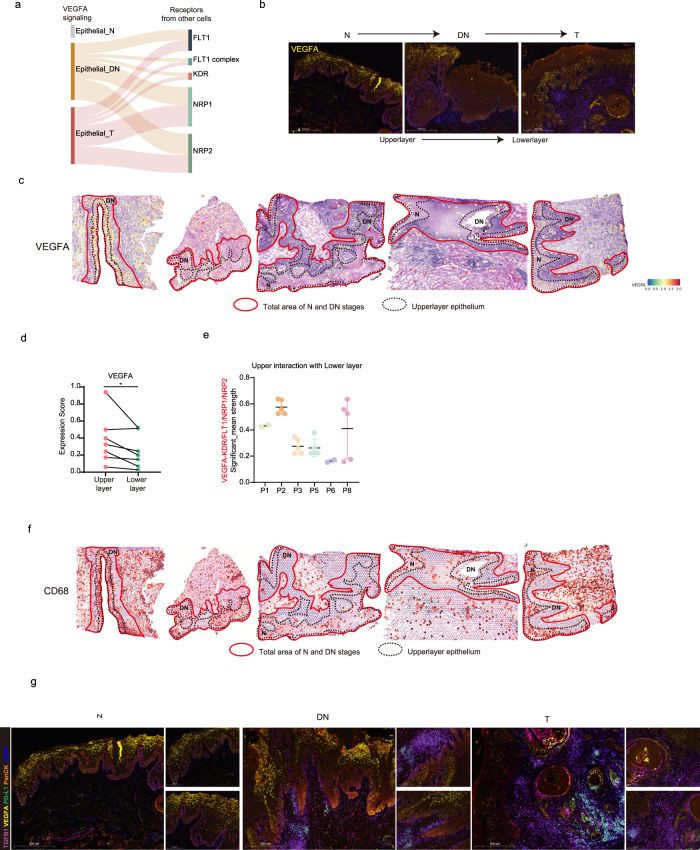
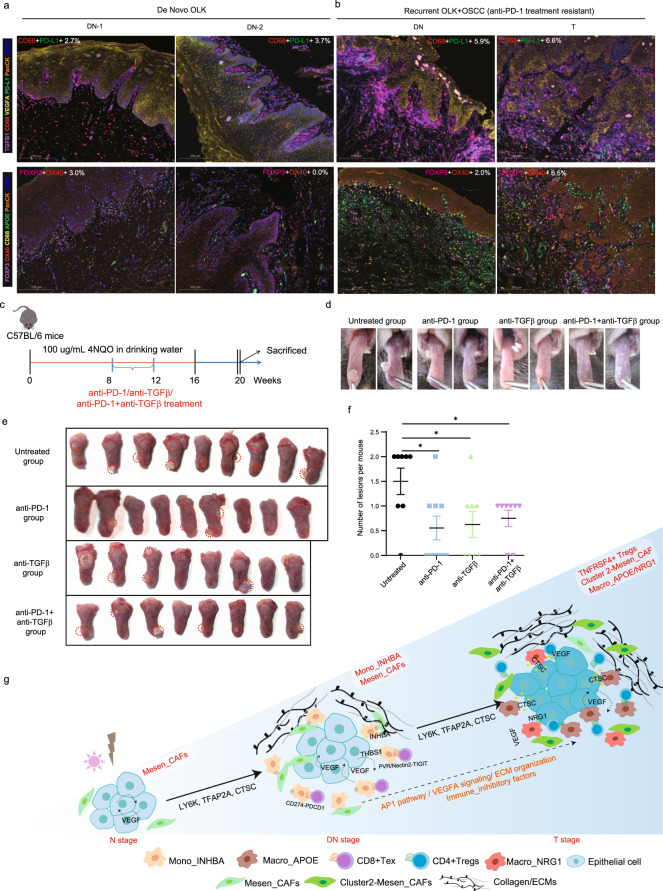
Precancerous lesions of the oral mucosa, especially those accompanied by moderate to severe dysplasia, contribute to the initiation of oral squamous cell carcinoma (OSCC). However, the cellular compositions and spatial organization of the precancerous stage and how these factors promote human OSCC initiation remain unclear. Here, we built a single-cell transcriptome atlas and a spatial transcriptome map after obtaining data from pairwise human oral mucosal biopsies of 9 individuals consisting of very early-stage OSCC, adjacent precancerous lesions with moderate to severe dysplasia, as well as a matched normal region. An altered epithelial gene-expression profile was identified which favored OSCC initiation. This observation was coupled with distinct fibroblast, monocytic, and regulatory T-cell subclusters involved in reshaping the microenvironment. In particular, a unique immune-inhibitory monocyte subtype and spatial-switching regulation of VEGF signaling were observed surrounding precancerous lesions, concertedly strengthening activities in promoting cancer initiation. Collectively, our work elucidated the cellular landscapes and roles of precancerous lesions underlying OSCC initiation, which is essential for understanding the entire OSCC initiation process and helps inform therapeutic strategies for cancer intervention.


Conflict of interest statement

The authors declare no competing interests.

Figures

Fig. 1
Fig. 1. A single-cell and ST profiling of pairwise oral mucosal biopsies, comprising early OSCCs, adjacent precancerous lesions, and matched normal regions.
a Schematic diagram illustrating the workflow of human oral mucosal biopsies processing for scRNA-seq and ST analyses. N normal, DN dysplasia, T tumor. b Representative H&E staining of tissue samples biopsied for scRNA-seq at the distinct stage during OSCC initiation. Scale bar: 100 μm. c H&E images of ST samples. Initiation stages were indicated at different spatial locations under the guidance of a clinical pathologist. d UMAP representation of single cells profiled in the presenting work colored by major cell types (left), tumor initiation stages (right top) and individuals (right, bottom). e Expression levels of diverse marker genes by annotated cell types. f Bar plots showing the proportion of cell types included in each individual for scRNA-seq. g Heatmap displaying enrichment of cell types in ST samples which were annotated in scRNA-seq. Note that the labeled initiation stages of ST samples were carefully divided under the guidance of a clinical pathologist. h ST feature plots of P1 showing expression of marker genes by annotated cell types.
Fig. 2
Fig. 2. Identification of the initiation-associated epithelial markers and pathways.
a UMAP plots showing epithelial cells of diverse stages. Their proportions in C1 and C2 clusters were circled in the map and the statistics were shown in bar plot. b Statistical results showing CNV-meanSquare of epithelial cells at different initiation stages. Endothelial cells and fibroblasts as a whole represented the baseline reference. Nonparametric unpaired t-tests were used to calculate the statistical significance. ***P < 0.001. c Characterization of OSCC initiation process with ST feature plots from P6 showing cancer-related pathways (Top). Changes of these pathways’ activities in patients of ST. Each dot indicated the median of the pathway activity in the corresponding N, DN or T region (Bottom). d Enriched GO functions of DEGs with gradual-increased expression among epithelial cells from N, DN, and T stages. FDR q value < 0.05. e Changes of FRA pathway activities along with tumor initiation process in ST. Each dot indicated the median of the pathway activity in the corresponding region. f Dotplots showing the significance (−log10 P value) and strength (mean value) of specific interactions between T, Myeloid, and cancer-associated fibroblast (CAF) cells with epithelial cells at N, DN, and T stages. Significant mean and significance (P < 0.05) were calculated based on the interaction and the normalized cell matrix was achieved by Seurat Normalization. g Heatmap of DEGs between epithelial cells of diverse initiation stages. The eight genes confirmed by ST were marked red. h Heatmap for statistical analyses of 8 initiation-associated genes expression in ST feature plots (each row shared a color scale, while different columns did not). i Statistical analysis of the eight initiation-associated genes expression in five ST feature plots. The dot plots display statistical score values for theses eight-gene sets in each region of tissue sections. A two-tailed paired Student’s t-test for the P values. *P < 0.05. j Spatial feature plots of TFAP2A in tissue sections of P6. k Statistical results showing proportions of TFAP2A positive points in different tissue regions by ST analyses. l The gene-expression levels of TFAP2A in siTFAP2A and siNC group. Data were presented as the mean ± s.d. NC control group. m Quantification of EdU-positive cell proportions in siTFAP2A groups. Four representative pictures of each group were used for quantification. A two-tailed unpaired Student’s t-test for the P values in l, m. *P < 0.05; ***P < 0.001.
Fig. 3
Fig. 3. Mesen_CAF was prominent in OSCC initiation.
a UMAP plots showing the subpopulations of fibroblasts. b Violin plot showing seven representative marker genes expressions of Mesen_CAFs and Infla_CAFs. c UMAP feature plots showing expression distribution of cancer-associated fibroblast cell markers FAP and PDGFRA in single fibroblast cells. d Violin plot showing gene-expression levels of pan-CAF markers in two fibroblasts’ subpopulations. e Spatial feature plots of Mesen_CAFs markers (WNT5A and TNC) and Infla_CAFs markers (IGF1 and CXCL12) in tissue sections of P6. f Statistical results showing proportions of (WNT5A, TNC, IGF1 and CXCL12) positive points in different tissue regions by ST analyses. A two-tailed unpaired Student’s t-test for the P values. **P < 0.01. ***P < 0.001. g Statistics for scoring the positive points of CXCL12–CXCR4 and WNT5a–FZD6 interactions in 5 representative spatial feature plots. h Enriched Hallmark gene sets in Mesen_CAFs and Infla_CAFs with QuSAGE.
Fig. 4
Fig. 4. Mono_INHBA was enriched in DN stage and interacted frequently with other stromal cells.
a, b Statistics showing percentage of positive points for LYZ, CD14, CD4, and CD8A in whole regions (including N, DN, T, and lamina region) (a) and separate regions (b) of the five representative spatial feature plots. A two-tailed paired Student’s t-test for the P values. *P < 0.05, **P < 0.01, ***P < 0.001. c UMAP representation of single myeloid cells colored by subclusters. Those irregular markers represent different identified cell types. d Violin plots showing expression levels of selected inflammation-associated genes and monocyte markers across different myeloid cell types from scRNA-seq data. e The line charts showing changes of Mono_INHBA cell proportions in each individual from N, DN to T stages. f mIHC staining of CD68 and PD-L1 in one patient of diverse initiation stages. Scale bars: 200 μm. Note that the statistic quantification was the average results of several representative pictures (left). The quantitation of CD68+ & PD-L1+ cell fractions in each group were provided (right). (n = 3 groups). g Enriched M1/M2/angiogenesis/phagocytosis pathways in different myeloid cell types done with QuSAGE. h CSF1–CSF1R interactions on Mono_INHBA in DN stage. Significant mean and significance (P < 0.05) were calculated based on the interaction and the normalized cell matrix achieved by Seurat Normalization. i Z-scored mean log expression heatmap of lymphatic ligands in monocytic cells (left) and receptors in T subclusters (right) from scRNA-seq data. Colored lines connect matching ligands for receptor. j Bar plots showing the significant_mean strength of representative interactions between Mono_INHBA and CAFs in N, DN, and T stages of OSCC initiation. Two-sided Wilcoxon rank-sum tests were used to calculate the statistical significance. **P < 0.01. k Representative images of EdU and Ki67 staining in OLK organoids upon THBS1 treatment. Scale bars: 20 μm. l Quantification of EdU (left)/Ki67(right)-positive cell proportions in OLK organoids with THBS1 treatment. Three representative pictures of each group were used for quantification. A two-tailed unpaired Student’s t-test for the P values. *P < 0.05.
Fig. 5
Fig. 5. Cluster 2-Mesen_CAF, Macro_APOE/NRG1 and TNFRSF4+ Treg cells were increased from DN to T stage.
a Cell proportions of Cluster 2-Mesen_CAF (Cluster 2-Mesen_CAF/CAF) in patients of T stage compared with N + DN stages by scRNA-seq data. b Violin plot displaying Cluster 2 marker gene expressions in Cluster 2-Mesen_CAF, other clusters in Mesen_CAF and Infla_CAF. Two-sided Wilcoxon rank-sum tests for analyzing the significance of their differences. ***P < 0.001. c Statistical results showing proportions of (IGFBP3, POSTN) positive points in different tissue regions by ST analyses. A two-tailed unpaired Student’s t test for the P values. *P < 0.05. d The line charts showing changes of (Macro_APOE/NRG1) cell proportions in each individual from DN to T stage. A two-tailed paired Student’s t test for the P values. *P < 0.05. e Heatmap showing enrichment Macro_APOE/NRG1 and degrees of M1/M2/angiogenesis/glycolysis/ROS pathways by comparison of their marker genes expression levels in different distributions of ST samples. Each row shared a color scale, while different columns did not. f Pearson correlation plot showing significant positive correlation of Macro_APOE/NRG1 proportion to average CTSC expression in the epithelial cells. Cor.test() was used for conducting correlation and the statistical analyses. g Volcano plots showing strikingly DEGs between TNFRSF4+ Tregs and TNFRSF4 Tregs. h Violin plots showing the metagene expression of the IL2-STAT5 signaling in TNFRSF4+ and TNFRSF4 Tregs. P value was calculated by Wilcoxon test. i Cell proportions of TNFRSF4+ Treg cells in patients of diverse initiation stages by scRNA-seq data. j Proportions of cell number ratios of CD8_Tem cells to CD4_TNFRS4+ Treg cells in patients by scRNA-seq data. k ST feature plots of P1 and P2 showing expression of TNFRSF4 in different distributions. l Statistical results showing proportions of TNFRSF4 positive points in different tissue regions by ST analyses (right). m mIHC staining of APOE, CD68, FOXP3, OX40 (TNFRSF4) and panCK in one patient of diverse initiation stages. Scale bars: 500 μm. The numbers in images indicated (CD68+ &APOE+ ; FOXP3+ &OX40+) double-positive cell proportions among corresponding CD68+ and FOXP3+ cells.
Fig. 6
Fig. 6. Spatial distribution of VEGF signaling during cancer initiation.
a Alluvial plot showing selected VEGFA–NRP1/NRP2/KDR/FLT1 interactions between different initiation stages of epithelial cells and other cell subclusters. b mIHC staining of VEGFA in one patient of diverse initiation stages. Scale bars: 500 μm. c ST feature plots showing the expression of VEGFA in different distributions. Red solid lines circled total epithelium region of N and DN stages; black dotted lines indicated the upper layer of epithelium, mainly composed of differentiated keratinocytes. d Quantitative scores of expression levels of VEGFA in upper and lower layer of the corresponding ST sections. A two-tailed paired Student’s t-test for the P values. *P < 0.05. e Scores of VEGFA-NRP1/NRP2/KDR/FLT1 interactions between the upper layer and lower layer of epithelium in diverse ST sections. Significant mean and significance (P < 0.05) were calculated based on the interaction and the normalized cell matrix achieved by Seurat Normalization. f ST feature plots showing the expression of CD68 in different distributions. Red solid lines circled total epithelium region of N and DN stages; black dotted lines indicated the upper layer of epithelium, mainly composed of differentiated keratinocytes. g mIHC staining of VEGFA, PD-L1, TGFβ1, and PanCK in one patient of diverse initiation stages. Scale bars: 500 μm.
Fig. 7
Fig. 7. mIHC staining showing clinical relevance and cellular crosstalk landscape for OSCC initiation.
a, b mIHC staining of two groups of selected markers (Group 1: PD-L1, TGFβ1, VEGFA, CD68, and PanCK; Group 2: APOE, CD68, FOXP3, OX40, and PanCK) in the samples of de novo OLK (a) and recurrent OSCC with OLK (b). Those recurrent OSCC samples with recurrent OLK were taken from patients who had OLK-derived OSCC before. The patients were under a clinical trial focusing on anti-PD-1 antibody treatment. Scale bars: 200 μm. Statistical quantification is shown in each image. c Flowchart showing the induction of OSCC by 4NQO in C57BL/6 mice and intraperitoneal injection of anti-PD-1/anti-TGFβ/anti-PD-1+ anti-TGFβ antibody in each treatment group. d Representative intraoral lesions on the tongues of mice in each group. e Macroscopic lesions on the tongues of each group. The dotted circle indicates cauliflower-like lesions. f Statistical results for quantification of the macroscopic cauliflower-like lesions in each treated and untreated group. A two-tailed Student’s t-test for the P values. *P < 0.05. g Potential maps on malignant transformation of epithelial cells and dynamic crosstalk between epithelial cells and the TMEs during OSCC initiation.

References

    1. Pich O, et al. The translational challenges of precision oncology. Cancer Cell. 2022;40:458–478. doi: 10.1016/j.ccell.2022.04.002. - DOI - PubMed
    1. Galon J, Bruni D. Tumor immunology and tumor evolution: intertwined histories. Immunity. 2020;52:55–81. doi: 10.1016/j.immuni.2019.12.018. - DOI - PubMed
    1. Smyth EC, et al. Oesophageal cancer. Nat. Rev. Dis. Prim. 2017;3:17048. doi: 10.1038/nrdp.2017.48. - DOI - PMC - PubMed
    1. Aguirre-Urizar JM, Lafuente-Ibáñez de Mendoza I, Warnakulasuriya S. Malignant transformation of oral leukoplakia: systematic review and meta-analysis of the last 5 years. Oral Dis. 2021;27:1881–1895. doi: 10.1111/odi.13810. - DOI - PubMed
    1. Chaturvedi AK, et al. Oral leukoplakia and risk of progression to oral cancer: q population-based cohort study. J. Natl. Cancer Inst. 2020;112:1047–1054. doi: 10.1093/jnci/djz238. - DOI - PMC - PubMed